

The DOI matches its Crossref record; 2 of the 2 references it cites were found in a registry or an index.
Catenary Electromagnetics for Ultra‐Broadband Lightweight Absorbers and Large‐Scale Flat Antennas
Open accessAbstract
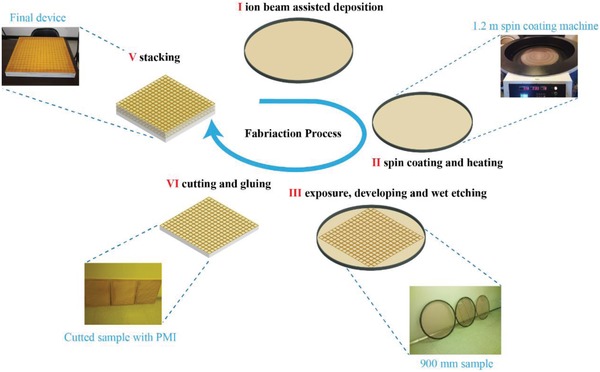
Catenary functions are exciting and fundamental building blocks in constructing various kinds of waves in subwavelength structures. Here, a simple yet powerful approach inspired by catenary optics is proposed to realize efficient manipulation of electromagnetic waves in terms of both amplitude and phase. By properly engineering the catenary electromagnetic fields and frequency dispersion, lightweight metafilm-based broadband absorbers with polarization-independent bandwidth covering 0.65-6.2 GHz are experimentally achieved, and the bandwidth is further broadened to 0.9-40 GHz. With the same approach, a large-scale flat antenna based on generalized reflection is demonstrated in the satellite communication system. To enable the batch manufacturing, a flexible substrate-based microfabrication process is developed with a minimum feature size of down to sub-micrometer and total size up to almost 1 m. These results may provide important guidance for the design of metasurface-based devices.
Overview
The claims and statistics of this paper haven’t been checked yet.
Run the check — free, no account needed. It reads the open-access text and checks the sources it cites.
Integrity signals
Registry
Cites
Statistics
Figures
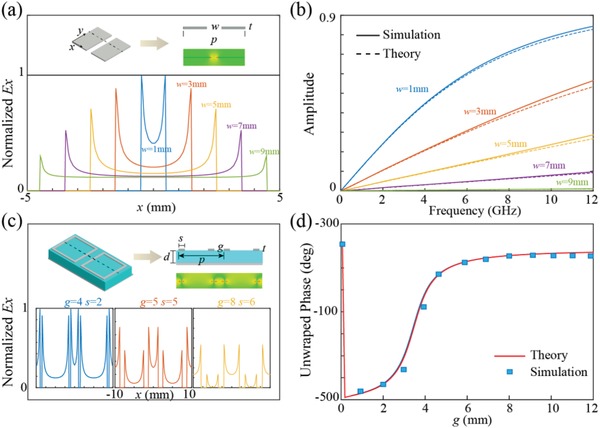
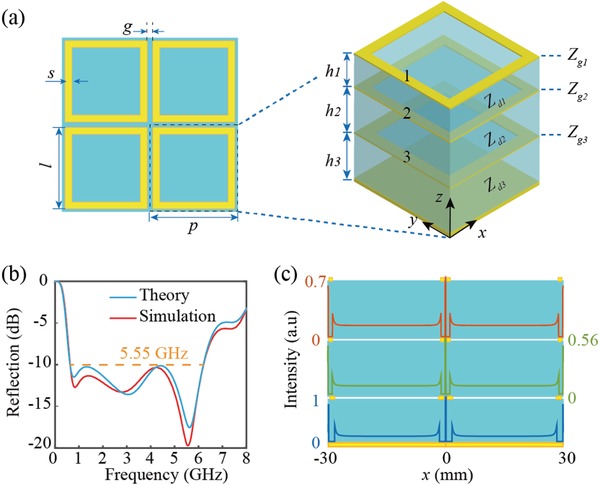
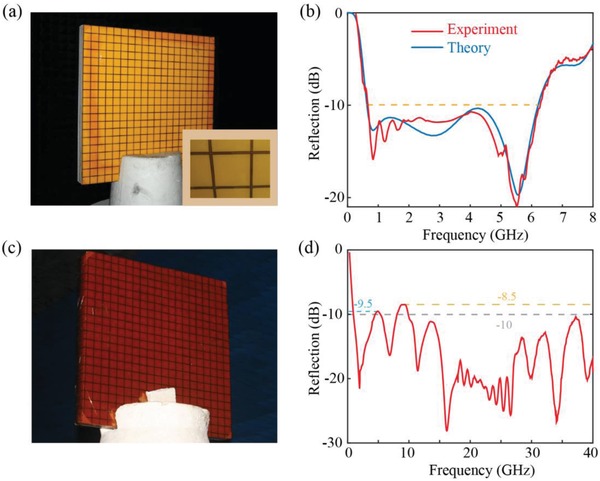
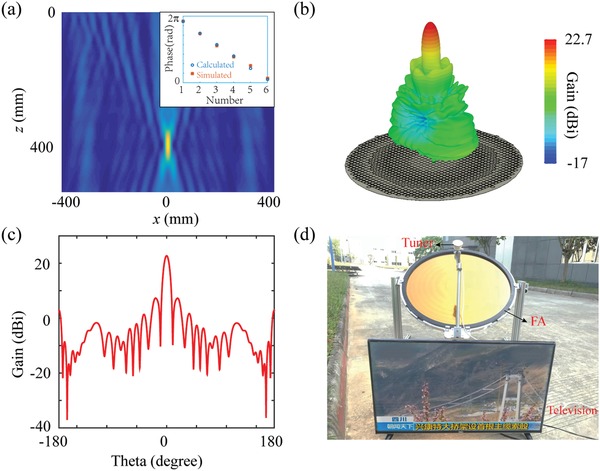
Verification
Claims the paper makes
The claims and statistics of this paper haven’t been checked yet.
Run the check — free, no account needed. It reads the open-access text and checks the sources it cites.
Claims other papers make about this one
Each is checked against this paper’s own text: does it say what the citing paper says it does?
The cited source says what the claim attributes to it.
In the citing paper
“Motivated by catenary optics, Huang et al. [130] developed a flexible substrate-based microfabrication process capable of achieving a minimum feature size of the submicrometer scale.”
From Emerging Technologies in Intelligent Metasurfaces: Shaping the Future of Wireless Communications (2026) · cites this paper as [130]
Self-check
Percentages, sums and reported differences re-computed from the paper’s own numbers.
The self-check needs the paper’s full text.
Citations
Cites
Flat optics with designer metasurfaces
Yu, N., & Capasso, F. (2014) · Nature Materials · doi:10.1038/nmat3839 · Cited by 5,984
Machine learning phases of matter
Carrasquilla, J., & Melko, R. G. (2017) · Nature Physics · doi:10.1038/nphys4035 · Cited by 1,448
Research works printed but not linked: 37
- 10.1002/adom.201701201 · DOI
- 10.1007/s11433-015-5688-1 · DOI
- Luo X., 2018, ACS Photonics
- 10.1364/OE.16.004753 · DOI
- 10.1126/science.1210713 · DOI · Paper page
- 10.1038/s41565-017-0052-4 · DOI
- 10.1038/s41565-017-0034-6 · DOI
- 10.1002/adma.201600625 · DOI
- 10.1126/sciadv.1500396 · DOI
- 10.1126/sciadv.1601102 · DOI
- 10.1039/C8NR01728J · DOI
- 10.1002/advs.201800835 · DOI
- 10.1088/0953-8984/25/21/215301 · DOI
- 10.1063/1.2336078 · DOI
- 10.1063/1.4904905 · DOI
- 10.1016/j.optcom.2017.09.036 · DOI
- 10.1063/1.5003800 · DOI
- 10.1364/OL.37.002133 · DOI
- 10.1021/acsphotonics.8b00437 · DOI
- 10.1364/OE.26.019555 · DOI
- Smythe W. R., 1939, Static and Dynamic Electricity
- 10.1049/el:19820201 · DOI
- 10.1016/S0304-8853(03)00617-6 · DOI
- Liu X. G., 2008, Appl. Phys. Lett., 92, 053115
- 10.1109/MAP.2012.6309153 · DOI
- 10.1049/iet-map.2015.0653 · DOI
- 10.1109/8.884491 · DOI
- 10.1109/LAWP.2017.2780231 · DOI
- 10.1103/PhysRevLett.111.187402 · DOI
- 10.1364/OE.25.024974 · DOI
- 10.1038/srep19885 · DOI
- Nemati A., 2018, Optoelectron. Adv., 1, 18000901
- 10.1049/el:19830460 · DOI
- 10.1049/ip-h-1.1982.0001 · DOI
- Zhang M., 2018, Nanophotonics
- 10.1038/nphoton.2015.69 · DOI · Paper page
- 10.1364/AOP.10.000757 · DOI
Cited by
Sorted by citations
Emerging Technologies in Intelligent Metasurfaces: Shaping the Future of Wireless Communications
An, J., Debbah, M., Cui, T. J., Chen, Z. N., & Yuen, C. (2026) · IEEE Transactions on Antennas and Propagation · doi:10.1109/tap.2025.3571069 · Cited by 72
“Motivated by catenary optics, Huang et al. [130] developed a flexible substrate-based microfabrication process capable of achieving a minimum feature size of the submicrometer scale.”
Emerging Technologies in Intelligent Metasurfaces: Shaping the Future of Wireless Communications
An, J., Debbah, M., Cui, T. J., Chen, Z. N., & Yuen, C. (2024) · arXiv · Cited by 72
“Motivated by catenary optics, Huang et al. [130] developed a flexible substrate-based microfabrication process capable of achieving a minimum feature size of the submicrometer scale.”
Metadata
- Authors
- Huang, Y., Luo, J., Pu, M., Guo, Y., Zhao, Z., Ma, X., Li, X., & Luo, X.
- Affiliations
- Institute of Optics and Electronics, Chinese Academy of Sciences (CN)
- Corresponding author
- Luo, Xiangang
- Venue
- Advanced Science
- Publisher
- Wiley
- Published
- 2019-02
- Volume
- 6
- Issue
- 7
- Pages
- 1801691-1801691
- ISSN
- 2198-3844 (ISSN-L)
- PMC
- PMC6446607
- OpenAlex
- W2912072238
- Cited by
- 161
- References
- 2
- Citations by year
- 2026: 7 · 2025: 14 · 2024: 21 · 2023: 22 · 2022: 20 · 2021: 36 · 2020: 21 · 2019: 19
- FWCI
- 7.44
- Type
- journal article
- Language
- en
- Open access
- gold
- doi.org
- Licence
- Locations
- Advanced Science (publishedVersion, cc-by)
- Europe PMC (PubMed Central) (publishedVersion, cc-by)
- PubMed Central (publishedVersion, cc-by)
- PubMed (publishedVersion)
- DOAJ (DOAJ: Directory of Open Access Journals) (submittedVersion, cc-by-sa)
- Funders
- National Natural Science Foundation of China (61622508, 61622509)
- Topics
- Physical Sciences › Materials Science › Electronic, Optical and Magnetic Materials › Metamaterials and Metasurfaces Applications
- Physical Sciences › Engineering › Electrical and Electronic Engineering › Advanced Antenna and Metasurface Technologies
- Physical Sciences › Physics and Astronomy › Acoustics and Ultrasonics › Acoustic Wave Phenomena Research
- Keywords
- lightweight absorbers, polarization-independent absorption, metacinema, frequency dispersion, flat antenna, satellite communication antennas, metasurfaces, amplitude and phase control
About these checks
Registry, retraction, Cites and statistics results are computed, not judged, with one exception: a printed reference that no index lists is read once by a model before it counts as a citation error. Claims are extracted by a model and kept only when their quote appears verbatim in the text; each cited source is then checked, with a model’s help, for whether it says what the claim relies on. Those verdicts can be wrong — read the claim’s quote and the cited source before relying on one.
Statistics and arithmetic are recomputed, not judged.
Confidence bands are shown only for fields calibrated on our annotated test set. None is calibrated yet, so no band is shown.
What counts as a claim ›How we measure confidence ›How we check this ›
Are you an author, or do you see a problem with this page? Request a review
