Cited by 16Biochemical and Structural CharacterizationProtein Structure and DynamicsGene Regulatory Network Analysis

The DOI matches its Crossref record; 2 of the 2 references it cites were found in a registry or an index.

Dissecting the Determinants of Domain Insertion Tolerance and Allostery in Proteins

Open access

Published version of a preprint

Abstract

Domain insertion engineering is a promising approach to recombine the functions of evolutionarily unrelated proteins. Insertion of light‐switchable receptor domains into a selected effector protein, for instance, can yield allosteric effectors with light‐dependent activity. However, the parameters that determine domain insertion tolerance and allostery are poorly understood. Here, an unbiased screen is used to systematically assess the domain insertion permissibility of several evolutionary unrelated proteins. Training machine learning models on the resulting data allow to dissect features informative for domain insertion tolerance and revealed sequence conservation statistics as the strongest indicators of suitable insertion sites. Finally, extending the experimental pipeline toward the identification of switchable hybrids results in opto‐chemogenetic derivatives of the transcription factor AraC that function as single‐protein Boolean logic gates. The study reveals determinants of domain insertion tolerance and yielded multimodally switchable proteins with unique functional properties.

Overview

The claims and statistics of this paper haven’t been checked yet.

Run the check — free, no account needed. It reads the open-access text and checks the sources it cites.

A few free checks a day · papers already verified open instantly · results are public

Integrity signals

Registry

Crossref · 10.1002/advs.202303496

Cites

2 of 2 references verified0 citation errors · 0 not checkable

Statistics

Figures

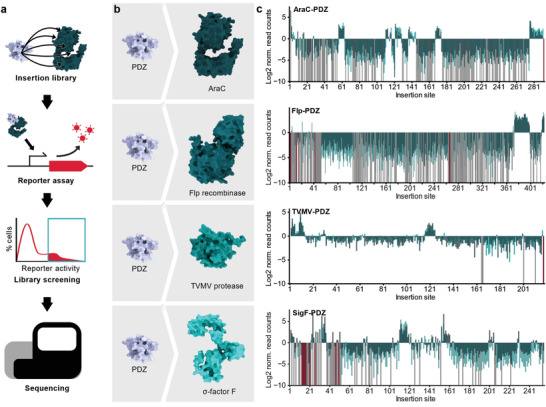
Figure 1 Domain insertion profiling of functionally and structurally diverse proteins. A) Flow chart of the domain insertion screening workflow. B) Overview of the screened PDZ‐domain insertion libraries. The depicted structures of the parent proteins are AF2 predictions. PDB‐ID of PDZ: 1Z86. C) Enrichment score histograms for the different candidate proteins are shown. The Log2 norm. read counts correspond to the fraction of reads after enrichment normalized to the fraction of read counts within the initial library. Data from the four candidate proteins AraC, Flp, TVMV protease, and SigF with PDZ domain inserts are shown. Enrichments are mapped to the respective insertion site as indicated by the position of the acceptor proteins preceding the insertion. Light green, dark green: individual replicates. Grey: variants with zero reads after enrichment. Red: variants missing in the initial library. Insertion sites correspond to residues preceding the inserted domain.
Figure 1 Domain insertion profiling of functionally and structurally diverse proteins. A) Flow chart of the domain insertion screening workflow. B) Overview of the screened PDZ‐domain insertion libraries. The depicted structures of the parent proteins are AF2 predictions. PDB‐ID of PDZ: 1Z86. C) Enrichment score histograms for the different candidate proteins are shown. The Log2 norm. read counts correspond to the fraction of reads after enrichment normalized to the fraction of read counts within the initial library. Data from the four candidate proteins AraC, Flp, TVMV protease, and SigF with PDZ domain inserts are shown. Enrichments are mapped to the respective insertion site as indicated by the position of the acceptor proteins preceding the insertion. Light green, dark green: individual replicates. Grey: variants with zero reads after enrichment. Red: variants missing in the initial library. Insertion sites correspond to residues preceding the inserted domain.CC BY · PubMed Central
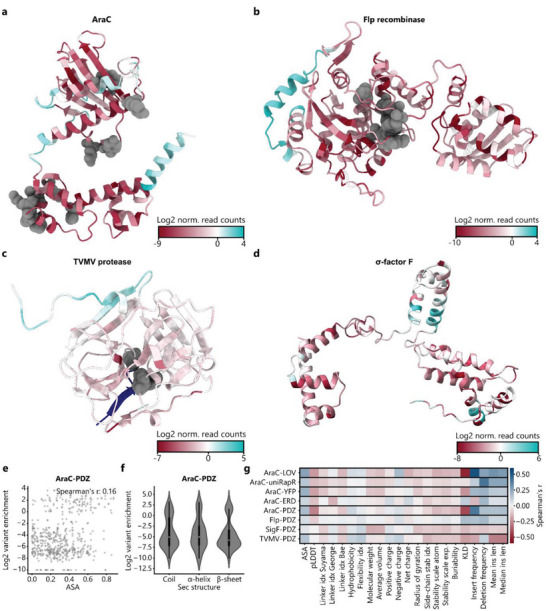
Figure 2 Secondary structure and amino acid features alone do not explain the experimentally observed domain insertion patterns. A) Domain insertion permissive positions are clustered at diverse, locally confined surface sites. The insertion scores from the PDZ libraries are mapped onto the AF2 structure predictions of the candidate proteins namely AraC A) and Flp recombinase B) the crystal structure of the TVMV protease (PDB‐ID: 3MMG) C) and an AF2 structure prediction of SigF D). Functionally critical residues of AraC, Flp, and the TVMV protease are indicated in grey. E) Correlation between variant enrichment and the average surface exposed area (ASA) of the residues neighboring an insertion site are plotted for AraC‐PDZ. Spearman's r is indicated. F) Violin plot of the insertion score distribution with respect to different secondary structure elements is shown for the AraC‐PDZ insertion library. For each insertion site, the secondary structure assignment of the amino acids prior to and after the insertion was considered. The IQR is marked by the box and the median is represented by a white dot. Whiskers extend to the 1.5‐fold IQR or to the value of the smallest or largest enrichment, respectively. G) Spearman correlations between all datasets and diverse positional features are shown (Table S2, Supporting Information. Linker idx: Different amino acid specific linker propensity indices that were reported by the indicated authors.
Figure 2 Secondary structure and amino acid features alone do not explain the experimentally observed domain insertion patterns. A) Domain insertion permissive positions are clustered at diverse, locally confined surface sites. The insertion scores from the PDZ libraries are mapped onto the AF2 structure predictions of the candidate proteins namely AraC A) and Flp recombinase B) the crystal structure of the TVMV protease (PDB‐ID: 3MMG) C) and an AF2 structure prediction of SigF D). Functionally critical residues of AraC, Flp, and the TVMV protease are indicated in grey. E) Correlation between variant enrichment and the average surface exposed area (ASA) of the residues neighboring an insertion site are plotted for AraC‐PDZ. Spearman's r is indicated. F) Violin plot of the insertion score distribution with respect to different secondary structure elements is shown for the AraC‐PDZ insertion library. For each insertion site, the secondary structure assignment of the amino acids prior to and after the insertion was considered. The IQR is marked by the box and the median is represented by a white dot. Whiskers extend to the 1.5‐fold IQR or to the value of the smallest or largest enrichment, respectively. G) Spearman correlations between all datasets and diverse positional features are shown (Table S2, Supporting Information. Linker idx: Different amino acid specific linker propensity indices that were reported by the indicated authors.CC BY · PubMed Central
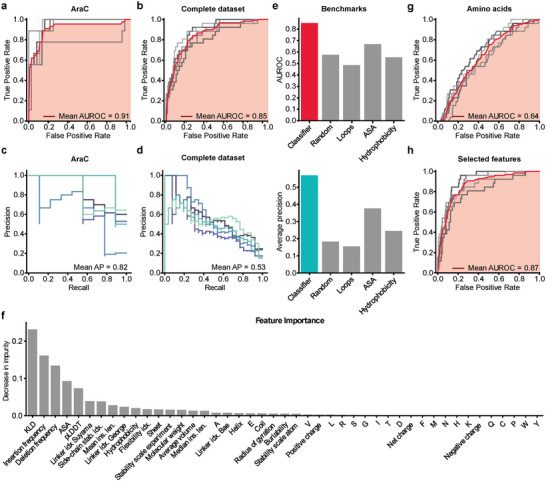
Figure 3 Gradient boosting classifier models reveal parameters informative of domain insertion tolerance. A,B) ROC curves of the model trained with fivefold cross‐validation on the AraC‐PDZ dataset A) or the combined PDZ datasets of all candidate proteins B). Results from individual cross‐validations are shown in grey and the mean ROC is depicted in red (see Experimental Section 4.13 for details on the used metrics). C,D) Precision‐recall metrics for individual cross‐validation folds are shown. The mean average precision (Mean AP) is indicated. E), The AUROC and average precision of the trained classifier and different benchmarks are shown. The metrics were assessed on a previously withheld test set. F) Bar plot indicating the Gini importance (i.e., mean decrease in impurity) of each feature for the model trained on the full dataset. G) The ROC metric of a gradient boosting model that was trained exclusively on the amino acid identities is shown. H) ROC of a model that was trained on a subset of features comprised of Deletion frequency, KLD, insert frequency, mean insertion length, the linker propensity index by Suyama[ 25 ] and the pLDDT score from AF2 structure predictions. A,B,G,H) The ROC is depicted for individual folds in grey and the mean ROC in red. The mean AUC is marked in light red. Precise values are indicated.
Figure 3 Gradient boosting classifier models reveal parameters informative of domain insertion tolerance. A,B) ROC curves of the model trained with fivefold cross‐validation on the AraC‐PDZ dataset A) or the combined PDZ datasets of all candidate proteins B). Results from individual cross‐validations are shown in grey and the mean ROC is depicted in red (see Experimental Section 4.13 for details on the used metrics). C,D) Precision‐recall metrics for individual cross‐validation folds are shown. The mean average precision (Mean AP) is indicated. E), The AUROC and average precision of the trained classifier and different benchmarks are shown. The metrics were assessed on a previously withheld test set. F) Bar plot indicating the Gini importance (i.e., mean decrease in impurity) of each feature for the model trained on the full dataset. G) The ROC metric of a gradient boosting model that was trained exclusively on the amino acid identities is shown. H) ROC of a model that was trained on a subset of features comprised of Deletion frequency, KLD, insert frequency, mean insertion length, the linker propensity index by Suyama[ 25 ] and the pLDDT score from AF2 structure predictions. A,B,G,H) The ROC is depicted for individual folds in grey and the mean ROC in red. The mean AUC is marked in light red. Precise values are indicated.CC BY · PubMed Central
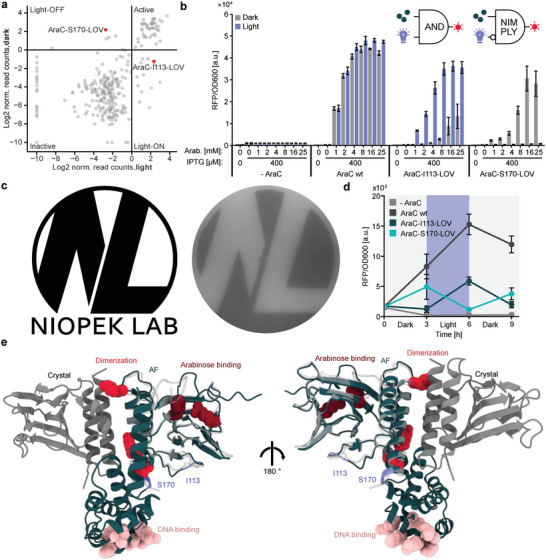
Figure 4 LOV2 domain insertion screening yields chemo‐optogenetic AND and NIMPLY gates. A) Scatterplot showing the relation between the enrichment scores of individual variants for the libraries incubated in the light and dark. B) Characterization of light‐responsive AraC variants. Inducers were supplied in the indicated concentrations. The samples were incubated under light exposure or in darkness, followed by measurements of reporter fluorescence (RFP) and OD600. Bars represent means from three independent replicates. Error bars show the SD. The corresponding logic gates are indicated. C) Agar photograph generated via an AraC‐S170‐LOV2 controlled RFP reporter. Top agar mixed with inducers and bacteria carrying an RFP reporter plasmid and the AraC‐S170‐LOV2 variants were plated on an ager plate, which also contained arabinose and IPTG. The plate was incubated overnight, while being illuminated through a photo‐mask of the logo on the left (without the text). D) Cultures were inoculated into media carrying 400 µm IPTG and 25 mm arabinose. The samples were incubated either in darkness or under blue‐light exposure. At the beginning of the experiment and every three hours from then, RFP fluorescence and OD600 were measured, followed by 1:30 dilution in fresh media. Points represent the mean of n = 3 biological replicates. Error bars indicate the SD. E) An AF2 prediction of the full length AraC (green) is shown alongside the crystal structure (grey and white) of the arabinose binding domain. The relative positioning of the structures was obtained by superimposing the AF2 model onto a dimer crystal structure. Insertion sites and key residues are highlighted and their function is indicated. PDB‐ID: 2ARA.
Figure 4 LOV2 domain insertion screening yields chemo‐optogenetic AND and NIMPLY gates. A) Scatterplot showing the relation between the enrichment scores of individual variants for the libraries incubated in the light and dark. B) Characterization of light‐responsive AraC variants. Inducers were supplied in the indicated concentrations. The samples were incubated under light exposure or in darkness, followed by measurements of reporter fluorescence (RFP) and OD600. Bars represent means from three independent replicates. Error bars show the SD. The corresponding logic gates are indicated. C) Agar photograph generated via an AraC‐S170‐LOV2 controlled RFP reporter. Top agar mixed with inducers and bacteria carrying an RFP reporter plasmid and the AraC‐S170‐LOV2 variants were plated on an ager plate, which also contained arabinose and IPTG. The plate was incubated overnight, while being illuminated through a photo‐mask of the logo on the left (without the text). D) Cultures were inoculated into media carrying 400 µm IPTG and 25 mm arabinose. The samples were incubated either in darkness or under blue‐light exposure. At the beginning of the experiment and every three hours from then, RFP fluorescence and OD600 were measured, followed by 1:30 dilution in fresh media. Points represent the mean of n = 3 biological replicates. Error bars indicate the SD. E) An AF2 prediction of the full length AraC (green) is shown alongside the crystal structure (grey and white) of the arabinose binding domain. The relative positioning of the structures was obtained by superimposing the AF2 model onto a dimer crystal structure. Insertion sites and key residues are highlighted and their function is indicated. PDB‐ID: 2ARA.CC BY · PubMed Central

Verification

Claims the paper makes

The claims and statistics of this paper haven’t been checked yet.

Run the check — free, no account needed. It reads the open-access text and checks the sources it cites.

A few free checks a day · papers already verified open instantly · results are public

Self-check

Percentages, sums and reported differences re-computed from the paper’s own numbers.

The self-check needs the paper’s full text.

Citations

Cites

Research works printed but not linked: 51

  1. 10.1146/annurev.biophys.31.082901.134314 · DOI
  2. 10.1126/scisignal.2000546 · DOI
  3. 10.1126/science.aah3404 · DOI
  4. 10.1016/S0896-6273(00)80955-1 · DOI
  5. 10.1126/science.1159052 · DOI
  6. 10.1093/protein/gzi048 · DOI
  7. 10.1073/pnas.0502673102 · DOI
  8. 10.1038/s41596-019-0165-3 · DOI
  9. 10.1093/nar/gkaa1198 · DOI
  10. 10.1038/s41592-018-0178-9 · DOI
  11. 10.1038/nbt.3528 · DOI
  12. 10.1038/ncomms12266 · DOI
  13. 10.1016/j.cell.2011.10.049 · DOI
  14. 10.1093/nar/gkn363 · DOI
  15. 10.1093/nar/gkz1110 · DOI
  16. 10.1038/s41467-018-08171-0 · DOI
  17. 10.1038/s41467-021-27342-0 · DOI
  18. 10.1093/nar/gkw537 · DOI
  19. 10.1126/science.273.5280.1392 · DOI
  20. 10.1073/pnas.1218319110 · DOI
  21. 10.1038/s41592-022-01488-1 · DOI · Paper page
  22. 10.1093/nar/gkm998 · DOI
  23. 10.1093/nar/28.1.374 · DOI
  24. 10.1093/bioinformatics/btg031 · DOI
  25. 10.1093/protein/15.11.871 · DOI
  26. 10.1093/bioinformatics/bti363 · DOI
  27. 10.1016/S0167-9473(01)00065-2 · DOI · Paper page
  28. G.Louppe 10.48550/arXiv.1407.7502 2015. · DOI · Paper page
  29. 10.1002/adbi.202000181 · DOI
  30. 10.1126/science.276.5311.421 · DOI
  31. 10.1111/j.1574-6976.2010.00226.x · DOI
  32. 10.1016/j.cell.2009.07.038 · DOI
  33. 10.1038/s41589-021-00787-6 · DOI
  34. 10.1016/j.jmb.2021.167107 · DOI
  35. 10.1093/nar/gkaa044 · DOI
  36. 10.1093/nar/gkw548 · DOI
  37. 10.1021/acssynbio.8b00280 · DOI
  38. 10.1371/journal.pone.0003647 · DOI
  39. 10.1073/pnas.082243699 · DOI
  40. 10.1016/j.molcel.2006.04.027 · DOI
  41. 10.1093/protein/14.12.993 · DOI
  42. 10.1002/pro.506 · DOI
  43. 10.1093/nar/gky010 · DOI
  44. 10.1002/pro.3235 · DOI · Paper page
  45. 10.1002/pro.3943 · DOI
  46. 10.1093/nar/25.17.3389 · DOI · Paper page
  47. 10.1016/S0022-2836(05)80360-2 · DOI · Paper page
  48. 10.1093/nar/gkh340 · DOI · Paper page
  49. Bairoch A., 1997, J Mol Med (Berl), 75, 312
  50. 10.1371/journal.pcbi.1004091 · DOI
  51. Pedregosa F., 2011, J Mach Learn Res, 12, 2825

Metadata

Authors
Mathony, J., Aschenbrenner, S., Becker, P., & Niopek, D.
Affiliations
  • Heidelberg University (DE)
  • Technische Universität Darmstadt (DE)
Corresponding author
  • Mathony, Jan
  • Niopek, Dominik
Venue
Advanced Science
Publisher
Wiley
Published
2023-08-10
Volume
10
Issue
28
Pages
e2303496-e2303496
ISSN
2198-3844 (ISSN-L)
OpenAlex
W4385728485
Cited by
16
References
2
Citations by year
2026: 4 · 2025: 6 · 2024: 4 · 2023: 2
FWCI
1.42
Type
journal article
Language
en
Open access
Locations
  • Advanced Science (publishedVersion, cc-by)
  • PubMed Central (publishedVersion, cc-by)
  • PubMed (publishedVersion)
  • DOAJ (DOAJ: Directory of Open Access Journals) (submittedVersion, cc-by-sa)
Funders
  • H2020 European Research Council (101041570)
  • Deutsche Forschungsgemeinschaft (453202693)
Topics
  • Life Sciences › Biochemistry, Genetics and Molecular Biology › Molecular Biology › Biochemical and Structural Characterization
  • Life Sciences › Biochemistry, Genetics and Molecular Biology › Molecular Biology › Protein Structure and Dynamics
  • Life Sciences › Biochemistry, Genetics and Molecular Biology › Molecular Biology › Gene Regulatory Network Analysis
Keywords
protein allostery, allosteric effectors, sequence conservation, optogenetics, chemogenetics, Boolean logic gates, machine learning prediction
MeSH terms
Allosteric Regulation, Transcription Factors

About these checks

Registry, retraction, Cites and statistics results are computed, not judged, with one exception: a printed reference that no index lists is read once by a model before it counts as a citation error. Claims are extracted by a model and kept only when their quote appears verbatim in the text; each cited source is then checked, with a model’s help, for whether it says what the claim relies on. Those verdicts can be wrong — read the claim’s quote and the cited source before relying on one.

Statistics and arithmetic are recomputed, not judged.

Confidence bands are shown only for fields calibrated on our annotated test set. None is calibrated yet, so no band is shown.

What counts as a claim ›How we measure confidence ›How we check this ›

Are you an author, or do you see a problem with this page? Request a review