

The DOI matches its Crossref record; 31 of the 33 references it cites were found in a registry or an index.
Expression of CD226 is upregulated on Tr1 cells from neuromyelitis optica spectrum disorder patients
Open accessAbstract
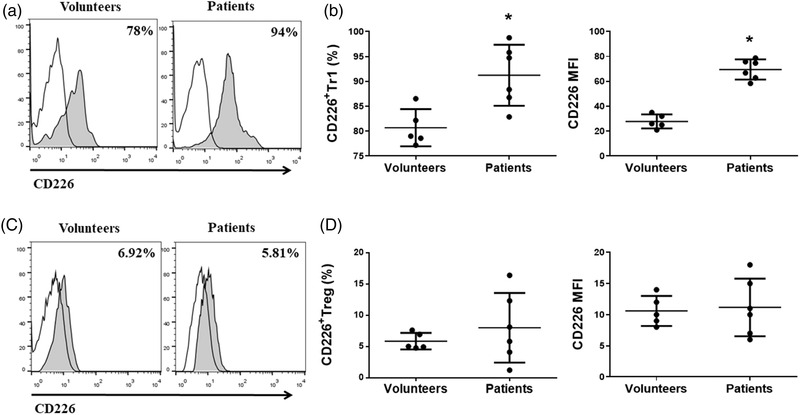
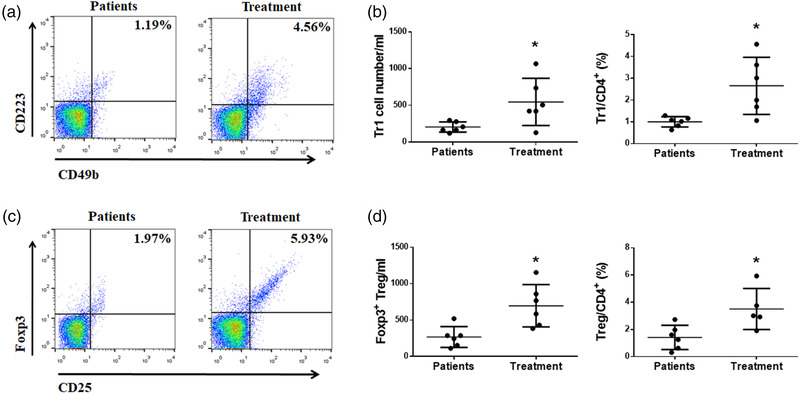
Background: Neuromyelitis optica spectrum disorder (NMOSD) is a central and acute demyelinating disease of the central nervous system with unusual clinical course. The development of novel biomarkers for NMOSD is critical for implementing effective clinical treatment. CD226 is known to be expressed on many types of peripheral lymphoid cells. However, the expression level and function of CD226 on type 1 T regulatory (Tr1) cells during NMOSD is unknown. Methods: Eighteen patients with NMOSD and 10 healthy volunteers were enrolled in the test group to probe the difference of CD226 expression on Tr1 cells using flow cytometric analysis. Results: The expression of CD226 on Tr1 cells exhibited significantly increased tendency in NMOSD patients. Additionally, methylprednisolone and rituximab treatment decreased the expression of CD226 on Tr1 cells. Furthermore, the expression of CD226 on Tr1 cells was correlated with disease severity. Conclusion: This study provides a new basic insight into CD226 expression pattern on Tr1 cells, which have great potential to be biomarkers for monitoring the development and treatment of NMOSD.
Overview
The claims and statistics of this paper haven’t been checked yet.
Run the check — free, no account needed. It reads the open-access text and checks the sources it cites.
Integrity signals
Registry
Cites
Statistics
Figures
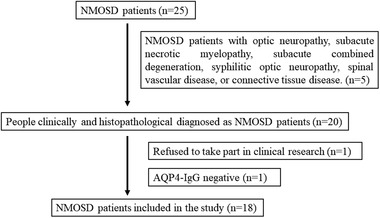
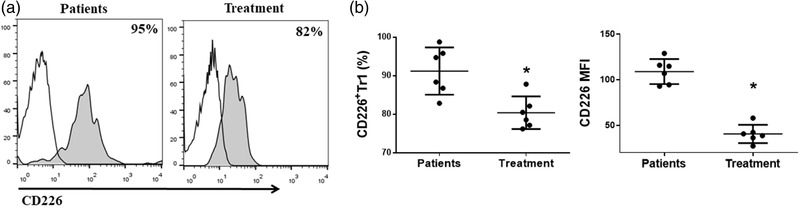
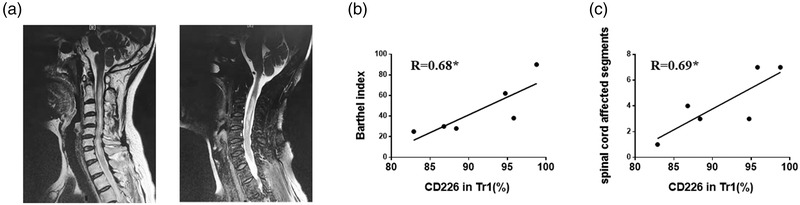
Verification
Claims the paper makes
The claims and statistics of this paper haven’t been checked yet.
Run the check — free, no account needed. It reads the open-access text and checks the sources it cites.
Claims other papers make about this one
Each is checked against this paper’s own text: does it say what the citing paper says it does?
The check wasn’t confident either way, so it gives no verdict — never disputed.
In the citing paper
“indicating that they are not derived from an unstable thymic Treg precursor, as described in various AIDs 71,72 including NMOSD. 73-76”
From Autoantigen-specific CD4+ T cells acquire an exhausted phenotype and persist in human antigen-specific autoimmune diseases (2024) · cites this paper as [75]
Experimental — accuracy not yet measured
Self-check
Percentages, sums and reported differences re-computed from the paper’s own numbers.
The self-check needs the paper’s full text.
Citations
Cites
Regulatory T cells: mechanisms of differentiation and function
Josefowicz, S. Z., Lu, L.-F., & Rudensky, A. Y. (2012) · Annual Review of Immunology · doi:10.1146/annurev.immunol.25.022106.141623 · Cited by 2,866 · cited 1×
“…highly immune-suppressive subsets of CD4+ T cells, and they exert important suppressive and homeostasis effects on cancer, autoimmune disorders, and inflammatory responses (Jia et al., 2019; Josefowicz et al., 2012; Kleinewietfeld & Hafler, 2014; Roncarolo et al., 2014, 2018; Zeng et al., 2015).”
BackgroundFOXP3+ regulatory T cells in the human immune system
Sakaguchi, S., Miyara, M., Costantino, C. M., & Hafler, D. A. (2010) · Nature reviews. Immunology · doi:10.1038/nri2785 · Cited by 2,525 · cited 1×
“Regulatory T cells are mainly Foxp3+ Treg cells and Foxp3– Tr1 cells (Sakaguchi et al., 2010; Zeng et al., 2015).”
BackgroundResearch Highlights and Editors’ Picks
Herbert, Bulfone, Trentini, Serio, D., Bacchetta, C., Andreani, Brockmann, Gregori, & Flavell (2013) · doi:10.1097/01.tp.0000431075.93885.89 · Cited by 526 · cited 1×
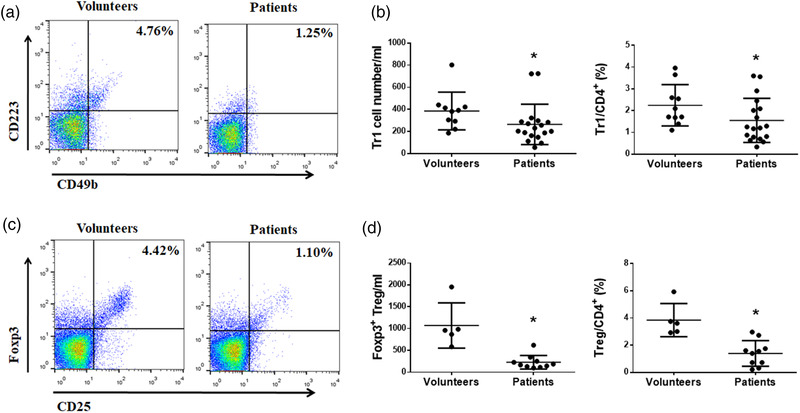
“NMOSD patients had lower number of Tr1 cells (CD4+CD49b+CD223+) (Gagliani et al., 2013), and Tr1 cells/CD4+ T cells ratio was also reduced (Figure 2a,b).”
BackgroundEitel, J., Kamer, A., & Cohen-Gadol, A. (2015) · Definitions · doi:10.18821/1560-9545-2014-19-5-43-51 · Cited by 398 · cited 1×
“Brain and Behavior published byWiley Periodicals LLC. typic continuumof primarily immune-mediated astrocyte injury, rather than a primary demyelinating disease, with preferential involvement of the optic nerves, brainstem, and the spinal cord (de Seze et al., 2016; Franciotta et al., 2017).”
BackgroundRoncarolo, M. G., Gregori, S., Bacchetta, R., Battaglia, M., & Gagliani, N. (2018) · Immunity · doi:10.1016/j.immuni.2018.12.001 · Cited by 366 · cited 1×
“…highly immune-suppressive subsets of CD4+ T cells, and they exert important suppressive and homeostasis effects on cancer, autoimmune disorders, and inflammatory responses (Jia et al., 2019; Josefowicz et al., 2012; Kleinewietfeld & Hafler, 2014; Roncarolo et al., 2014, 2018; Zeng et al., 2015).”
BackgroundDivergent Phenotypes of Human Regulatory T Cells Expressing the Receptors TIGIT and CD226
Fuhrman, C. A., Yeh, W.-I., Seay, H. R., Lakshmi, P. S., Chopra, G., Zhang, L., Perry, D. J., McClymont, S., Yadav, M., Lopez, M.-C., et al. (2015) · The Journal of Immunology · doi:10.4049/jimmunol.1402381 · Cited by 268 · cited 2×
“It has recently become appreciated that CD226 might be involved in functions of regulatory T cells (Fourcade et al., 2018; Fuhrman et al., 2015; Mu et al., 2020; Wang et al., 2019).”
BackgroundRegulatory T cells in autoimmune neuroinflammation
Kleinewietfeld, M., & Hafler, D. A. (2014) · Immunological Reviews · doi:10.1111/imr.12169 · Cited by 238 · cited 2×
“…highly immune-suppressive subsets of CD4+ T cells, and they exert important suppressive and homeostasis effects on cancer, autoimmune disorders, and inflammatory responses (Jia et al., 2019; Josefowicz et al., 2012; Kleinewietfeld & Hafler, 2014; Roncarolo et al., 2014, 2018; Zeng et al., 2015).”
BackgroundTr1 Cells and the Counter-Regulation of Immunity: Natural Mechanisms and Therapeutic Applications
Roncarolo, M. G., Gregori, S., Bacchetta, R., & Battaglia, M. (2014) · Current topics in microbiology and immunology · doi:10.1007/978-3-662-43492-5_3 · Cited by 234
Type 1 regulatory T cells: a new mechanism of peripheral immune tolerance
Zeng, H., Zhang, R., Jin, B., & Chen, L. (2015) · Cellular and Molecular Immunology · doi:10.1038/cmi.2015.44 · Cited by 211 · cited 2×
“Regulatory T cells are mainly Foxp3+ Treg cells and Foxp3– Tr1 cells (Sakaguchi et al., 2010; Zeng et al., 2015).”
BackgroundSelf-citationFunctions and regulation of T cell-derived interleukin-10
Neumann, C., Scheffold, A., & Rutz, S. (2019) · Seminars in Immunology · doi:10.1016/j.smim.2019.101344 · Cited by 211 · cited 4×
“Considering previous findings reporting the number of Tr1 cells was decreased, and the activity of Tr1 cells for secreting IL-10 was also impaired in MS patients, MS monkeys, and mouse EAE model by multiple mechanisms (Astier & Hafler, 2007; Ma et al., 2009; Martinez-Forero et al., 2008), we found both Tr1 and Treg ce…”
BackgroundInfluentialCD226 opposes TIGIT to disrupt Tregs in melanoma
Fourcade, J. J., Sun, Z., Chauvin, J.-M., Ka, M. B., Davar, D., Pagliano, O., Wang, H., Saada, S., Menna, C., Amin, R., et al. (2018) · JCI Insight · doi:10.1172/jci.insight.121157 · Cited by 200
Neuromyelitis optica spectrum disorders: still evolving and broadening
Fujihara, K. (2019) · Current Opinion in Neurology · doi:10.1097/wco.0000000000000694 · Cited by 170 · cited 1×
“There was no controversy over AQP4-antibody-seropositive NMOSD, but alternative diagnoses were required with AQP4-antibodyseronegative (Fujihara, 2019; Jurynczyk et al., 2017).”
BackgroundBrain lesion distribution criteria distinguish MS from AQP4-antibody NMOSD and MOG-antibody disease
Juryńczyk, M., Tackley, G., Kong, Y., Geraldes, R., Matthews, L., Woodhall, M. R., Waters, P. J., Küker, W., Craner, M. J., Weir, A., et al. (2016) · Journal of Neurology Neurosurgery & Psychiatry · doi:10.1136/jnnp-2016-314005 · Cited by 158
Dardalhon, V., Schubart, A., Reddy, J., Meyers, J. H., Monney, L., Sabatos, C. A., Ahuja, R., Nguyen, K., Freeman, G. J., Greenfield, E. A., et al. (2005) · The Journal of Immunology · doi:10.4049/jimmunol.175.3.1558 · Cited by 158 · cited 1×
“CD226, an important costimulatory molecule for T cells, is widely involved in the regulation of immune cells, such as the differentiation and effector function of initial T cells and the polarization and effector functions of Th1 cells (Dardalhon et al., 2005; Sherrington et al., 1997).”
BackgroundIL‐10 suppressor activity and ex vivo Tr1 cell function are impaired in multiple sclerosis
Martínez‐Forero, I., García‐Muñoz, R., Martinez‐Pasamar, S., Inogés, S., de Cerio, A. L.-D., Palacios, R., Sepulcre, J., Moreno, B., Gonzalez, Z., Fernández-Díez, B., et al. (2008) · European Journal of Immunology · doi:10.1002/eji.200737271 · Cited by 141 · cited 1×
“…Tr1 cells was decreased, and the activity of Tr1 cells for secreting IL-10 was also impaired in MS patients, MS monkeys, and mouse EAE model by multiple mechanisms (Astier & Hafler, 2007; Ma et al., 2009; Martinez-Forero et al., 2008), we found both Tr1 and Treg cells decreased in NMOSD patients.”
BackgroundAQP4 Antibody Assay Sensitivity Comparison in the Era of the 2015 Diagnostic Criteria for NMOSD
Prain, K. M., Woodhall, M. R., Vincent, A. C., Ramanathan, S., Barnett, M. H., Bundell, C. S., Parratt, J. D. E., Silvestrini, R. A., Bukhari, W., Brilot, F., et al. (2019) · Frontiers in Neurology · doi:10.3389/fneur.2019.01028 · Cited by 95
Abnormal Tr1 differentiation in multiple sclerosis
Astier, A., & Hafler, D. A. (2007) · Journal of Neuroimmunology · doi:10.1016/j.jneuroim.2007.09.018 · Cited by 81 · cited 1×
“…Tr1 cells was decreased, and the activity of Tr1 cells for secreting IL-10 was also impaired in MS patients, MS monkeys, and mouse EAE model by multiple mechanisms (Astier & Hafler, 2007; Ma et al., 2009; Martinez-Forero et al., 2008), we found both Tr1 and Treg cells decreased in NMOSD patients.”
BackgroundMa, A., Xiong, Z., Hu, Y., Qi, S., Song, L., Dun, H., Zhang, L., Lou, D., Yang, P., Zhao, Z., et al. (2009) · International Immunopharmacology · doi:10.1016/j.intimp.2009.01.034 · Cited by 49 · cited 1×
“…Tr1 cells was decreased, and the activity of Tr1 cells for secreting IL-10 was also impaired in MS patients, MS monkeys, and mouse EAE model by multiple mechanisms (Astier & Hafler, 2007; Ma et al., 2009; Martinez-Forero et al., 2008), we found both Tr1 and Treg cells decreased in NMOSD patients.”
BackgroundNeuromyelitis optica spectrum disorder (NMOSD): A new concept
Seze, J. D., Kremer, L. D., & Collongues, N. (2016) · Revue Neurologique · doi:10.1016/j.neurol.2016.03.003 · Cited by 46 · cited 1×
“Brain and Behavior published byWiley Periodicals LLC. typic continuumof primarily immune-mediated astrocyte injury, rather than a primary demyelinating disease, with preferential involvement of the optic nerves, brainstem, and the spinal cord (de Seze et al., 2016; Franciotta et al., 2017).”
BackgroundCD226 deletion improves post-infarction healing via modulating macrophage polarization in mice
Li, J., Song, Y. J., Jin, J., Li, G., Guo, Y., Yi, H., Zhang, J., Lu, Y., Zhang, J., Li, C.-Y., et al. (2020) · Theranostics · doi:10.7150/thno.37106 · Cited by 45 · cited 1×
“CD226 is an immunoglobulin-like molecule expressed in hematopoietic cells such as T cells, NK cells, a subset of B cells, mono- cytes/macrophages, and platelets in human (Castriconi et al., 2004; Li et al., 2020; Nagayama-Hasegawa et al., 2019; Sherrington et al., 1997; Vo et al., 2016).”
BackgroundSelf-citationSherrington, P., Scott, J. L., Jin, B., Simmons, D., Dorahy, D., Lloyd, J., Brien, J. H., Aebersold, R., Adamson, J., Zuzel, M., et al. (1997) · Journal of Biological Chemistry · doi:10.1074/jbc.272.35.21735 · Cited by 42 · cited 2×
“CD226 is an immunoglobulin-like molecule expressed in hematopoietic cells such as T cells, NK cells, a subset of B cells, mono- cytes/macrophages, and platelets in human (Castriconi et al., 2004; Li et al., 2020; Nagayama-Hasegawa et al., 2019; Sherrington et al., 1997; Vo et al., 2016).”
BackgroundSelf-citationExpression of DNAM-1 (CD226) on inflammatory monocytes.
Vo, A. V., Takenaka, E., Shibuya, A., & Shibuya, K. (2016) · Molecular Immunology · doi:10.1016/j.molimm.2015.11.009 · Cited by 37 · cited 1×
“CD226 is an immunoglobulin-like molecule expressed in hematopoietic cells such as T cells, NK cells, a subset of B cells, mono- cytes/macrophages, and platelets in human (Castriconi et al., 2004; Li et al., 2020; Nagayama-Hasegawa et al., 2019; Sherrington et al., 1997; Vo et al., 2016).”
BackgroundCD226 attenuates Treg suppressive capacity via CTLA-4 and TIGIT during EAE
Wang, N., Liang, S., Jin, J., Fang, L., Ma, Q., Wang, X., Song, Y. J., & Chen, L. (2019) · Immunologic Research · doi:10.1007/s12026-019-09112-9 · Cited by 32 · cited 6×
“It has recently become appreciated that CD226 might be involved in functions of regulatory T cells (Fourcade et al., 2018; Fuhrman et al., 2015; Mu et al., 2020; Wang et al., 2019).”
BackgroundInfluentialSelf-citationZhang, R., Zeng, H., Zhang, Y., Chen, K., Zhang, C., Song, C., Fang, L., Xu, Z., Yang, K., Jin, B., et al. (2016) · Oncotarget · doi:10.18632/oncotarget.7834 · Cited by 28 · cited 2×
“Our laboratory has previously shown that CD226 polyclonal antibody treatment of EAE mice has reduced symptoms and susceptibility by promoted IL-10 production (Zhang et al., 2016).”
BackgroundMethodSelf-citationDecreased number and impaired function of type 1 regulatory T cells in autoimmune diseases
Jia, X., Zhai, T., Wang, B., Yao, Q., Li, Q., Mu, K.-D., & Zhang, J.-A. (2019) · Journal of Cellular Physiology · doi:10.1002/jcp.28092 · Cited by 21 · cited 2×
“…highly immune-suppressive subsets of CD4+ T cells, and they exert important suppressive and homeostasis effects on cancer, autoimmune disorders, and inflammatory responses (Jia et al., 2019; Josefowicz et al., 2012; Kleinewietfeld & Hafler, 2014; Roncarolo et al., 2014, 2018; Zeng et al., 2015).”
BackgroundMu, Y., Zhang, J., Liu, Y., Ma, J.-C., Jiang, D., Zhang, X., Yi, X., Cheng, K., Shen, S., Yang, Y.-X., et al. (2019) · Journal of Leukocyte Biology · doi:10.1002/jlb.2ma1119-174rr · Cited by 20
Diagnostics of the neuromyelitis optica spectrum disorders (NMOSD)
Franciotta, D. M., Gastaldi, M., Sala, A., Andreetta, F., Rinaldi, E., Ruggieri, M., Leante, R., Costa, G., Biagioli, T., Massacesi, L., et al. (2017) · Neurological Sciences · doi:10.1007/s10072-017-3027-1 · Cited by 17
Unbalanced Expression of ICOS and PD-1 in Patients with Neuromyelitis Optica Spectrum Disorder
Xue, Q., Li, X.-P., Gu, Y.-Z., Wang, X.-Z., Wang, M.-Y., Tian, J.-L., Duan, X.-Y., Gao, H.-Q., Ji, X.-P., Yan, X.-M., et al. (2019) · Scientific Reports · doi:10.1038/s41598-019-50479-4 · Cited by 13
Expression and function of DNAM‐1 on human B‐lineage cells
Nagayama‐Hasegawa, Y., Honda, S., Shibuya, A., & Shibuya, K. (2019) · Cytometry Part B Clinical Cytometry · doi:10.1002/cyto.b.21859 · Cited by 12
Brun, A., Julier, I., Sirvain, S., & Fraisse, T. (2012) · La Revue de medecine interne · doi:10.1016/j.revmed.2011.10.009 · Cited by 4
AQP4 in biopsied demyelinating lesions as a diagnostic clue to NMOSD and MS
Fujihara, K., & Misu, T. (2015) · Neurology · doi:10.1212/wnl.0000000000001135 · Cited by 3
Cited by
Sorted by citations
Saggau, C., Bacher, P., Esser, D., Rasa, M., Meise, S., Mohr, N., Kohlstedt, N., Hutloff, A., Schacht, S.-S., Dargvainiene, J., et al. (2024) · Immunity · doi:10.1016/j.immuni.2024.08.005 · Cited by 79
The Immune Regulatory Functions of CD226 and Its Implications in Immune-Mediated Diseases
Liu, K.-G., Liu, Y.-Z., Xiong, H.-B., & Ning, Z. (2025) · Biomolecules · doi:10.3390/biom15071007 · Cited by 8
“In neuromyelitis optica, CD226 overexpression on T regulatory type 1 cells correlates with disease severity, suggesting its role as a progression biomarker [106].”
Chang, K.-J., Wu, H.-Y., Yarmishyn, A. A., Li, C.-Y., Hsiao, Y., Chi, Y., Lo, T.-C., Dai, H.-J., Yang, Y., Liu, D.-H., et al. (2022) · International Journal of Molecular Sciences · doi:10.3390/ijms23179707 · Cited by 9
Wadodkar, M., Huda, S., & Rocchi, C. (2026) · Immunology and Cell Biology · doi:10.1111/imcb.70171
Kari, S., Debonlier, A., Angles, T., Chaves, B., Grosjean, C., Bucciarelli, F., Duplan-Eche, V., Nozeran, L., Lavery, J., Morandi, E., et al. (2026) · Journal of Clinical Investigation · doi:10.1172/jci202193
“We recently reported increased levels of sCD226 in the serum of patients with MS and NMOSD (54).”
Metadata
- Authors
- Chen, P., Wu, M., Wang, N., Xia, F., Du, F., Liu, Z., Wang, J., Jin, J., Jin, B., Zhao, G., Chen, L., Yi, J., & Fang, L.
- Affiliations
- Yan'an University (CN)
- Department of Neurobiology the Fourth Military Medical University Xi'an China
- Air Force Medical University (CN)
- Xijing Hospital (CN)
- Corresponding author
- Yi, Jing
- Fang, Liang
- ORCID
- Venue
- Brain and Behavior
- Publisher
- Wiley
- Published
- 2022-05-19
- Volume
- 12
- Issue
- 6
- Pages
- e2623-e2623
- ISSN
- 2157-9032 (ISSN-L)
- 2162-3279
- PMC
- PMC9226801
- OpenAlex
- W4280590492
- Cited by
- 6
- References
- 33
- Citations by year
- 2026: 1 · 2025: 1 · 2024: 2 · 2022: 2
- FWCI
- 0.85
- Type
- journal article
- Language
- en
- Open access
- gold
- doi.org
- Licence
- Locations
- Brain and Behavior (publishedVersion, cc-by)
- PubMed Central (publishedVersion, cc-by)
- PubMed (publishedVersion)
- DOAJ (DOAJ: Directory of Open Access Journals) (submittedVersion, cc-by-sa)
- Funders
- National Natural Science Foundation of China (82071848, 81872315)
- Topics
- Health Sciences › Medicine › Clinical Neurology › Multiple Sclerosis Research Studies
- Life Sciences › Immunology and Microbiology › Immunology › T-cell and B-cell Immunology
- Health Sciences › Medicine › Clinical Neurology › Peripheral Neuropathies and Disorders
- Keywords
- neuromyelitis optica spectrum disorder, CD226, biomarkers, demyelinating disease, methylprednisolone, rituximab, disease severity
- MeSH terms
- Humans, Neuromyelitis Optica, Severity of Illness Index, Biomarkers, Treatment Outcome, T-Lymphocytes, Regulatory
About these checks
Registry, retraction, Cites and statistics results are computed, not judged, with one exception: a printed reference that no index lists is read once by a model before it counts as a citation error. Claims are extracted by a model and kept only when their quote appears verbatim in the text; each cited source is then checked, with a model’s help, for whether it says what the claim relies on. Those verdicts can be wrong — read the claim’s quote and the cited source before relying on one.
Statistics and arithmetic are recomputed, not judged.
Confidence bands are shown only for fields calibrated on our annotated test set. None is calibrated yet, so no band is shown.
What counts as a claim ›How we measure confidence ›How we check this ›
Are you an author, or do you see a problem with this page? Request a review
