

The DOI matches its Crossref record; 46 of the 46 references it cites were found in a registry or an index.
An Eco‐Friendly, Tunable and Scalable Method for Producing Porous Functional Nanomaterials Designed Using Molecular Interactions
Abstract
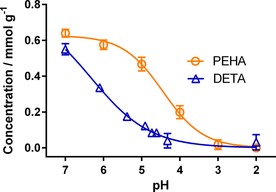
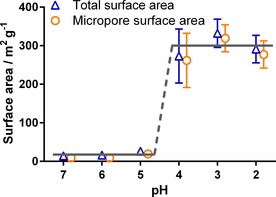
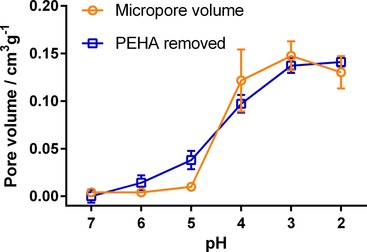
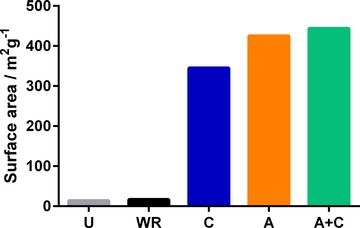
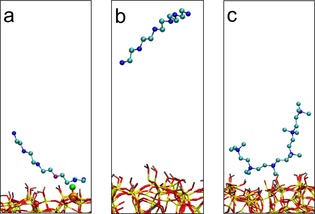
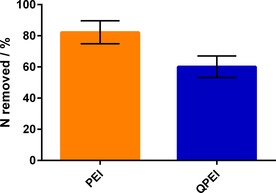
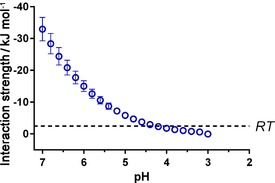
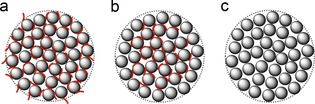
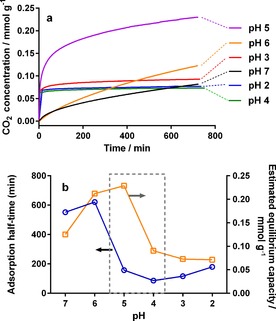
Despite significant improvements in the synthesis of templated silica materials, post‐synthesis purification remains highly expensive and renders the materials industrially unviable. In this study this issue is addressed for porous bioinspired silica by developing a rapid room‐temperature solution method for complete extraction of organic additives. Using elemental analysis and N 2 and CO 2 adsorption, the ability to both purify and controllably tailor the composition, porosity and surface chemistry of bioinspired silica in a single step is demonstrated. For the first time the extraction is modelled using molecular dynamics, revealing that the removal mechanism is dominated by surface‐charge interactions. This is extended to other additive chemistry, leading to a wider applicability of the method to other materials. Finally the environmental benefits of the new method are estimated and compared with previous purification techniques, demonstrating significant improvements in sustainability.
Overview
The claims and statistics of this paper haven’t been checked yet.
Run the check — free, no account needed. It reads the open-access text and checks the sources it cites.
Integrity signals
Registry
Cites
Statistics
Figures
Verification
Claims the paper makes
The claims and statistics of this paper haven’t been checked yet.
Run the check — free, no account needed. It reads the open-access text and checks the sources it cites.
Claims other papers make about this one
Each is checked against this paper’s own text: does it say what the citing paper says it does?
The source backs part of the claim, not all of it — or backs it for a different population, condition or comparison.
In the citing paper
“Silicon based materials have been studied extensively for pollutants adsorption as well 51, 52 . Their interesting properties such as ability for a wide range of pore size and surface areas, durability, ease of functionalisation and relatively cheaper regeneration compared to activated carbon, have made them excellent candidates for water treatment with many examples on dye adsorption 53-56 .”
From Degradation of anthraquinone dyes from effluents: A review focusing on enzymatic dye degradation with industrial potential (2020) · cites this paper as [57]
Experimental — accuracy not yet measured
Self-check
Percentages, sums and reported differences re-computed from the paper’s own numbers.
The self-check needs the paper’s full text.
Citations
Cites
Adsorption of Gases in Multimolecular Layers
Brunauer, S., Emmett, P. H., & Teller, E. (1938) · Journal of the American Chemical Society · doi:10.1021/ja01269a023 · Cited by 28,156
GROMACS 4: Algorithms for Highly Efficient, Load-Balanced, and Scalable Molecular Simulation
Hess, B., Kutzner, C., van der Spoel, D., & Lindahl, E. (2008) · Journal of Chemical Theory and Computation · doi:10.1021/ct700301q · Cited by 15,908
Jorgensen, W. L., Maxwell, D. S., & Tirado-Rives, J. (1996) · Journal of the American Chemical Society · doi:10.1021/ja9621760 · Cited by 15,409
The missing term in effective pair potentials
Berendsen, H. J. C., Grigera, J. R., & Straatsma, T. P. (1987) · The Journal of Physical Chemistry · doi:10.1021/j100308a038 · Cited by 13,345
Barrett, E. P., Joyner, L. G., & Halenda, P. P. (1951) · Journal of the American Chemical Society · doi:10.1021/ja01145a126 · Cited by 13,172
Ordered porous materials for emerging applications
Davis, M. E. (2002) · Nature · doi:10.1038/nature00785 · Cited by 5,308
Plueddemann, E. P. (1982) · Springer eBooks · doi:10.1007/978-1-4899-0342-6 · Cited by 2,719
Adsorbent Materials for Carbon Dioxide Capture from Large Anthropogenic Point Sources
Choi, S., Drese, J. H., & Jones, C. W. (2009) · ChemSusChem · doi:10.1002/cssc.200900036 · Cited by 2,647
Iler, R. K. (1979) · Medical Entomology and Zoology · Cited by 2,396
Post-Combustion CO 2 Capture Using Solid Sorbents: A Review
Samanta, A., Zhao, A., Shimizu, G. K. H., Sarkar, P., & Gupta, R. (2012) · Industrial & Engineering Chemistry Research · doi:10.1021/ie200686q · Cited by 1,889
Research works printed but not linked: 1
- 10.1007/978-1-4899-2070-6 · DOI
Cited by
Routoula, E., & Patwardhan, S. V. (2020) · Environmental Science & Technology · doi:10.1021/acs.est.9b03737 · Cited by 579
Self-citation
Metadata
- Authors
- Manning, J. R. H., Yip, T. W. S., Centi, A., Jorge, M., & Patwardhan, S. V.
- Venue
- ChemSusChem
- Publisher
- Wiley
- Published
- 2017-03-29
- Volume
- 10
- Issue
- 8
- Pages
- 1683-1691
- ISSN
- 1864-5631
- 1864-564X
- PMC
- PMC5434938
- Cited by
- 29
- References
- 46
- Language
- en
- Funders
- Engineering and Physical Sciences Research Council (EP/L014297/1, EP/L017059/1, EP/J019704/2, EP/K031260/1, EP/K000586/1)
About these checks
Registry, retraction, Cites and statistics results are computed, not judged, with one exception: a printed reference that no index lists is read once by a model before it counts as a citation error. Claims are extracted by a model and kept only when their quote appears verbatim in the text; each cited source is then checked, with a model’s help, for whether it says what the claim relies on. Those verdicts can be wrong — read the claim’s quote and the cited source before relying on one.
Statistics and arithmetic are recomputed, not judged.
Confidence bands are shown only for fields calibrated on our annotated test set. None is calibrated yet, so no band is shown.
What counts as a claim ›How we measure confidence ›How we check this ›
Are you an author, or do you see a problem with this page? Request a review
Data sources
Bibliographic data: Semantic Scholar, OpenAlex, Crossref.
Contains information from the Semantic Scholar Academic Graph Datasets, made available under the ODC Attribution License (ODC-BY 1.0).
Semantic Scholar’s data is described in: Kinney, R., et al. (2023). The Semantic Scholar Open Data Platform. arXiv:2301.10140.
