Cited by 2Hereditary Neurological DisordersPeripheral Neuropathies and DisordersCancer Treatment and Pharmacology

The DOI matches its Crossref record; 2 of the 2 references it cites were found in a registry or an index.

Aberrant Molecular Myelin Architecture in Charcot–Marie–Tooth Disease Type 1A and Hereditary Neuropathy With Liability to Pressure Palsies

Open access

Published version of a preprint

Abstract

Charcot–Marie–Tooth Disease Type 1A (CMT1A) and Hereditary Neuropathy with Liability to Pressure Palsies (HNPP) are the most common inherited peripheral neuropathies and arise from copy number variation of the Peripheral Myelin Protein 22 ( PMP22 ) gene. While secondary axon degeneration has been proposed as the primary driver of disability, our prior work demonstrated pronounced neuromuscular impairment in CMT1A model mice in the absence of overt axonal loss, prompting investigation into primary myelin dysfunction. Here, we reveal that altered PMP22 dosage profoundly disrupts molecular architecture at critical myelin domains, Schmidt‐Lanterman incisures (SLIs) and Nodes of Ranvier. Using high‐resolution confocal imaging of teased peripheral nerve fibers from CMT1A and HNPP model mice, we identified widespread disorganization of adherens junctions, mislocalization of Connexin29 and aberrant distribution of nodal ion channels, with several defects more severe in CMT1A, consistent with disease burden. Notably, nodal widening and abnormal spreading of Kv1.2 and Caspr along internodes indicate compromised axo‐glial compartmentalization essential for saltatory conduction. Together, these findings support a model in which PMP22 functions as a structural organizer of myelin, coordinating adherens junction patterning and nodal subdomain integrity. Dysregulation of this function is predicted to compromise Schwann‐cell architecture, metabolic support and axonal excitability. Our findings support a paradigm shift in which molecular destabilization of myelin, rather than secondary axonal degeneration alone, contributes to disease progression in CMT1A and HNPP. This work also identifies junctional complexes as potential actionable molecular targets and establishes a mechanistic framework applicable to a broad spectrum of inherited dysmyelinating and acquired demyelinating neuropathies.

Overview

The claims and statistics of this paper haven’t been checked yet.

Run the check — free, no account needed. It reads the open-access text and checks the sources it cites.

A few free checks a day · papers already verified open instantly · results are public

Integrity signals

Registry

Crossref · 10.1002/glia.70124

Cites

2 of 2 references verified0 citation errors · 0 not checkable

Statistics

Figures

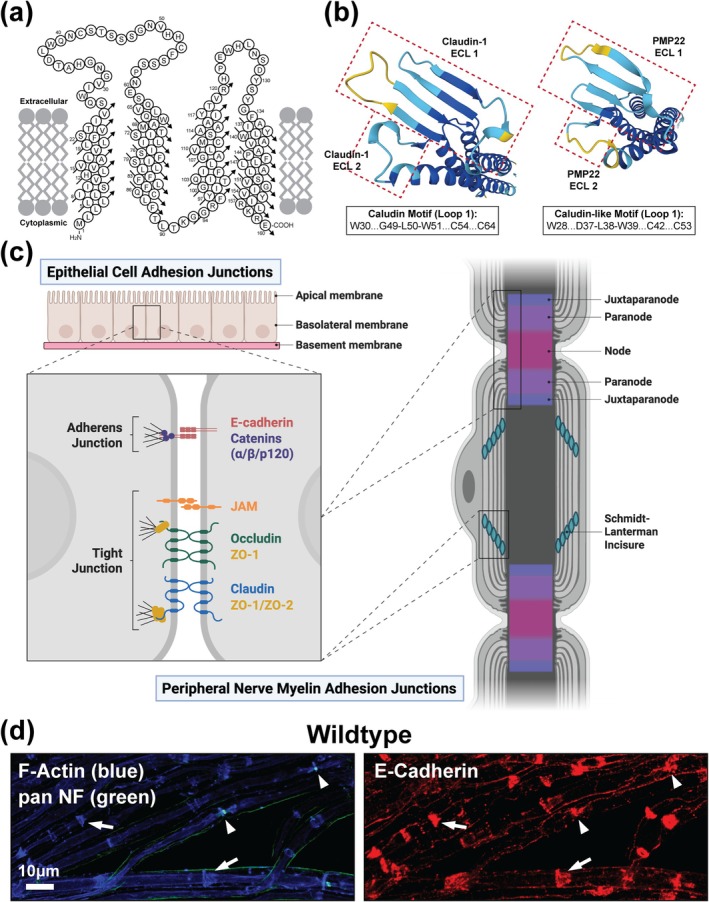
FIGURE 1 PMP22 exhibits structural homology to Claudins suggesting a role in myelin adhesion. (a) PMP22 is a member of the Claudin superfamily of proteins. Orthodox Claudins establish selective barriers as components of tight junctions and as such PMP22 protein topology is homologous. Topology for human PMP22, adapted from (Marinko et al. 2020). (b) AlphaFold predicted structures of human Claudin‐1 and human PMP22 ECLs viewed from above (AlphaFold Protein Structure Database (Jumper et al. 2021)). The structural similarity between the ECLs of human Claudin‐1 and human PMP22 is striking suggesting that PMP22 functions similarly to Claudin proteins. (c) Adhesion junctions, including adherens junctions and tight junctions, are localized to specialized cytoplasmic‐like compartments in peripheral nerve myelin including Schmidt‐Lanterman Incisures (SLIs) and Nodes of Ranvier. Created in https://BioRender.com. (d) 3‐month‐old WT (C57BL/6J) teased tibial nerve fibers immunostained for the adherens junction protein E‐Cadherin (red) showing prominent localization at SLIs (marked by F‐Actin [blue], arrows), Nodes of Ranvier (marked by pan Neurofascin [NF, green], arrowheads) and inner mesaxons. Scale bar, 10 μm.
FIGURE 1 PMP22 exhibits structural homology to Claudins suggesting a role in myelin adhesion. (a) PMP22 is a member of the Claudin superfamily of proteins. Orthodox Claudins establish selective barriers as components of tight junctions and as such PMP22 protein topology is homologous. Topology for human PMP22, adapted from (Marinko et al. 2020). (b) AlphaFold predicted structures of human Claudin‐1 and human PMP22 ECLs viewed from above (AlphaFold Protein Structure Database (Jumper et al. 2021)). The structural similarity between the ECLs of human Claudin‐1 and human PMP22 is striking suggesting that PMP22 functions similarly to Claudin proteins. (c) Adhesion junctions, including adherens junctions and tight junctions, are localized to specialized cytoplasmic‐like compartments in peripheral nerve myelin including Schmidt‐Lanterman Incisures (SLIs) and Nodes of Ranvier. Created in https://BioRender.com. (d) 3‐month‐old WT (C57BL/6J) teased tibial nerve fibers immunostained for the adherens junction protein E‐Cadherin (red) showing prominent localization at SLIs (marked by F‐Actin [blue], arrows), Nodes of Ranvier (marked by pan Neurofascin [NF, green], arrowheads) and inner mesaxons. Scale bar, 10 μm.CC BY · PubMed Central
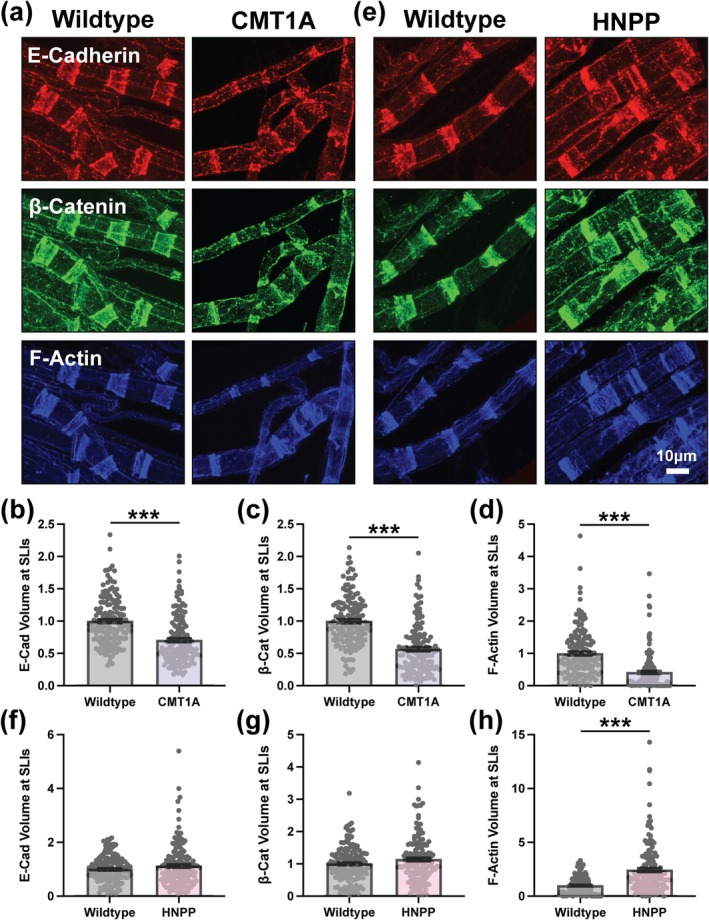
FIGURE 2 Altered adherens junctions and F‐actin distributions at SLIs in CMT1A and HNPP model peripheral nerve myelin. Representative images of 3‐month‐old (a) WT (C57BL/6J) and CMT1A or (e) WT (129S1/SvImJ) and HNPP teased tibial nerve fibers stained for the adherens junction complex proteins E‐Cadherin (red), β‐Catenin (green) and F‐Actin (blue). Quantification of protein distribution at SLIs (signal volume/fiber diameter) for (b, f) E‐Cadherin, (c, g) β‐Catenin and (d, h) F‐Actin in CMT1A and HNPP, respectively. n = 5 animals (~30 SLIs/animal). Bar graphs represent mean ± SEM with individual data points. Datasets were analyzed with three complementary statistical approaches (unpaired t‐test with all individual data points, unpaired t‐test with experimental means and nested t‐test). ***p < 0.05 demonstrate statistical significance with all three t‐test statistics. Scale bar, 10 μm.
FIGURE 2 Altered adherens junctions and F‐actin distributions at SLIs in CMT1A and HNPP model peripheral nerve myelin. Representative images of 3‐month‐old (a) WT (C57BL/6J) and CMT1A or (e) WT (129S1/SvImJ) and HNPP teased tibial nerve fibers stained for the adherens junction complex proteins E‐Cadherin (red), β‐Catenin (green) and F‐Actin (blue). Quantification of protein distribution at SLIs (signal volume/fiber diameter) for (b, f) E‐Cadherin, (c, g) β‐Catenin and (d, h) F‐Actin in CMT1A and HNPP, respectively. n = 5 animals (~30 SLIs/animal). Bar graphs represent mean ± SEM with individual data points. Datasets were analyzed with three complementary statistical approaches (unpaired t‐test with all individual data points, unpaired t‐test with experimental means and nested t‐test). ***p < 0.05 demonstrate statistical significance with all three t‐test statistics. Scale bar, 10 μm.CC BY · PubMed Central
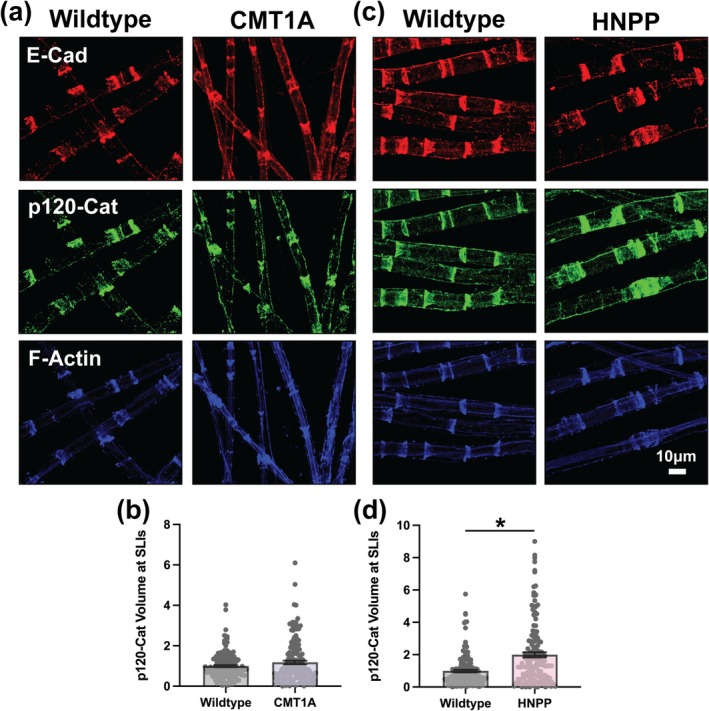
FIGURE 3 Variable changes in the distribution of p120‐Catenin at SLIs in CMT1A and HNPP model myelin. Representative images of 3‐month‐old (a) WT (C57BL/6J) and CMT1A or (c) WT (129S1/SvImJ) and HNPP teased tibial nerve fibers stained for the adherens junction complex proteins E‐Cadherin (red), p120‐Catenin (green) and F‐Actin (blue). Quantification of p120‐Catenin protein distribution at SLIs (signal volume/fiber diameter) in (b) CMT1A and (d) HNPP. n = 5 animals (~30 SLIs/animal). Bar graphs represent mean ± SEM with individual data points. Datasets were analyzed with three complementary statistical approaches (unpaired t‐test with all individual data points, unpaired t‐test with experimental means and nested t‐test). *p < 0.05 demonstrate statistical significance with a single t‐test statistic. Scale bar, 10 μm.
FIGURE 3 Variable changes in the distribution of p120‐Catenin at SLIs in CMT1A and HNPP model myelin. Representative images of 3‐month‐old (a) WT (C57BL/6J) and CMT1A or (c) WT (129S1/SvImJ) and HNPP teased tibial nerve fibers stained for the adherens junction complex proteins E‐Cadherin (red), p120‐Catenin (green) and F‐Actin (blue). Quantification of p120‐Catenin protein distribution at SLIs (signal volume/fiber diameter) in (b) CMT1A and (d) HNPP. n = 5 animals (~30 SLIs/animal). Bar graphs represent mean ± SEM with individual data points. Datasets were analyzed with three complementary statistical approaches (unpaired t‐test with all individual data points, unpaired t‐test with experimental means and nested t‐test). *p < 0.05 demonstrate statistical significance with a single t‐test statistic. Scale bar, 10 μm.CC BY · PubMed Central
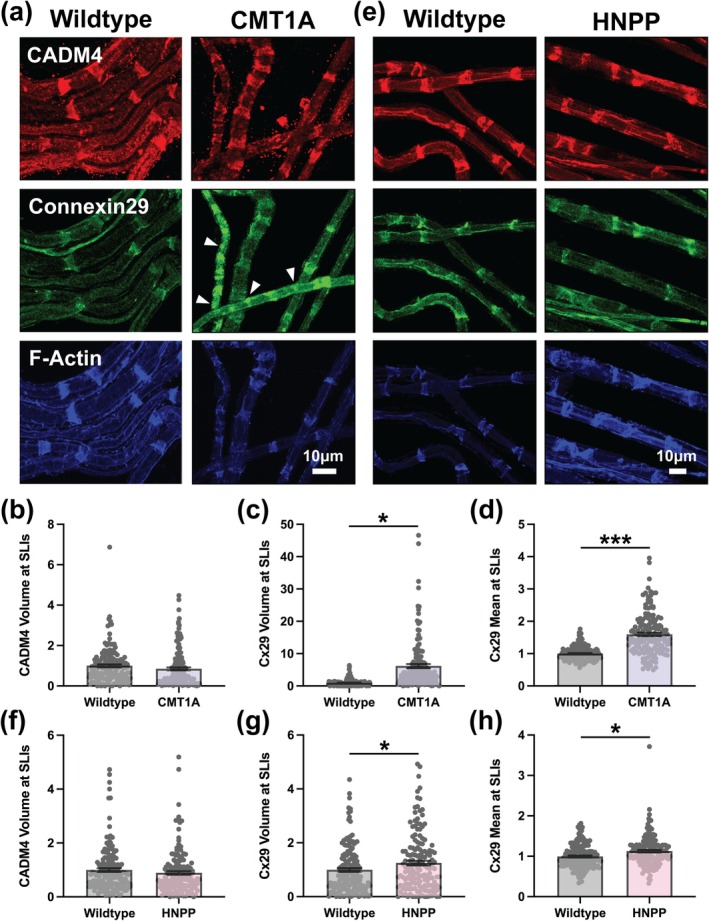
FIGURE 4 Distinct Connexin29 distribution defects but unchanged CADM4 at SLIs in peripheral nerve myelin from CMT1A and HNPP model mice. Representative images of 3‐month‐old (a) WT (C57BL/6J) and CMT1A or (e) WT (129S1/SvImJ) and HNPP teased tibial nerve fibers stained for CADM4 (red), Connexin29 (Cx29, green) and F‐Actin (blue). Note the focal accumulations of Cx29 outside the SLI compartment in CMT1A model myelin (arrowheads). Quantification of protein distribution at SLIs (signal volume/fiber diameter) for (b, f) CADM4 and (c, g) Cx29 in CMT1A and HNPP, respectively. Quantification of mean Cx29 signal intensity at SLIs in (d) CMT1A and (h) HNPP. n = 5 animals (~30 SLIs/animal). Bar graphs represent mean ± SEM with individual data points. Datasets were analyzed with three complementary statistical approaches (unpaired t‐test with all individual data points, unpaired t‐test with experimental means and nested t‐test). ***p < 0.05 demonstrate statistical significance with all three t‐test statistics and *p < 0.05 demonstrate statistical significance with a single t‐test statistic. Scale bars, 10 μm.
FIGURE 4 Distinct Connexin29 distribution defects but unchanged CADM4 at SLIs in peripheral nerve myelin from CMT1A and HNPP model mice. Representative images of 3‐month‐old (a) WT (C57BL/6J) and CMT1A or (e) WT (129S1/SvImJ) and HNPP teased tibial nerve fibers stained for CADM4 (red), Connexin29 (Cx29, green) and F‐Actin (blue). Note the focal accumulations of Cx29 outside the SLI compartment in CMT1A model myelin (arrowheads). Quantification of protein distribution at SLIs (signal volume/fiber diameter) for (b, f) CADM4 and (c, g) Cx29 in CMT1A and HNPP, respectively. Quantification of mean Cx29 signal intensity at SLIs in (d) CMT1A and (h) HNPP. n = 5 animals (~30 SLIs/animal). Bar graphs represent mean ± SEM with individual data points. Datasets were analyzed with three complementary statistical approaches (unpaired t‐test with all individual data points, unpaired t‐test with experimental means and nested t‐test). ***p < 0.05 demonstrate statistical significance with all three t‐test statistics and *p < 0.05 demonstrate statistical significance with a single t‐test statistic. Scale bars, 10 μm.CC BY · PubMed Central
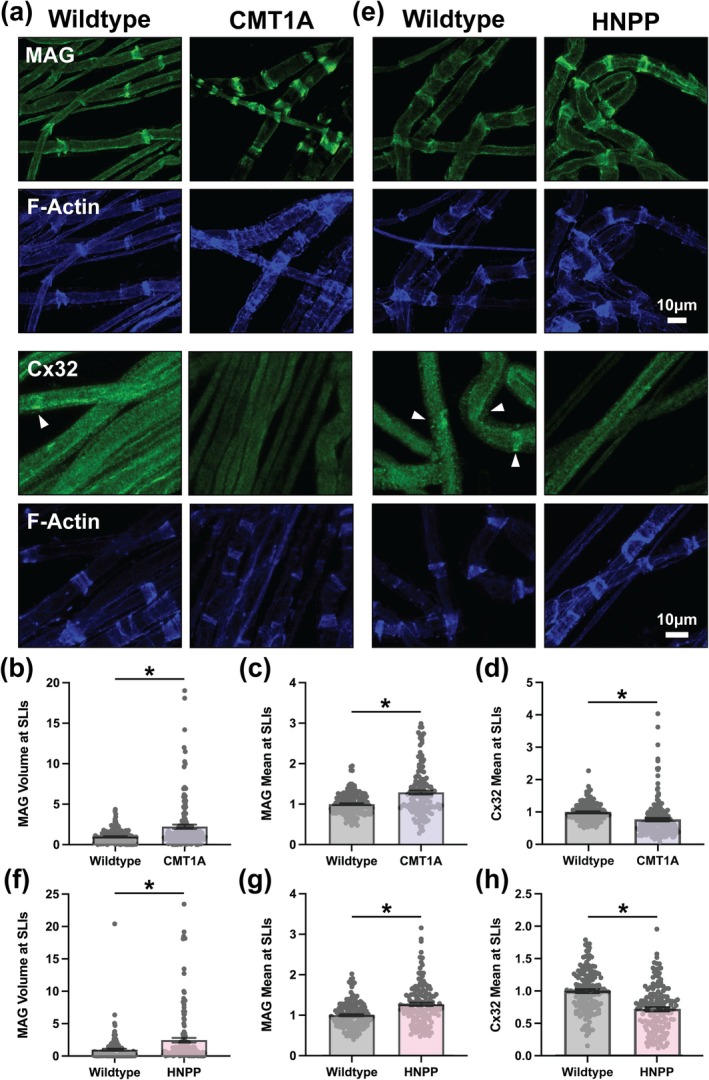
FIGURE 5 Mag exhibits distribution changes similar to Connexin29 whereas Connexin32 mean intensity is reduced at SLIs in CMT1A and HNPP model myelin. Representative images of 3‐month‐old (a) WT (C57BL/6J) and CMT1A or (e) WT (129S1/SvImJ) and HNPP teased tibial nerve fibers stained for (top panels) MAG (green) and F‐Actin (blue) or (bottom panels) Cx32 (green) and F‐Actin (blue). Quantification of (b, f) MAG protein distribution (signal volume/fiber diameter) and (c, f) MAG and (d, h) Cx32 mean signal intensity at SLIs in CMT1A and HNPP, respectively. n = 5 animals (~30 SLIs/animal). Bar graphs represent mean ± SEM with individual data points. Datasets were analyzed with three complementary statistical approaches (unpaired t‐test with all individual data points, unpaired t‐test with experimental means and nested t‐test). *p < 0.05 demonstrate statistical significance with a single t‐test statistic. Scale bars, 10 μm.
FIGURE 5 Mag exhibits distribution changes similar to Connexin29 whereas Connexin32 mean intensity is reduced at SLIs in CMT1A and HNPP model myelin. Representative images of 3‐month‐old (a) WT (C57BL/6J) and CMT1A or (e) WT (129S1/SvImJ) and HNPP teased tibial nerve fibers stained for (top panels) MAG (green) and F‐Actin (blue) or (bottom panels) Cx32 (green) and F‐Actin (blue). Quantification of (b, f) MAG protein distribution (signal volume/fiber diameter) and (c, f) MAG and (d, h) Cx32 mean signal intensity at SLIs in CMT1A and HNPP, respectively. n = 5 animals (~30 SLIs/animal). Bar graphs represent mean ± SEM with individual data points. Datasets were analyzed with three complementary statistical approaches (unpaired t‐test with all individual data points, unpaired t‐test with experimental means and nested t‐test). *p < 0.05 demonstrate statistical significance with a single t‐test statistic. Scale bars, 10 μm.CC BY · PubMed Central
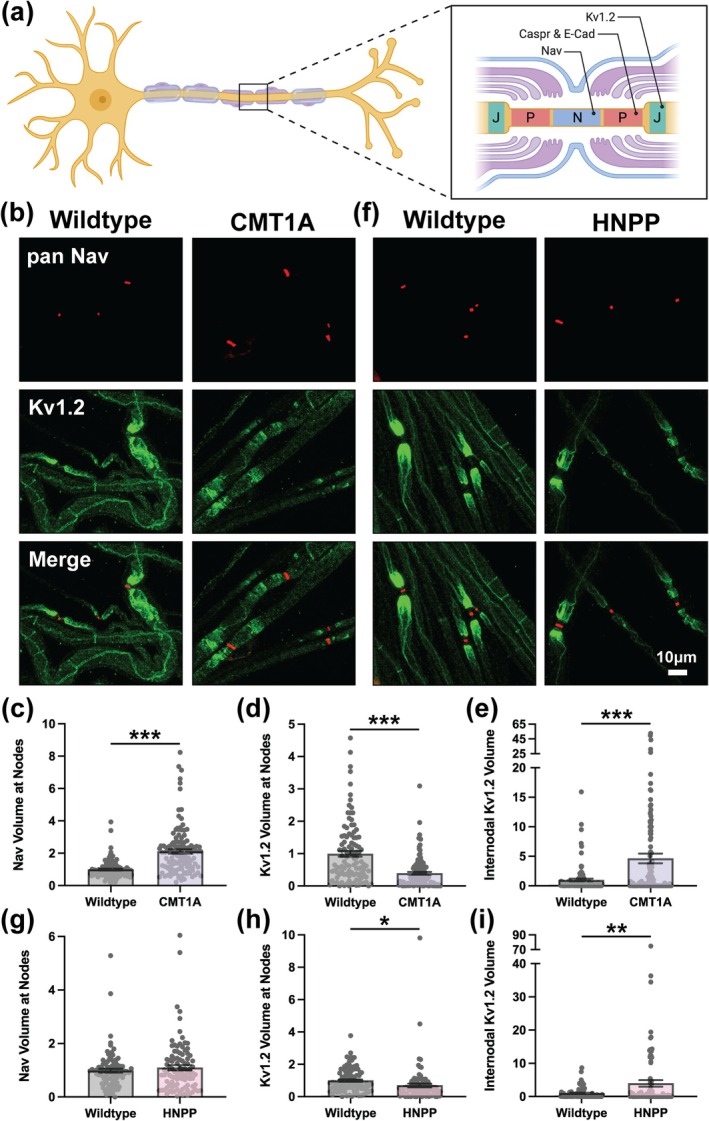
FIGURE 6 Disrupted ion channel distribution at nodes of Ranvier in CMT1A and HNPP model peripheral nerve myelin. (a) Diagram demonstrating the molecular organization of three distinct subdomains at Nodes of Ranvier: Nodes (N, containing Nav), paranodes (P, containing Caspr and E‐Cadherin) and Juxtaparanodes (J, containing Kv1.2). Created in https://BioRender.com. Representative images of 3‐month‐old (b) WT (C57BL/6J) and CMT1A or (f) WT (129S1/SvImJ) and HNPP teased tibial nerve fibers stained with anti‐Pan Nav (red) and anti‐Kv1.2 (green). Quantification of protein distribution at Nodes of Ranvier (signal volume/fiber diameter) for (c, g) Nav and (d, h) Kv1.2 in CMT1A and HNPP, respectively. (e, i) Quantification Kv1.2 internodal spread away from Nodes of Ranvier in CMT1A and HNPP, respectively. n = 5 animals (~15–25 nodes/animal). Bar graphs represent mean ± SEM with individual data points. Datasets were analyzed with three complementary statistical approaches (unpaired t‐test with all individual data points, unpaired t‐test with experimental means and nested t‐test). ***p < 0.05 demonstrate statistical significance with all three t‐test statistics, **p < 0.05 demonstrate statistical significance with two t‐test statistics and *p < 0.05 demonstrate statistical significance with a single t‐test statistic. Scale bar, 10 μm.
FIGURE 6 Disrupted ion channel distribution at nodes of Ranvier in CMT1A and HNPP model peripheral nerve myelin. (a) Diagram demonstrating the molecular organization of three distinct subdomains at Nodes of Ranvier: Nodes (N, containing Nav), paranodes (P, containing Caspr and E‐Cadherin) and Juxtaparanodes (J, containing Kv1.2). Created in https://BioRender.com. Representative images of 3‐month‐old (b) WT (C57BL/6J) and CMT1A or (f) WT (129S1/SvImJ) and HNPP teased tibial nerve fibers stained with anti‐Pan Nav (red) and anti‐Kv1.2 (green). Quantification of protein distribution at Nodes of Ranvier (signal volume/fiber diameter) for (c, g) Nav and (d, h) Kv1.2 in CMT1A and HNPP, respectively. (e, i) Quantification Kv1.2 internodal spread away from Nodes of Ranvier in CMT1A and HNPP, respectively. n = 5 animals (~15–25 nodes/animal). Bar graphs represent mean ± SEM with individual data points. Datasets were analyzed with three complementary statistical approaches (unpaired t‐test with all individual data points, unpaired t‐test with experimental means and nested t‐test). ***p < 0.05 demonstrate statistical significance with all three t‐test statistics, **p < 0.05 demonstrate statistical significance with two t‐test statistics and *p < 0.05 demonstrate statistical significance with a single t‐test statistic. Scale bar, 10 μm.CC BY · PubMed Central
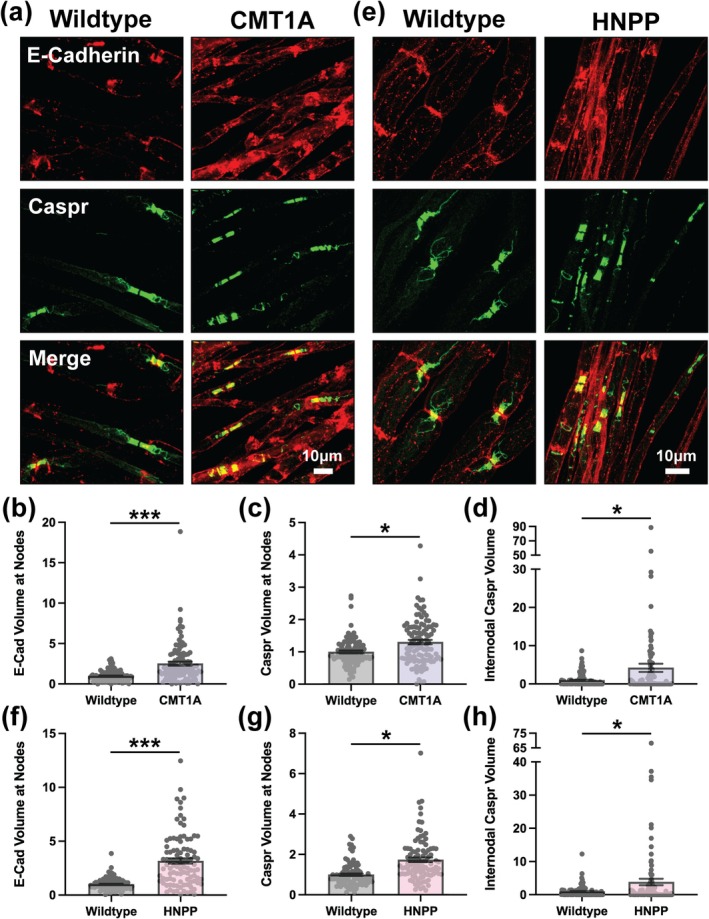
FIGURE 7 Altered Caspr and E‐Cadherin distributions at paranodes CMT1A and HNPP model myelin. Representative images of 3‐month‐old (a) WT (C57BL/6J) and CMT1A or (e) WT (129S1/SvImJ) and HNPP teased tibial nerve fibers stained for E‐Cadherin (red) and Caspr (green). Quantification of protein distribution at Nodes of Ranvier (signal volume/fiber diameter) for (b, f) E‐Cadherin and (c, g) Caspr in CMT1A and HNPP, respectively. (d, h) Quantification of Caspr internodal spread away from Nodes of Ranvier in CMT1A and HNPP, respectively. n = 5 animals (~15–25 nodes/animal). Bar graphs represent mean ± SEM with individual data points. Datasets were analyzed with three complementary statistical approaches (unpaired t‐test with all individual data points, unpaired t‐test with experimental means and nested t‐test). ***p < 0.05 demonstrate statistical significance with all three t‐test statistics and *p < 0.05 demonstrate statistical significance with a single t‐test statistic. Scale bars, 10 μm.
FIGURE 7 Altered Caspr and E‐Cadherin distributions at paranodes CMT1A and HNPP model myelin. Representative images of 3‐month‐old (a) WT (C57BL/6J) and CMT1A or (e) WT (129S1/SvImJ) and HNPP teased tibial nerve fibers stained for E‐Cadherin (red) and Caspr (green). Quantification of protein distribution at Nodes of Ranvier (signal volume/fiber diameter) for (b, f) E‐Cadherin and (c, g) Caspr in CMT1A and HNPP, respectively. (d, h) Quantification of Caspr internodal spread away from Nodes of Ranvier in CMT1A and HNPP, respectively. n = 5 animals (~15–25 nodes/animal). Bar graphs represent mean ± SEM with individual data points. Datasets were analyzed with three complementary statistical approaches (unpaired t‐test with all individual data points, unpaired t‐test with experimental means and nested t‐test). ***p < 0.05 demonstrate statistical significance with all three t‐test statistics and *p < 0.05 demonstrate statistical significance with a single t‐test statistic. Scale bars, 10 μm.CC BY · PubMed Central
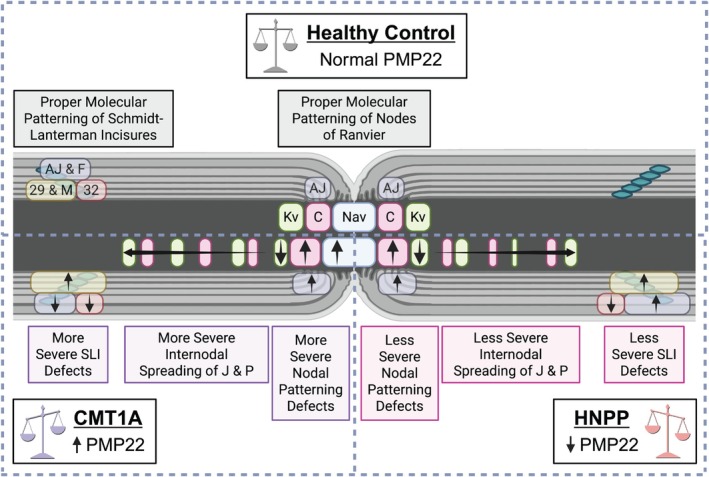
FIGURE 8 Overview of molecular alterations in relation to mouse model disease severity. Because CMT1A is typically a more severe disease than HNPP, with earlier onset and greater functional impairment, molecular and cellular phenotypes that are more pronounced in CMT1A, or that display opposing trends between the two models in accordance with PMP22 gene dosage, are likely to align with disease burden and represent key contributors to pathogenesis. Several of the observations that we report here fit this trend. In SLIs, E‐Cadherin, β‐Catenin, and F‐Actin demonstrate reduced distributions in CMT1A but are increased or unchanged in HNPP, whereas Connexin29 exhibits dramatically increased distribution in CMT1A and less so in HNPP. At Nodes of Ranvier, Kv1.2 distribution is reduced at juxtaparanodes and is spread internodally in CMT1A more so than in HNPP; Nav demonstrates nodal widening (increased distribution) in CMT1A but is unchanged in HNPP, and Caspr demonstrates potentially more internodal spread in CMT1A than in HNPP. These results suggest that changes at Nodes of Ranvier, such as nodal widening and disrupted domain‐specific molecular patterning, along with accompanying abnormalities at SLIs, likely impair proper functionality of these key myelin domains, with more severe impairments in CMT1A than HNPP. These architectural alterations are predicted to compromise metabolic support and alter axonal excitability despite grossly intact compact myelin. Created in https://BioRender.com.
FIGURE 8 Overview of molecular alterations in relation to mouse model disease severity. Because CMT1A is typically a more severe disease than HNPP, with earlier onset and greater functional impairment, molecular and cellular phenotypes that are more pronounced in CMT1A, or that display opposing trends between the two models in accordance with PMP22 gene dosage, are likely to align with disease burden and represent key contributors to pathogenesis. Several of the observations that we report here fit this trend. In SLIs, E‐Cadherin, β‐Catenin, and F‐Actin demonstrate reduced distributions in CMT1A but are increased or unchanged in HNPP, whereas Connexin29 exhibits dramatically increased distribution in CMT1A and less so in HNPP. At Nodes of Ranvier, Kv1.2 distribution is reduced at juxtaparanodes and is spread internodally in CMT1A more so than in HNPP; Nav demonstrates nodal widening (increased distribution) in CMT1A but is unchanged in HNPP, and Caspr demonstrates potentially more internodal spread in CMT1A than in HNPP. These results suggest that changes at Nodes of Ranvier, such as nodal widening and disrupted domain‐specific molecular patterning, along with accompanying abnormalities at SLIs, likely impair proper functionality of these key myelin domains, with more severe impairments in CMT1A than HNPP. These architectural alterations are predicted to compromise metabolic support and alter axonal excitability despite grossly intact compact myelin. Created in https://BioRender.com.CC BY · PubMed Central

Verification

Claims the paper makes

The claims and statistics of this paper haven’t been checked yet.

Run the check — free, no account needed. It reads the open-access text and checks the sources it cites.

A few free checks a day · papers already verified open instantly · results are public

Self-check

Percentages, sums and reported differences re-computed from the paper’s own numbers.

The self-check needs the paper’s full text.

Citations

Cites

Research works printed but not linked: 68

  1. 10.1523/JNEUROSCI.17-12-04662.1997 · DOI
  2. 10.1038/ng1195-274 · DOI
  3. 10.1523/JNEUROSCI.22-15-06458.2002 · DOI
  4. 10.1523/JNEUROSCI.17-12-04545.1997 · DOI
  5. 10.1023/A:1007009613484 · DOI
  6. 10.1007/s00415-019-09319-8 · DOI
  7. 10.1007/s12035-022-02838-y · DOI
  8. 10.1083/jcb.142.4.1095 · DOI
  9. 10.1186/s12990-015-0065-7 · DOI
  10. 10.1007/s00726-025-03479-w · DOI
  11. 10.1126/science.8266101 · DOI
  12. 10.1002/ana.10089 · DOI
  13. 10.1177/0192623319850773 · DOI
  14. 10.1073/pnas.090034797 · DOI · Paper page
  15. 10.1111/ejn.16457 · DOI
  16. 10.1002/glia.20315 · DOI
  17. 10.1212/WNL.53.4.846 · DOI
  18. 10.1016/j.bbamem.2020.183211 · DOI
  19. 10.1083/jcb.129.1.189 · DOI · Paper page
  20. 10.1016/S0301-0082(99)00049-0 · DOI
  21. 10.1002/ana.24086 · DOI
  22. 10.1111/bph.15231 · DOI
  23. 10.1093/brain/awu257 · DOI · Paper page
  24. 10.1007/BF01190831 · DOI
  25. 10.1371/journal.pgen.1006290 · DOI
  26. 10.3389/fmolb.2024.1486576 · DOI
  27. 10.1016/B978-0-12-394311-8.00018-2 · DOI
  28. 10.1093/brain/123.7.1516 · DOI
  29. 10.1038/s44321-023-00019-5 · DOI
  30. 10.1177/019262330002800114 · DOI
  31. 10.1007/s12035-012-8370-x · DOI
  32. 10.1111/ene.13079 · DOI
  33. 10.1073/pnas.2000508117 · DOI
  34. 10.1136/jnnp.62.4.310 · DOI
  35. 10.1002/glia.23578 · DOI
  36. 10.1021/bi500809t · DOI
  37. 10.1016/0896-6273(94)90472-3 · DOI
  38. 10.1111/jns.12483 · DOI
  39. 10.1073/pnas.93.18.9565 · DOI
  40. 10.1002/(SICI)1097-4547(19991201)58:5<612::AID-JNR2>3.0.CO;2-X · DOI
  41. 10.1073/pnas.251548398 · DOI
  42. 10.1159/000505815 · DOI
  43. 10.1016/j.isci.2024.110989 · DOI
  44. 10.1101/cshperspect.a041361 · DOI
  45. 10.1152/jn.01077.2015 · DOI
  46. 10.1046/j.1469-7580.2002.00039.x · DOI
  47. 10.1091/mbc.e04-07-0551 · DOI
  48. 10.1002/cne.20154 · DOI · Paper page
  49. 10.1046/j.1529-8027.2002.02001.x · DOI
  50. 10.1002/(SICI)1098-1136(199809)24:1<8::AID-GLIA2>3.0.CO;2-3 · DOI
  51. 10.1002/jnr.21992 · DOI
  52. 10.4161/tisb.25502 · DOI
  53. 10.4103/1673-5374.361538 · DOI
  54. 10.1111/j.1529-8027.2012.00441.x · DOI
  55. 10.1523/JNEUROSCI.5168-04.2005 · DOI
  56. 10.1016/j.tcb.2022.08.007 · DOI
  57. 10.1136/bmjopen-2017-018048 · DOI
  58. 10.1002/ana.410390621 · DOI
  59. 10.1146/annurev.physiol.68.040104.131404 · DOI
  60. 10.3390/ijms20225655 · DOI
  61. 10.1097/NEN.0b013e318217eba0 · DOI
  62. 10.1093/brain/awaf219 · DOI
  63. 10.1016/j.jns.2015.05.037 · DOI
  64. 10.1002/mus.1159 · DOI
  65. 10.1242/bio.059634 · DOI
  66. 10.1523/JNEUROSCI.18-06-01953.1998 · DOI
  67. 10.1006/mcne.2002.1177 · DOI
  68. 10.1172/JCI96499 · DOI

Metadata

Authors
Moss, K. R., Arowolo, M. A., Gutierrez, D. R., & Höke, A.
Affiliations
  • University of Missouri Health System (US)
  • Johns Hopkins University (US)
Corresponding author
Moss, Kathryn R.
Venue
Glia
Publisher
Wiley
Published
2025-12-16
Volume
74
Issue
2
Pages
e70124-e70124
ISSN
  • 0894-1491 (ISSN-L)
  • 1098-1136
OpenAlex
W4417427233
Cited by
2
References
2
Citations by year
2026: 2
FWCI
0.78
Type
journal article
Language
en
Open access
Locations
  • Glia (publishedVersion, cc-by)
  • bioRxiv (Cold Spring Harbor Laboratory) (acceptedVersion)
  • Europe PMC (PubMed Central) (publishedVersion, cc-by)
  • PubMed (publishedVersion)
  • PubMed Central (publishedVersion, cc-by)
Funders
National Institute of Neurological Disorders and Stroke (K22NS125057)
Topics
  • Life Sciences › Neuroscience › Cellular and Molecular Neuroscience › Hereditary Neurological Disorders
  • Health Sciences › Medicine › Clinical Neurology › Peripheral Neuropathies and Disorders
  • Health Sciences › Medicine › Oncology › Cancer Treatment and Pharmacology
Keywords
Charcot-Marie-Tooth disease type 1A, hereditary neuropathy with liability to pressure palsies, Schmidt-Lanterman incisures, nodes of Ranvier, adherens junctions, Kv1.2, Caspr, saltatory conduction, Schwann cells, demyelinating neuropathy, peripheral nerve myelin
MeSH terms
Animals, Arthrogryposis, Axons, Charcot-Marie-Tooth Disease, Disease Models, Animal, Male, Mice, Inbred C57BL, Mice, Transgenic, Myelin Proteins, Myelin Sheath, Ranvier's Nodes, Hereditary Sensory and Motor Neuropathy, Connexins, Mice

About these checks

Registry, retraction, Cites and statistics results are computed, not judged, with one exception: a printed reference that no index lists is read once by a model before it counts as a citation error. Claims are extracted by a model and kept only when their quote appears verbatim in the text; each cited source is then checked, with a model’s help, for whether it says what the claim relies on. Those verdicts can be wrong — read the claim’s quote and the cited source before relying on one.

Statistics and arithmetic are recomputed, not judged.

Confidence bands are shown only for fields calibrated on our annotated test set. None is calibrated yet, so no band is shown.

What counts as a claim ›How we measure confidence ›How we check this ›

Are you an author, or do you see a problem with this page? Request a review