

The DOI matches its Crossref record; 31 of the 31 references it cites were found in a registry or an index.
Evaluation of the analytical performance of endocrine analytes using sigma metrics.
Open accessAbstract
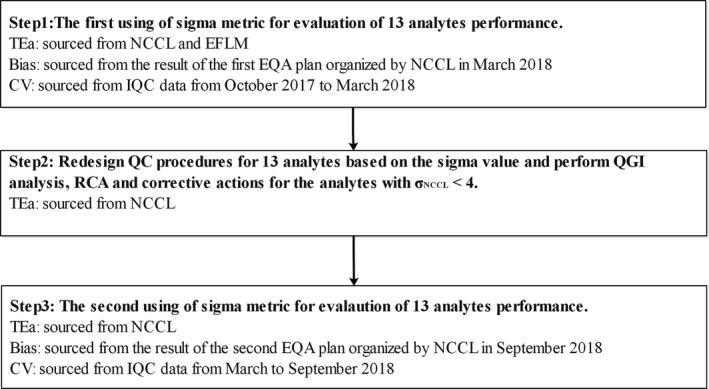
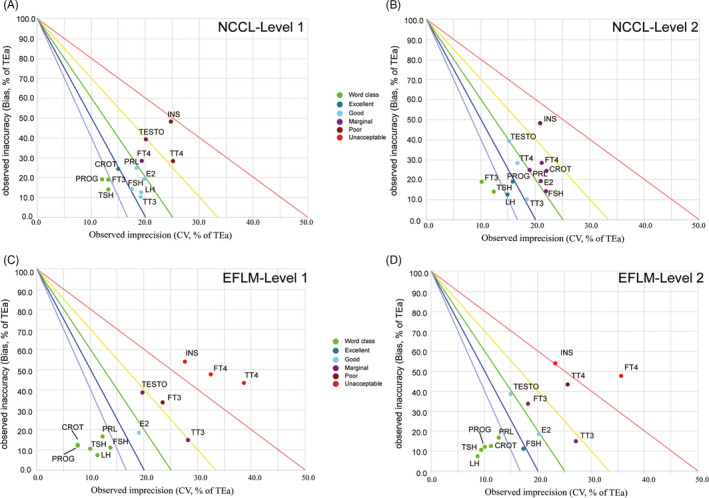
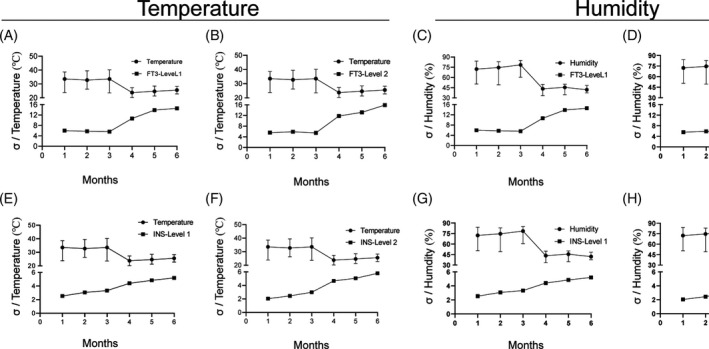
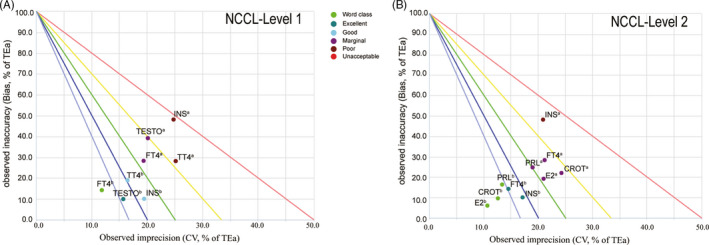
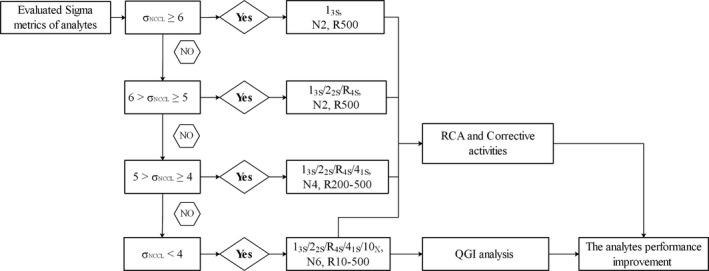
Background: (a) To evaluate the clinical performance of endocrine analytes using the sigma metrics (σ) model. (b) To redesign quality control strategies for performance improvement. Methods: The sigma values of the analytes were initially evaluated based on the allowable total error (TEa), bias, and coefficient of variation (CV) at QC materials level 1 and 2 in March 2018. And then, the normalized QC performance decision charts, personalized QC rules, quality goal index (QGI) analysis, and root causes analysis (RCA) were performed based on the sigma values of the analytes. Finally, the sigma values were re‐evaluated in September 2018 after a series of targeted corrective actions. Results: Based on the initial sigma values, two analytes (FT3 and TSH) with σ > 6, only needed one QC rule (1 3S) with N2 and R500 for QC management. On the other hand, seven analytes (FT4, TT4, CROT, E2, PRL, TESTO, and INS) with σ < 4 at one QC material level or both needed multiple rules (1 3S/2 2S/R 4S/4 1S/10 X) with N6 and R10‐500 depending on different sigma values for QC management. Subsequently, detailed and comprehensive RCA and timely corrective actions were performed on all the analytes base on the QGI analysis. Compared with the initial sigma values, the re‐evaluated sigma metrics of all the analytes increased significantly. Conclusions: It was demonstrated that the combination of sigma metrics, QGI analysis, and RCA provided a useful evaluation system for the analytical performance of endocrine analytes.
Overview
The claims and statistics of this paper haven’t been checked yet.
Run the check — free, no account needed. It reads the open-access text and checks the sources it cites.
Integrity signals
Registry
Cites
Statistics
Figures
Verification
Claims the paper makes
The claims and statistics of this paper haven’t been checked yet.
Run the check — free, no account needed. It reads the open-access text and checks the sources it cites.
Claims other papers make about this one
Each is checked against this paper’s own text: does it say what the citing paper says it does?
The cited source says what the claim attributes to it.
In the citing paper
“Our desirable TE% limit for TSH was similar to acceptance limits of international guidelines and proficiency test organizers mentioned above.”
From Biological variation of thyroid stimulating hormone, free triiodothyronine and free thyroxine in healthy subjects in Turkey (2025) · cites this paper as [22]
Self-check
Percentages, sums and reported differences re-computed from the paper’s own numbers.
The self-check needs the paper’s full text.
Citations
Cites
Sandberg, S., Fraser, C. G., Horvath, A. R., Jansen, R., Jones, G., Oosterhuis, W., Petersen, P. H., Schimmel, H., Sikaris, K., & Panteghini, M. (2015) · Clinical Chemistry and Laboratory Medicine (CCLM) · doi:10.1515/cclm-2015-0067 · Cited by 563
Multiplex Polymerase Chain Reaction Tests for Detection of Pathogens Associated with Gastroenteritis
Zhang, H., Morrison, S., & Tang, Y. (2015) · Clinics in Laboratory Medicine · doi:10.1016/j.cll.2015.02.006 · Cited by 194
Quality in the pharmaceutical industry – A literature review
Haleem, R. M., Salem, M. Y., Fatahallah, F. A., & Abdel-Fattah, L. (2013) · Saudi Pharmaceutical Journal · doi:10.1016/j.jsps.2013.11.004 · Cited by 170
Analytical Sigma metrics: A review of Six Sigma implementation tools for medical laboratories
Westgard, S. A., Bayat, H., & Westgard, J. O. (2018) · Biochemia Medica · doi:10.11613/bm.2018.020502 · Cited by 103
Panteghini, M., Ceriotti, F., Jones, G. R. D., Oosterhuis, W. P., Plebani, M., & Sandberg, S. (2017) · Clinical Chemistry and Laboratory Medicine (CCLM) · doi:10.1515/cclm-2017-0772 · Cited by 80
Zhou, B., Wu, Y., He, H., Li, C., Tan, L., & Cao, Y.-D. (2019) · Journal of Clinical Laboratory Analysis · doi:10.1002/jcla.23126 · Cited by 58
Self-citationSerum Metabolomic Patterns in Patients with Autoimmune Thyroid Disease
Liu, J., Fu, J. H., Jia, Y., Yang, N., Li, J., & Wang, G. (2019) · Endocrine Practice · doi:10.4158/ep-2019-0162 · Cited by 53
A method evaluation decision chart (MEDx chart) for judging method performance.
Westgard, J. O. (1995) · PubMed · Cited by 52
Establishing Evidence-Based Statistical Quality Control Practices
Westgard, J. O., & Westgard, S. A. (2018) · American Journal of Clinical Pathology · doi:10.1093/ajcp/aqy158 · Cited by 50
Linking Six Sigma to simulation: a new roadmap to improve the quality of patient care
Celano, G., Costa, A., Fichera, S., & Tringali, G. (2012) · International Journal of Health Care Quality Assurance · doi:10.1108/09526861211221473 · Cited by 48
Cited by
Sorted by citations
Geto, Z., Getahun, T., Lejisa, T., Tolcha, Y., Bikila, D., Bashea, C., Meles, M., Habtu, W., Ashebir, G., Negasa, B., et al. (2021) · Indian Journal of Clinical Biochemistry · doi:10.1007/s12291-021-00994-x · Cited by 18
Sigma metrics in laboratory medicine: A call for harmonization
Wauthier, L., Chiaro, L. D., & Favresse, J. (2022) · Clinica Chimica Acta · doi:10.1016/j.cca.2022.05.012 · Cited by 19
Liu, Q., Chen, X., Han, J., Chen, Y., Wang, M., Zhao, J., Liang, W., & Yang, F. (2021) · Clinical Biochemistry · doi:10.1016/j.clinbiochem.2021.02.004 · Cited by 16
Liu, Q., Bian, G., Chen, X., Han, J., Chen, Y., Wang, M., & Yang, F. (2021) · Journal of Clinical Laboratory Analysis · doi:10.1002/jcla.24059 · Cited by 13
Application of Sigma metrics in the quality control strategies of immunology and protein analytes
Luo, Y., Yan, X., Xiao, Q., Long, Y., Pu, J., Li, Q., Cai, Y., Chen, Y., Zhang, H., Cha, C., et al. (2021) · Journal of Clinical Laboratory Analysis · doi:10.1002/jcla.24041 · Cited by 13
Liu, Q., Hu, M., Yang, F., Li, Y., & Yang, F. (2023) · Clinical Biochemistry · doi:10.1016/j.clinbiochem.2023.02.005 · Cited by 10
Vyakaranam, S., Nori, S. N. S., Rehan, A. R., Pothula, Y., Yasam, L., & Agiwal, V. (2024) · Journal of Laboratory Physicians · doi:10.25259/jlp_56_2024 · Cited by 4
Özkanay, H., Arslan, F. D., Köseoğlu, M., & Yıldız, R. (2025) · Biochemia medica · doi:10.11613/bm.2025.010706 · Cited by 2
Liu, Q., Lin, Y., Yang, F., Dai, Y., Hang, H., Wang, M., Hu, M., & Yang, F. (2025) · Annals of Clinical Biochemistry International Journal of Laboratory Medicine · doi:10.1177/00045632251350503 · Cited by 2
Rogious, M., Xigang, L., & Musilanga, N. (2021) · Chinese Journal of Medical Research · doi:10.37515/cjmr.091x.4403 · Cited by 1
"Six SIGMA" standard as a level of quality of biochemical laboratories
Pašić, A., & Šeherčehajić, E. (2022) · SANAMED · doi:10.5937/sanamed0-40408 · Cited by 1
Ahmad, M. I., Ahmed, F. S., Rao, D., Begum, M., & Joan, S. (2026) · Journal of Family Medicine and Primary Care · doi:10.4103/jfmpc.jfmpc_1768_25 · Cited by 1
Sigma Metrics in Thyroid Testing: Striving for Perfection- An Observational, Cross-sectional Study
Rajib, S., Mukherjee, K., Ghosh, B., Bhattacharyya, R., & Mukhopadhyay, M. (2024) · National Journal of Laboratory Medicine · doi:10.7860/njlm/2024/66389.2839
Rangareddy, H., Nagaraj, S. K., & Kannala, P. (2024) · JOURNAL OF CLINICAL AND BIOMEDICAL SCIENCES · doi:10.58739/jcbs/v14i1.24.24
Sychik, E. V., Burtsev, D. V., Lugovskaya, G. I., & Moshev, A. V. (2024) · Laboratory Service · doi:10.17116/labs20241301139
AlMuhairi, M. A., AlHosani, M. A., Mansour, M. N., Musallam, L. A., Subramaniyam, R. K., & Meskiri, A. (2024) · Springer eBooks · doi:10.1007/978-3-031-57773-4_6
Zhao, C., & Wan, L. (2026) · Journal of Visualized Experiments · doi:10.3791/70097
Optimizing patient-risk-based internal quality control in clinical chemistry by bias determination
Xiao, G., Liu, Y., Wang, Y., Chen, S. H., Hu, J., & Zhang, S. (2026) · Accreditation and Quality Assurance · doi:10.1007/s00769-026-01720-x
Self-citation
Metadata
- Authors
- Liu, Y., Cao, Y., Liu, X., Wu, L., & Cai, W.
- Affiliations
- Department of Laboratory Medicine YueBei People’s Hospital Shaoguan China
- Shaoguan University (CN)
- Yue Bei People's Hospital (CN)
- Venue
- Journal of Clinical Laboratory Analysis
- Publisher
- Wiley
- Published
- 2020-09-20
- Volume
- 35
- Issue
- 1
- Pages
- e23581-e23581
- ISSN
- 0887-8013 (ISSN-L)
- 1098-2825
- PMC
- PMC7843286
- OpenAlex
- W3087185205
- Cited by
- 18
- References
- 31
- Citations by year
- 2026: 3 · 2025: 2 · 2024: 5 · 2023: 1 · 2022: 2 · 2021: 5
- FWCI
- 1.20
- Type
- journal article
- Language
- en
- Open access
- gold
- doi.org
- Licence
- Locations
- Journal of Clinical Laboratory Analysis (publishedVersion, cc-by)
- PubMed Central (publishedVersion, cc-by)
- PubMed (publishedVersion)
- Topics
- Health Sciences › Health Professions › Medical Laboratory Technology › Clinical Laboratory Practices and Quality Control
- Health Sciences › Medicine › Public Health, Environmental and Occupational Health › Healthcare Quality and Management
- Physical Sciences › Physics and Astronomy › Instrumentation › Scientific Measurement and Uncertainty Evaluation
- Keywords
- sigma metrics, total allowable error, quality control rules, quality goal index, root cause analysis, corrective actions, analytical performance evaluation, thyroid function tests, sex hormones, prolactin
- MeSH terms
- Adult, Diagnostic Techniques, Endocrine, Female, Humans, Male, Metabolic Diseases, Quality Control, Biomarkers, Total Quality Management, Clinical Chemistry Tests, Young Adult
About these checks
Registry, retraction, Cites and statistics results are computed, not judged, with one exception: a printed reference that no index lists is read once by a model before it counts as a citation error. Claims are extracted by a model and kept only when their quote appears verbatim in the text; each cited source is then checked, with a model’s help, for whether it says what the claim relies on. Those verdicts can be wrong — read the claim’s quote and the cited source before relying on one.
Statistics and arithmetic are recomputed, not judged.
Confidence bands are shown only for fields calibrated on our annotated test set. None is calibrated yet, so no band is shown.
What counts as a claim ›How we measure confidence ›How we check this ›
Are you an author, or do you see a problem with this page? Request a review
