

The DOI matches its Crossref record; 3 of the 3 references it cites were found in a registry or an index.
Trends in Oyster Populations in the Northeastern Gulf of Mexico: An Assessment of River Discharge and Fishing Effects over Time and Space
Abstract
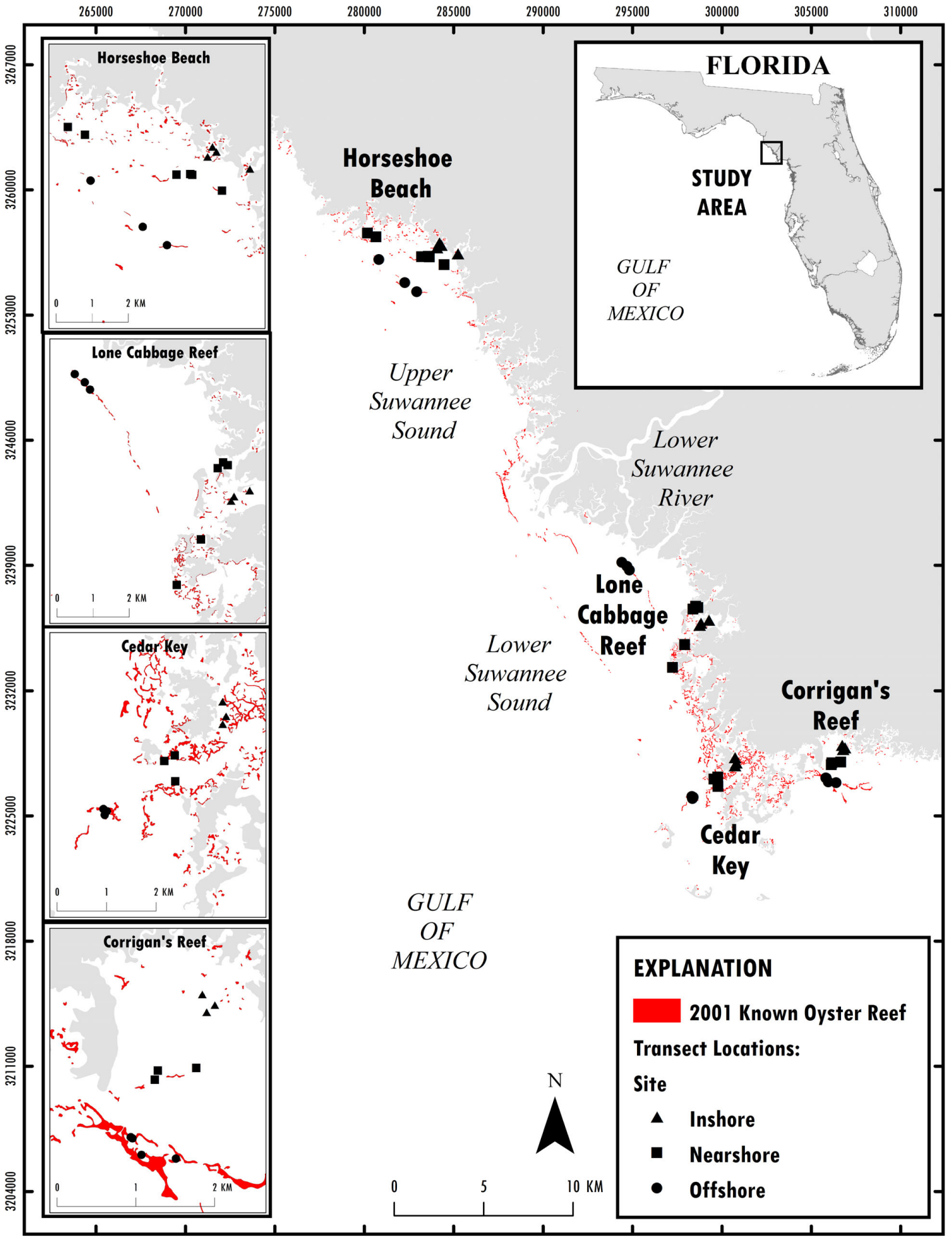
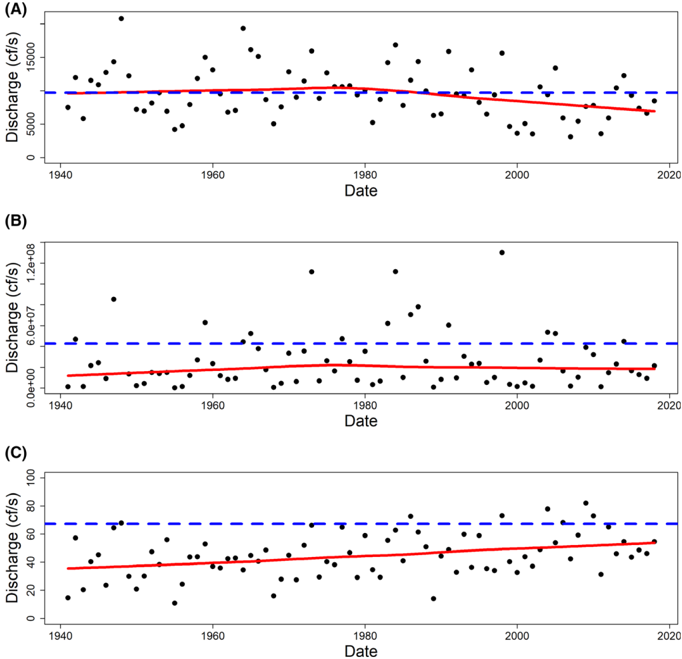
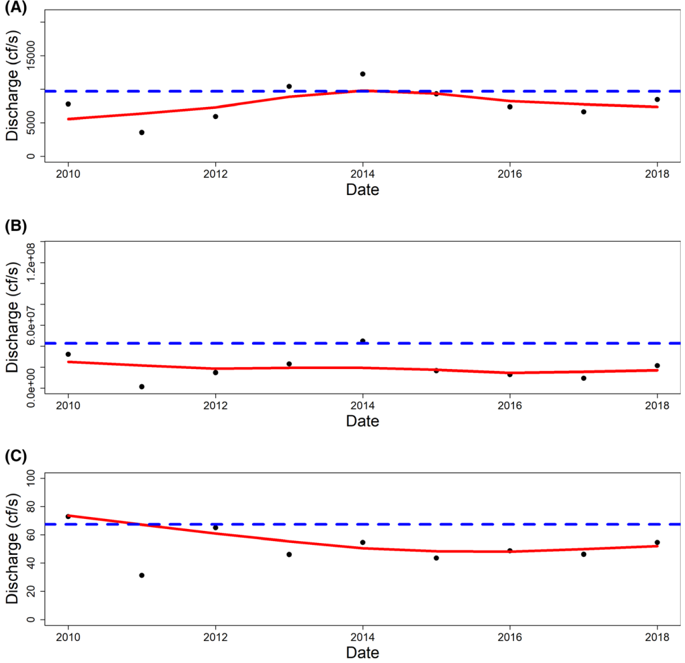
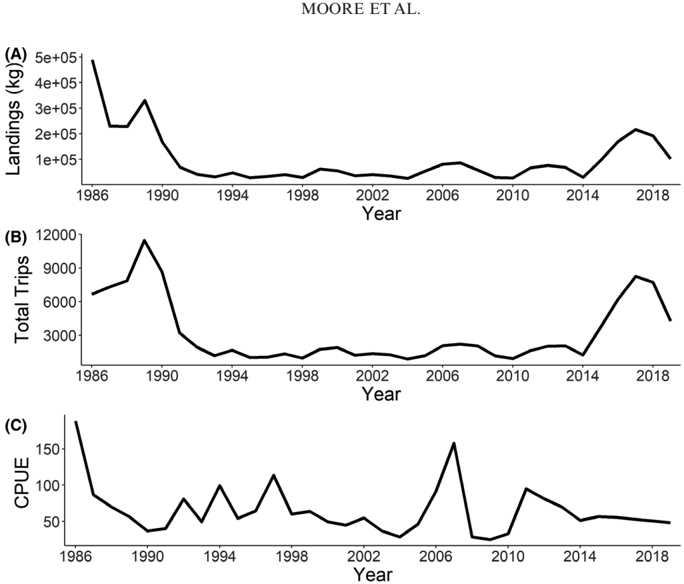
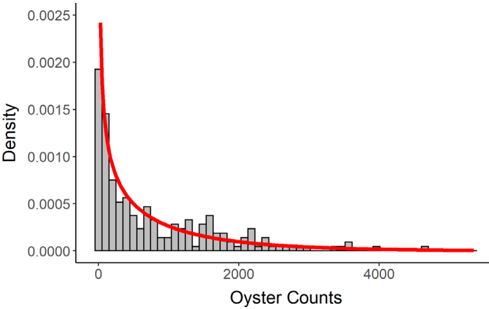
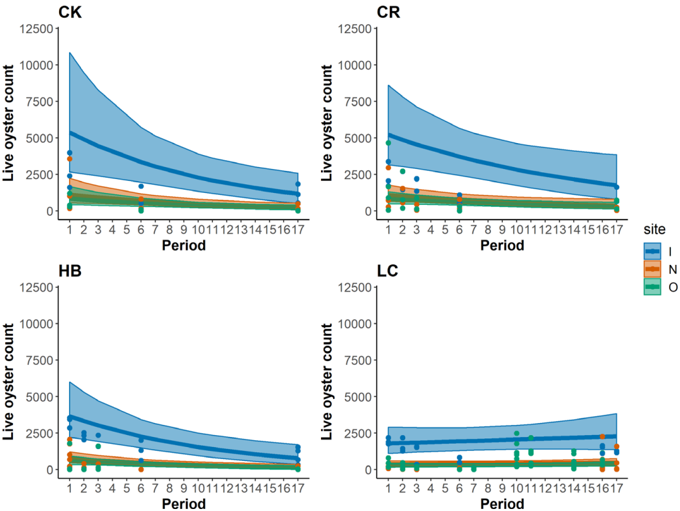
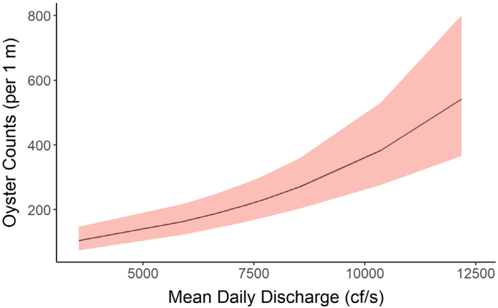
Within the Big Bend region of the northeastern Gulf of Mexico, one of the least developed coastlines in the continental USA, intertidal and subtidal populations of eastern oyster Crassostrea virginica (hereafter referred to as “oyster”) are a critical ecosystem and important economic constituent. We assessed trends in intertidal oyster populations, river discharge, and commercial fishing activity in the Suwannee River estuary within the Big Bend region using fisheries-independent data from irregular monitoring efforts and publicly available environmental data. We used generalized linear models to evaluate counts of oysters from line-transect surveys over time and space. We assessed model performance using simulation to understand potential bias and then evaluated whether these counts were related to freshwater inputs from the Suwannee River and commercial oyster fishing effort and landings at different time lags. We found that intertidal oyster counts have declined over time and that most of these declines are found in inshore intertidal oyster bars, which are becoming degraded. We also found a significant relationship between oyster counts and a 1-year lag on mean daily Suwannee River discharge, but including commercial fishery trips or landings did not improve model fit. It is unclear whether declines in intertidal oyster bars are offset by formation of new oyster reefs elsewhere. These results quantify rapid declines in intertidal oyster reefs in a region of coastline with high conservation value that can be used to inform ongoing and proposed restoration projects in the region.
Overview
The claims and statistics of this paper haven’t been checked yet.
Run the check — free, no account needed. It reads the open-access text and checks the sources it cites.
Integrity signals
Registry
Cites
Statistics
Figures
Verification
Claims the paper makes
The claims and statistics of this paper haven’t been checked yet.
Run the check — free, no account needed. It reads the open-access text and checks the sources it cites.
Claims other papers make about this one
Each is checked against this paper’s own text: does it say what the citing paper says it does?
In the citing paper
“Rigorously developed living data management plan is integrated with routine summaries of oyster and water quality data that are assessed prior to and during sampling events to evaluate the informativeness of monitoring (see application in Moore et al. 2020;Moore and Pine 2021).”
From Adaptive Management in Practice and the Problem of Application at Multiple Scales—Insights from Oyster Reef Restoration on Florida’s Gulf Coast (2022) · cites this paper as Moore et al. 2020
In the citing paper
“The Lone Cabbage Reef restoration project began following commercial fishing families' observations of declines in oysters in the estuary (Seavey et al. 2011;Moore et al. 2020).”
From Adaptive Management in Practice and the Problem of Application at Multiple Scales—Insights from Oyster Reef Restoration on Florida’s Gulf Coast (2022) · cites this paper as Moore et al. 2020
Self-check
Percentages, sums and reported differences re-computed from the paper’s own numbers.
The self-check needs the paper’s full text.
Citations
Cites
USGS Water Data for the Nation
Survey, U. S. G. (1994) · U.S. Geological Survey · doi:10.5066/f7p55kjn · Cited by 1,478
Ecological models and data in R
Bolker, B. M. (2008) · doi:10.2307/j.ctvcm4g37 · Cited by 1,297
Impact of elevated CO2 on shellfish calcification
Gazeau, F., Quiblier, C., Jansen, J. M., Gattuso, J., Middelburg, J. J., & Heip, C. H. R. (2007) · Geophysical Research Letters · doi:10.1029/2006gl028554 · Cited by 759
Research works printed but not linked: 62
- Alleway, 2015, Loss of an ecological baseline through the eradication of oyster reefs from coastal ecosystems and human memory, Conservation Biology, 29, 795, 10.1111/cobi.12452 · DOI
- Beck, 2011, Oyster reefs at risk and recommendations for conservation, restoration, and management, BioScience, 61, 107, 10.1525/bio.2011.61.2.5 · DOI
- Beck, 2000, Identification of priority sites for conservation in the northern Gulf of Mexico: an ecoregional plan
- Benke, 1990, A perspective on America's vanishing streams, Journal of the North American Benthological Society, 9, 77, 10.2307/1467936 · DOI
- Bergquist, 2006, Development of ecosystem indicators for the Suwannee River estuary: oyster reef habitat quality along a salinity gradient, Estuaries and Coasts, 29, 353, 10.1007/BF02784985 · DOI
- Bolker, 2009, Generalized linear mixed models: a practical guide for ecology and evolution, Trends in Ecology and Evolution, 24, 127, 10.1016/j.tree.2008.10.008 · DOI · Paper page
- Buzan, 2009, Positive relationship between freshwater inflow and oyster abundance in Galveston Bay, Texas, Estuaries and Coasts, 32, 206, 10.1007/s12237-008-9078-z · DOI
- Carranza, 2009, Diversity, conservation status and threats to native oysters (Ostreidae) around the Atlantic and Caribbean coasts of South America, Aquatic Conservation: Marine and Freshwater Ecosystems, 19, 344, 10.1002/aqc.993 · DOI
- Chatry, 1983, Optimum salinity regime for oyster production on Louisiana's state seed grounds, Contributions in Marine Science, 26, 81
- Coen, 2007, Ecosystem services related to oyster restoration, Marine Ecology Progress Series, 341, 303, 10.3354/meps341303 · DOI · Paper page
- Farrell, 2005, Technical report: MFL establishment for the lower Suwannee River and estuary, Little Fanning, Fanning, and Manatee Springs
- FDACS (Florida Department of Agriculture and Consumer Services), 2019, Shellfish harvesting area maps
- Fisch, 2016, A complex relationship between freshwater discharge and oyster fishery catch per unit effort in Apalachicola Bay, Florida: an evaluation from 1960 to 2013, Journal of Shellfish Research, 35, 809, 10.2983/035.035.0409 · DOI
- Florida v. Georgia, 2018, 138 S. Ct. 2505 (No. 142) (Supreme Court)
- Frederick, 2016, Reversing a rapid decline in oyster reefs: effects of durable substrate on oyster populations, elevations, and aquatic bird community composition, Journal of Shellfish Research, 35, 359, 10.2983/035.035.0210 · DOI · Paper page
- FWC (Florida Fish and Wildlife Conservation Commission), 2019, Commercial fisheries landings summaries
- Geselbracht, 2007, The Nature Conservancy, Florida Chapter, Final Report
- Geselbracht, 2011, Retrospective and prospective model simulations of sea level rise impacts on Gulf of Mexico coastal marshes and forests in Waccasassa Bay, Florida, Climatic Change, 107, 35, 10.1007/s10584-011-0084-y · DOI
- Grabowski, 2012, Economic valuation of ecosystem services provided by oyster reefs, BioScience, 62, 900, 10.1525/bio.2012.62.10.10 · DOI · Paper page
- Grinnell, 1972, Structure and development of oyster reefs on the Suwannee River delta, Florida. Doctoral dissertation
- Grizzle, 2018, Distribution and condition of intertidal eastern oyster (Crassostrea virginica) reefs in Apalachicola Bay Florida based on high-resolution satellite imagery, Journal of Shellfish Research, 37, 1027, 10.2983/035.037.0514 · DOI
- Gutiérrez, 2003, Mollusks as ecosystem engineers: the role of shell production in aquatic habitats, Oikos, 101, 79, 10.1034/j.1600-0706.2003.12322.x · DOI
- Harley, 2017, Suwannee River flow variability 1550–2005 CE reconstructed from a multispecies tree-ring network, Journal of Hydrology, 544, 438, 10.1016/j.jhydrol.2016.11.020 · DOI
- Hine, 1988, Recent geological history and modern sedimentary processes along an incipient, low-energy, epicontinental-sea coastline: northwest Florida, Journal of Sedimentary Petrology, 58, 567
- Kaplan, 2016, Freshwater detention by oyster reefs: quantifying a keystone ecosystem service, PLoS ONE, 11, e0167694, 10.1371/journal.pone.0167694 · DOI · Paper page
- Kimbro, 2017, Local and regional stressors interact to drive a salinization-induced outbreak of predators on oyster reefs, Ecosphere, 8, e01992, 10.1002/ecs2.1992 · DOI
- La Peyre, 2009, Defining optimal freshwater flow for oyster production: effects of freshet rate and magnitude of change and duration on eastern oysters and Perkinsus marinus infection, Estuaries and Coasts, 32, 522, 10.1007/s12237-009-9149-9 · DOI
- La Peyre, 2003, Environmental significance of freshets in reducing Perkinsus marinus infection in eastern oysters Crassostrea virginica: potential management applications, Marine Ecology Progress Series, 248, 165, 10.3354/meps248165 · DOI
- Locker, 2016, Geology and biology of the “sticky grounds”, shelf-margin carbonate mounds, and mesophotic ecosystem in the eastern Gulf of Mexico, Continental Shelf Research, 125, 71, 10.1016/j.csr.2016.06.015 · DOI
- Lowe, 2017, Interactive effects of water temperature and salinity on growth and mortality of eastern oysters, Crassostrea virginica: a meta-analysis using 40 years of monitoring data, Journal of Shellfish Research, 36, 683, 10.2983/035.036.0318 · DOI
- Main, 2007, Florida's environment: north central region
- Mattson, 2002, A resource-based framework for establishing freshwater inflow requirements for the Suwannee River estuary, Estuaries, 25, 1333, 10.1007/BF02692228 · DOI · Paper page
- Miller, 2009, Shellfish face uncertain future in high CO2 world: influence of acidification on oyster larvae calcification and growth in estuaries, PLoS ONE, 4, 10.1371/journal.pone.0005661 · DOI
- Montague, 1997, Introduction: the intertidal marshes of Florida's Gulf Coast, 1
- Mulholland, 1997, Effects of climate change on freshwater ecosystems of the south-eastern United States and the Gulf Coast of Mexico, Hydrological Processes, 11, 949, 10.1002/(SICI)1099-1085(19970630)11:8<949::AID-HYP513>3.0.CO;2-G · DOI
- NOAA (National Oceanographic and Atmospheric Administration), 2019, NOAA tides and currents
- NOAA (National Oceanic and Atmospheric Administration), 2019, Commercial fisheries landings
- Orlando, 1993, Salinity characteristics of Gulf of Mexico estuaries
- Pine, 2015, The curious case of eastern oyster Crassostrea virginica stock status in Apalachicola Bay, Florida, Ecology and Society, 20, art46, 10.5751/ES-07827-200346 · DOI · Paper page
- Powell, 1992, Oyster disease and climate change. Are yearly changes in Perkinsus marinus parasitism in oysters (Crassostrea virginica) controlled by climatic cycles in the Gulf of Mexico?, Marine Ecology, 13, 243, 10.1111/j.1439-0485.1992.tb00354.x · DOI
- Powell, 2007, Is oyster shell a sustainable estuarine resource?, Journal of Shellfish Research, 26, 181, 10.2983/0730-8000(2007)26[181:IOSASE]2.0.CO;2 · DOI
- Puckett, 2016, Metapopulation dynamics guide marine reserve design: importance of connectivity, demographics, and stock enhancement, Ecosphere, 7, 10.1002/ecs2.1322 · DOI
- Pusack, 2019, Predation on oysters is inhibited by intense or chronically mild, low salinity events, Limnology and Oceanography, 64, 81, 10.1002/lno.11020 · DOI
- R Core Team, 2018, R: a language and environment for statistical computing. R Foundation for Statistical Computing, Vienna
- Raabe, 2016, Expansion of tidal marsh in response to sea-level rise: Gulf Coast of Florida, USA, Estuaries and Coasts, 39, 145, 10.1007/s12237-015-9974-y · DOI
- Saetta, 2015, Case study and life cycle assessment of a coastal utility facing saltwater intrusion, Journal American Water Works Association, 107, E543, 10.5942/jawwa.2015.107.0148 · DOI
- Sassaman, 2017, Keeping pace with rising sea: the first 6 years of the Lower Suwannee Archaeological Survey, Gulf coastal Florida, Journal of Island and Coastal Archaeology, 12, 173, 10.1080/15564894.2016.1163758 · DOI
- Seavey, 2011, Decadal changes in oyster reefs in the Big Bend of Florida's Gulf Coast, Ecosphere, 2, 114, 10.1890/ES11-00205.1 · DOI · Paper page
- Sehlinger, 2019, Differential effects of temperature and salinity on growth and mortality of oysters (Crassostrea virginica) in Barataria Bay and Breton Sound, Louisiana. Journal of Shellfish Research, 38, 317, 10.2983/035.038.0212 · DOI
- Southwick Associates, 2015, Demographic, economic, and growth initiative analysis: Big Bend region of Florida
- Suwannee River Water Management District, 2019, Suwannee River minimum flows and levels
- Swain, 2016, Applying downscaled global climate model data to a groundwater model of the Suwannee River basin, Florida, USA, American Journal of Climate Change, 5, 526, 10.4236/ajcc.2016.54037 · DOI
- Turner, 2006, Will lowering estuarine salinity increase Gulf of Mexico oyster landings?, Estuaries and Coasts, 29, 345, 10.1007/BF02784984 · DOI
- Venables, 2002, Modern applied statistics with S, 10.1007/978-0-387-21706-2 · DOI
- Ward, 2005, Rivers of North America
- Wilberg, 2011, Overfishing, disease, habitat loss, and potential extirpation of oysters in upper Chesapeake Bay, Marine Ecology Progress Series, 436, 131, 10.3354/meps09161 · DOI
- Wilberg, 2013, Sustainable exploitation and management of autogenic ecosystem engineers: application to oysters in Chesapeake Bay, Ecological Applications, 23, 766, 10.1890/12-0563.1 · DOI
- Windle, 2019, Rapid and accurate monitoring of intertidal oyster reef habitat using unoccupied aircraft systems and structure from motion, Remote Sensing, 11, 2394, 10.3390/rs11202394 · DOI
- Wright, 2005, The effect of sea-level and climate change on the development of a mixed siliciclastic carbonate, deltaic coastline: Suwannee River, Florida, USA, Journal of Sedimentary Research, 75, 621, 10.2110/jsr.2005.051 · DOI
- Zu Ermgassen, 2012, Historical ecology with real numbers: past and present extent and biomass of an imperiled estuarine habitat, Proceedings of the Royal Society B: Biological Sciences, 279, 3393, 10.1098/rspb.2012.0313 · DOI
- Zuur, 2013, A beginner's guide to GLM and GLMM with R
- Zuur, 2009, Mixed effect models and extensions in ecology with, 10.1007/978-0-387-87458-6 · DOI · Paper page
Cited by
Sorted by citations
Pine, W. E., Johnson, F. A., Frederick, P. C., & Coggins, L. G. (2022) · Marine and Coastal Fisheries · doi:10.1002/mcf2.10192 · Cited by 16
Self-citation
Metadata
- Authors
- Moore, J. F., Pine, W. E., Frederick, P. C., Beck, S., Moreno, M., Dodrill, M. J., Boone, M., Sturmer, L., & Yurek, S.
- Affiliations
- Department of Wildlife Ecology and Conservation, University of Florida, 110 Newins-Ziegler Hall, Gainesville, Florida, 32611, USA
- U.S. Geological Survey, Western Fisheries Research Center, Columbia River Reserach Laboratory, 5501A Cook-Underwood Road, Cook, Washington, 98605, USA
- Porzana Solutions, Marquette Heights, Illinois, 61554, USA
- University of Florida Extension, Senator George Kirkpatrick Marine Lab, 11350 Southwest 153rd Court, Cedar Key, Florida, 32625, USA
- U.S. Geological Survey, Wetland and Aquatic Research Center, 7920 Northwest 71st Street, Gainesville, Florida, 32653, USA
- Venue
- Marine and Coastal Fisheries
- Publisher
- Oxford University Press (OUP)
- Published
- 2020-05-30
- Volume
- 12
- Issue
- 3
- Pages
- 191-204
- ISSN
- 1942-5120
- Cited by
- 29
- References
- 3
- Language
- en
About these checks
Registry, retraction, Cites and statistics results are computed, not judged, with one exception: a printed reference that no index lists is read once by a model before it counts as a citation error. Claims are extracted by a model and kept only when their quote appears verbatim in the text; each cited source is then checked, with a model’s help, for whether it says what the claim relies on. Those verdicts can be wrong — read the claim’s quote and the cited source before relying on one.
Statistics and arithmetic are recomputed, not judged.
Confidence bands are shown only for fields calibrated on our annotated test set. None is calibrated yet, so no band is shown.
What counts as a claim ›How we measure confidence ›How we check this ›
Are you an author, or do you see a problem with this page? Request a review
