

The DOI matches its Crossref record; 68 of the 68 references it cites were found in a registry or an index.
Insights Into the Conformational Dynamics of the Cytoplasmic Domain of Metal‐Sensing Sensor Histidine Kinase ZraS
Open accessPublished version of a preprint
Abstract
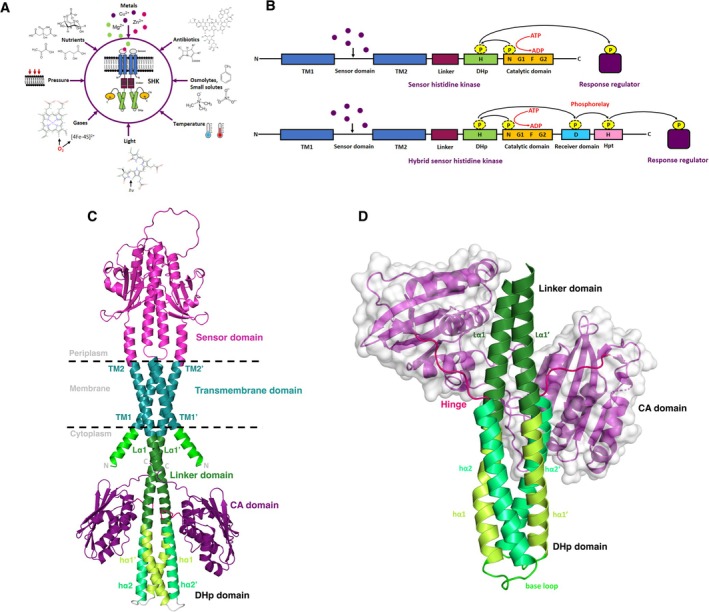
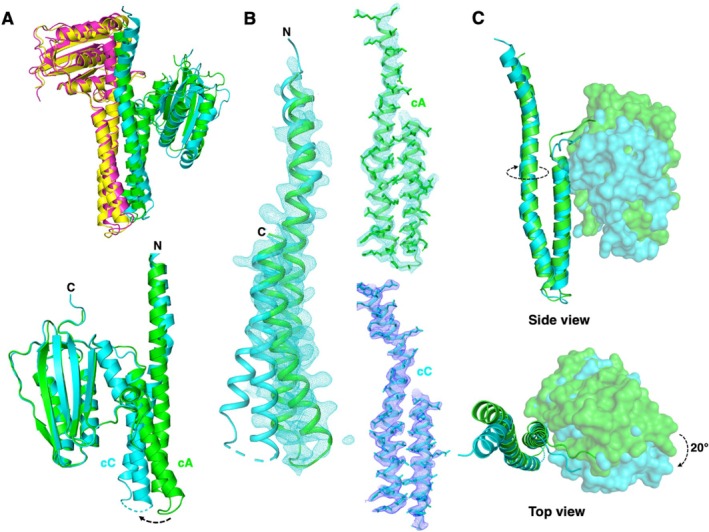
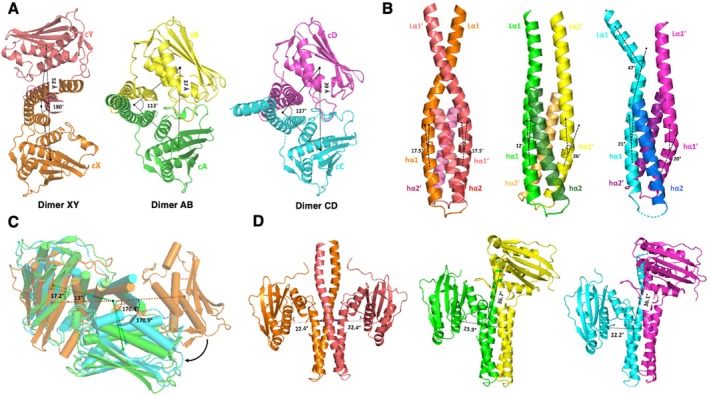
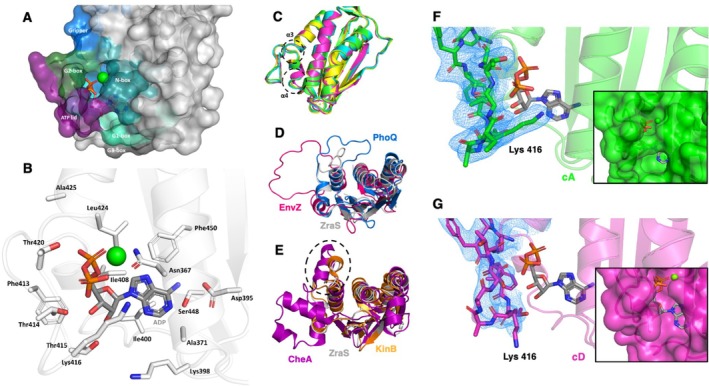
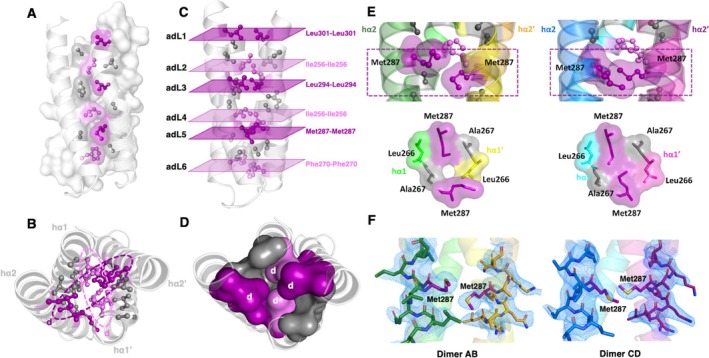
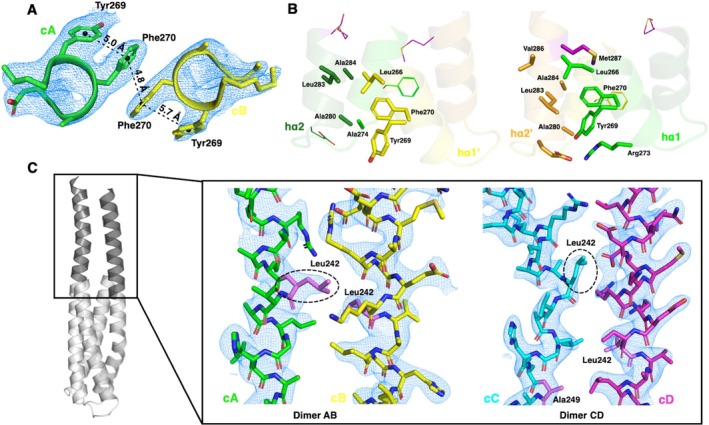
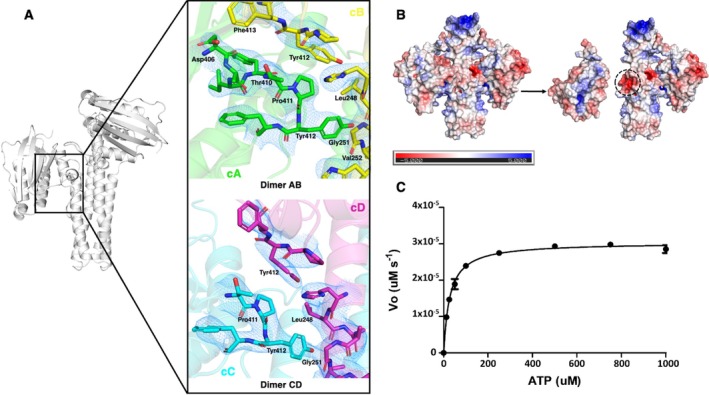
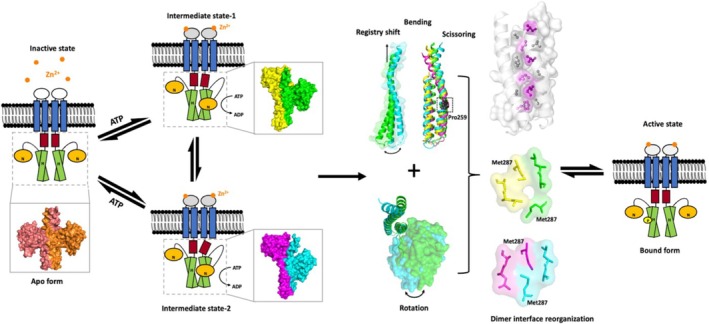
ZraS is a metal sensor integral to ZraPSR, a two‐component signaling system found in enterobacters. It belongs to a family of bifunctional sensor histidine kinases (SHKs) and is speculated to sense zinc‐induced stress on the bacterial envelope. Information on the structure–function relationship of sensor kinases is elusive due to the lack of full‐length structures, intrinsically dynamic behavior, and difficulty trapping them in active state conformations. While the kinase domains (KDs) of a few SHKs are well characterized, they exhibit significant functional diversity attributed to their modular multi‐domain arrangement in the cytoplasmic region, combined with other signal transducing elements such as simple helices, HAMP, and PAS domains. We report the crystal structure of the entire cytoplasmic region of Escherichia coli ZraS (EcZraS‐CD) resolved at a resolution of 2.49 Å, comprising a unique helical linker and the KD. In the asymmetric unit, four molecules of ZraS assemble as homodimers trapped as two ligand‐bound occluded conformers. Our analysis using these conformers shows that modulation of the dimer bundle through segmental helical bending, sliding, and rotation leads to the reorganization of the dimerization interface during kinase activation. Further, our analysis reveals the significance of aromatic amino acid interactions and loop residues at the dimer base in regulating the directionality of rotation during autophosphorylation. We also performed an in vitro coupled assay to determine ATPase activity. Overall, our findings provide structure‐based mechanistic insights into the process of autophosphorylation in trans‐acting SHKs.
Overview
The claims and statistics of this paper haven’t been checked yet.
Run the check — free, no account needed. It reads the open-access text and checks the sources it cites.
Integrity signals
Registry
Cites
Statistics
Figures
Verification
Claims the paper makes
The claims and statistics of this paper haven’t been checked yet.
Run the check — free, no account needed. It reads the open-access text and checks the sources it cites.
Self-check
Percentages, sums and reported differences re-computed from the paper’s own numbers.
The self-check needs the paper’s full text.
Citations
Cites
1 retracted
RETRACTED: A mathematical model explains saturating axon guidance responses to molecular gradients
Nguyen, H., Dayan, P., Pujic, Z., Cooper-White, J., & Goodhill, G. J. (2016) · eLife · doi:10.7554/elife.12248 · Cited by 1,221
RetractedThompson, J. D., Higgins, D. G., & Gibson, T. J. (1994) · Nucleic Acids Research · doi:10.1093/nar/22.22.4673 · Cited by 64,617
Highly accurate protein structure prediction with AlphaFold
Jumper, J., Evans, R., Pritzel, A., Green, T., Figurnov, M., Ronneberger, O., Tunyasuvunakool, K., Bates, R., Žídek, A., Potapenko, A., et al. (2021) · Nature · doi:10.1038/s41586-021-03819-2 · Cited by 43,764
Coot : model-building tools for molecular graphics
Emsley, P., & Cowtan, K. (2004) · Acta Crystallographica Section D Biological Crystallography · doi:10.1107/s0907444904019158 · Cited by 30,571
PHENIX : a comprehensive Python-based system for macromolecular structure solution
Adams, P. D., Afonine, P. V., Bunkóczi, G., Chen, V. B., Davis, I. W., Echols, N., Headd, J. J., Hung, L.-W., Kapral, G. J., Grosse-Kunstleve, R. W., et al. (2010) · Acta Crystallographica Section D Biological Crystallography · doi:10.1107/s0907444909052925 · Cited by 23,716
Phaser crystallographic software
McCoy, A. J., Grosse-Kunstleve, R. W., Adams, P. D., Winn, M. D., Storoni, L. C., & Read, R. J. (2007) · Journal of Applied Crystallography · doi:10.1107/s0021889807021206 · Cited by 20,612
Kabsch, W. (2010) · Acta Crystallographica Section D Biological Crystallography · doi:10.1107/s0907444909047337 · Cited by 16,463
WebLogo: A Sequence Logo Generator: Figure 1
Crooks, G. E., Hon, G., Chandonia, J.-M., & Brenner, S. E. (2004) · Genome Research · doi:10.1101/gr.849004 · Cited by 12,386
In situ click chemistry generation of cyclooxygenase-2 inhibitors
Bhardwaj, A., Kaur, J., Wuest, M., & Wuest, F. (2017) · Nature Communications · doi:10.1038/s41467-016-0009-6 · Cited by 7,448
Electrostatics of nanosystems: Application to microtubules and the ribosome
Baker, N., Sept, D., Joseph, S., Holst, M., & McCammon, J. A. (2001) · Proceedings of the National Academy of Sciences · doi:10.1073/pnas.181342398 · Cited by 7,125
Deciphering key features in protein structures with the new ENDscript server
Robert, X., & Gouet, P. (2014) · Nucleic Acids Research · doi:10.1093/nar/gku316 · Cited by 7,053
Two-Component Signal Transduction
Stock, A., Robinson, V. L., & Goudreau, P. N. (2000) · Annual Review of Biochemistry · doi:10.1146/annurev.biochem.69.1.183 · Cited by 3,653
PDB2PQR: an automated pipeline for the setup of Poisson-Boltzmann electrostatics calculations
Dolinsky, T. J., Nielsen, J. E., McCammon, J. A., & Baker, N. (2004) · Nucleic Acids Research · doi:10.1093/nar/gkh381 · Cited by 3,517
Integration, scaling, space-group assignment and post-refinement
Kabsch, W. (2010) · Acta Crystallographica Section D Biological Crystallography · doi:10.1107/s0907444909047374 · Cited by 2,564
Chou, P. Y., & Fasman, G. D. (1974) · Biochemistry · doi:10.1021/bi00699a001 · Cited by 2,172
Protein phosphorylation and regulation of adaptive responses in bacteria
Stock, J., Ninfa, A. J., & Stock, A. (1989) · Microbiological Reviews · doi:10.1128/mr.53.4.450-490.1989 · Cited by 1,692
Barlow, D. J., & Thornton, J. M. (1988) · Journal of Molecular Biology · doi:10.1016/0022-2836(88)90641-9 · Cited by 1,064
Maldonado, M., Guo, F., & Letts, J. A. (2021) · eLife · doi:10.7554/elife.62047 · Cited by 834
A robust SNP barcode for typing Mycobacterium tuberculosis complex strains
Coll, F., McNerney, R., Guerra-Assunção, J. A., Glynn, J. R., Perdigão, J., Viveiros, M., Portugal, I., Pain, A., Martin, N., & Clark, T. G. (2014) · Nature Communications · doi:10.1038/ncomms5812 · Cited by 697
Structure of CheA, a Signal-Transducing Histidine Kinase
Bilwes, A. M., Alex, L. A., Crane, B. R., & Simon, M. I. (1999) · Cell · doi:10.1016/s0092-8674(00)80966-6 · Cited by 476
Yamamoto, K., Hirao, K., Oshima, T., Aiba, H., Utsumi, R., & Ishihama, A. (2005) · Journal of Biological Chemistry · doi:10.1074/jbc.m410104200 · Cited by 444
The Histidine Protein Kinase Superfamily
Grebe, T. W., & Stock, J. B. (1999) · Advances in Microbial Physiology · doi:10.1016/s0065-2911(08)60167-8 · Cited by 379
GPCR activation mechanisms across classes and macro/microscales
Hauser, A. S., Kooistra, A. J., Munk, C., Heydenreich, F. M., Veprintsev, D. B., Bouvier, M., Babu, M. M., & Gloriam, D. E. I. (2021) · Nature Structural & Molecular Biology · doi:10.1038/s41594-021-00674-7 · Cited by 313
Structural insights into the signalling mechanisms of two-component systems
Jacob-Dubuisson, F., Mechaly, A., Betton, J.-M., & Antoine, R. (2018) · Nature Reviews Microbiology · doi:10.1038/s41579-018-0055-7 · Cited by 308
Structure of the entire cytoplasmic portion of a sensor histidine‐kinase protein
Marina, A., Waldburger, C. D., & Hendrickson, W. A. (2005) · The EMBO Journal · doi:10.1038/sj.emboj.7600886 · Cited by 299
Signal Transduction in Histidine Kinases: Insights from New Structures
Bhate, M. P., Molnar, K. S., Goulian, M., & DeGrado, W. F. (2015) · Structure · doi:10.1016/j.str.2015.04.002 · Cited by 285
Evolution and phyletic distribution of two-component signal transduction systems
Wuichet, K., Cantwell, B. J., & Zhulin, I. B. (2010) · Current Opinion in Microbiology · doi:10.1016/j.mib.2009.12.011 · Cited by 263
Strelkov, S. V., & Burkhard, P. (2002) · Journal of Structural Biology · doi:10.1006/jsbi.2002.4454 · Cited by 249
Concepts for biocontrol in marine environments: is there a way forward?
Atalah, J., Hopkins, G. A., Fletcher, L., Castinel, A., & Forrest, B. M. (2015) · Management of Biological Invasions · doi:10.3391/mbi.2015.6.1.01 · Cited by 237
Bacterial Histidine Kinases as Novel Antibacterial Drug Targets
Bem, A. E., Velikova, N., Pellicer, M. T., van Baarlen, P., Marina, A., & Wells, J. M. (2014) · ACS Chemical Biology · doi:10.1021/cb5007135 · Cited by 212
Structural plasticity and catalysis regulation of a thermosensor histidine kinase
Albanesi, D., Martín, M., Trajtenberg, F., Mansilla, M. C., Haouz, A., Alzari, P. M., de Mendoza, D., & Buschiazzo, A. (2009) · Proceedings of the National Academy of Sciences · doi:10.1073/pnas.0906699106 · Cited by 190
Diensthuber, R. P., Bommer, M., Gleichmann, T., & Möglich, A. (2013) · Structure · doi:10.1016/j.str.2013.04.024 · Cited by 186
Wang, C., Sang, J., Wang, J., Su, M.-Y., Downey, J. S., Wu, Q., Wang, S., Cai, Y., Xu, X., Wu, J., et al. (2013) · PLoS Biology · doi:10.1371/journal.pbio.1001493 · Cited by 170
Ninfa, E. G., Atkinson, M. R., Kamberov, E. S., & Ninfa, A. J. (1993) · Journal of Bacteriology · doi:10.1128/jb.175.21.7024-7032.1993 · Cited by 159
Visualizing autophosphorylation in histidine kinases
Casino, P., Miguel-Romero, L., & Marina, A. (2014) · Nature Communications · doi:10.1038/ncomms4258 · Cited by 154
Genomic analysis of the histidine kinase family in bacteria and archaea
Kim, D.-J., & Forst, S. (2001) · Microbiology · doi:10.1099/00221287-147-5-1197 · Cited by 152
The hunchback and its neighbours: proline as an environmental modulator
Reiersen, H., & Rees, A. R. (2001) · Trends in Biochemical Sciences · doi:10.1016/s0968-0004(01)01957-0 · Cited by 133
Leonhartsberger, S., Huber, A., Lottspeich, F., & Böck, A. (2001) · Journal of Molecular Biology · doi:10.1006/jmbi.2000.4451 · Cited by 129
Capra, E. J., Perchuk, B. S., Lubin, E. A., Ashenberg, O., Skerker, J. M., & Laub, M. T. (2010) · PLoS Genetics · doi:10.1371/journal.pgen.1001220 · Cited by 126
Wang, L. C., Morgan, L. K., Godakumbura, P. I., et al. (2012) · The EMBO Journal · doi:10.1038/emboj.2012.99 · Cited by 125
Segmental Helical Motions and Dynamical Asymmetry Modulate Histidine Kinase Autophosphorylation
Méchaly, A., Sassoon, N., Betton, J., & Alzari, P. M. (2014) · PLoS Biology · doi:10.1371/journal.pbio.1001776 · Cited by 123
Structure of PAS-Linked Histidine Kinase and the Response Regulator Complex
Yamada, S., Sugimoto, H., Kobayashi, M., Ohno, A., Nakamura, H., & Shiro, Y. (2009) · Structure · doi:10.1016/j.str.2009.07.016 · Cited by 93
Helix Bundle Loops Determine Whether Histidine Kinases Autophosphorylate in cis or in trans
Ashenberg, O., Keating, A. E., & Laub, M. T. (2013) · Journal of Molecular Biology · doi:10.1016/j.jmb.2013.01.011 · Cited by 81
Cyclic di-GMP mediates a histidine kinase/phosphatase switch by noncovalent domain cross-linking
Dubey, B. N., Lori, C., Ozaki, S., Fucile, G., Plaza-Menacho, I., Jenal, U., & Schirmer, T. (2016) · Science Advances · doi:10.1126/sciadv.1600823 · Cited by 73
Sequential conformational transitions and α-helical supercoiling regulate a sensor histidine kinase
Berntsson, O., Diensthuber, R. P., Panman, M. R., Björling, A., Gustavsson, E., Hoernke, M., Hughes, A. J., Henry, L., Niebling, S., Takala, H., et al. (2017) · Nature Communications · doi:10.1038/s41467-017-00300-5 · Cited by 73
Gutu, A. D., Wayne, K. J., Sham, L., & Winkler, M. E. (2010) · Journal of Bacteriology · doi:10.1128/jb.01690-09 · Cited by 71
Bick, M. J., Lamour, V., Rajashankar, K. R., Gordiyenko, Y., Robinson, C. V., & Darst, S. A. (2008) · Journal of Molecular Biology · doi:10.1016/j.jmb.2008.12.006 · Cited by 66
Trajtenberg, F., Imelio, J. A., Machado, M. R., Larrieux, N., Marti, M. A., Obal, G., Méchaly, A., & Buschiazzo, A. (2016) · eLife · doi:10.7554/elife.21422 · Cited by 65
Directionality of dynein is controlled by the angle and length of its stalk
Can, S., Lacey, S. E., Gür, M., Carter, A. P., & Yıldız, A. (2019) · Nature · doi:10.1038/s41586-019-0914-z · Cited by 65
Conserved positioning of proline residues in membrane-spanning helices of ion-channel proteins
Woolfson, D. N., Mortishire‐Smith, R. J., & Williams, D. H. (1991) · Biochemical and Biophysical Research Communications · doi:10.1016/0006-291x(91)91627-o · Cited by 59
Liu, Y., Rose, J. A., Huang, S., et al. (2017) · Nature Communications · doi:10.1038/s41467-017-02310-9 · Cited by 59
Methodological improvements for the analysis of domain movements in large biomolecular complexes
Veevers, R., & Hayward, S. (2019) · Biophysics and Physicobiology · doi:10.2142/biophysico.16.0_328 · Cited by 58
Matamouros, S., Hager, K. R., & Miller, S. I. (2015) · mBio · doi:10.1128/mbio.00616-15 · Cited by 57
Rome, K., Borde, C., Taher, R., Cayron, J., Lesterlin, C., Gueguen, E., de Rosny, E., & Rodrigue, A. (2018) · Journal of Molecular Biology · doi:10.1016/j.jmb.2018.10.021 · Cited by 56
Stewart, V. J., & Chen, L. (2009) · Journal of Bacteriology · doi:10.1128/jb.00172-09 · Cited by 51
Crystallographic snapshot of the Escherichia coli EnvZ histidine kinase in an active conformation
Ferris, H. U., Coles, M. P., Lupas, A. N., & Hartmann, M. D. (2014) · Journal of Structural Biology · doi:10.1016/j.jsb.2014.03.014 · Cited by 50
Song, Y., Peisach, D., Pioszak, A. A., Xu, Z., & Ninfa, A. J. (2004) · Biochemistry · doi:10.1021/bi049474r · Cited by 42
Petit-Härtlein, I., Rome, K., de Rosny, E., Molton, F., Duboc, C., Gueguen, E., Rodrigue, A., & Covès, J. (2015) · Biochemical Journal · doi:10.1042/bj20150827 · Cited by 40
Cysteine-Scanning Analysis of the Dimerization Domain of EnvZ, an Osmosensing Histidine Kinase
Qin, L., Cai, S., Zhu, Y., & Inouye, M. (2003) · Journal of Bacteriology · doi:10.1128/jb.185.11.3429-3435.2003 · Cited by 36
Conformational dynamics of the essential sensor histidine kinase WalK
Cai, Y., Su, M., Ahmad, A., Hu, X., Sang, J., Kong, L., Chen, X., Wang, C., Shuai, J., & Han, A. (2017) · Acta Crystallographica Section D Structural Biology · doi:10.1107/s2059798317013043 · Cited by 35
A library of coiled-coil domains: from regular bundles to peculiar twists
Szczepaniak, K., Bukala, A., Neto, A. M. D. S., Ludwiczak, J., & Dunin-Horkawicz, S. (2020) · Bioinformatics · doi:10.1093/bioinformatics/btaa1041 · Cited by 35
Structure of the Entire Stalk Region of the Dynein Motor Domain
Nishikawa, Y., Oyama, T., Kamiya, N., Kon, T., Toyoshima, Y. Y., Nakamura, H., & Kurisu, G. (2014) · Journal of Molecular Biology · doi:10.1016/j.jmb.2014.06.023 · Cited by 33
Schmidt, N. W., Grigoryan, G., & DeGrado, W. F. (2016) · Protein Science · doi:10.1002/pro.3095 · Cited by 32
Allosteric mechanism of signal transduction in the two-component system histidine kinase PhoQ
Mensa, B., Polizzi, N. F., Molnar, K., Natale, A., Lemmin, T., & DeGrado, W. F. (2021) · eLife · doi:10.7554/elife.73336 · Cited by 29
Cho, H. Y., Lee, Y., Bae, Y., Kim, E., & Kang, B. S. (2013) · Journal of Biological Chemistry · doi:10.1074/jbc.m112.442467 · Cited by 17
A structure-function study of ZraP and ZraS provides new insights into the two-component system Zra
Taher, R., & de Rosny, E. (2020) · Biochimica et Biophysica Acta (BBA) - General Subjects · doi:10.1016/j.bbagen.2020.129810 · Cited by 14
Sliding Mechanism at a Coiled-Coil Interface
Gomez, D., Gavrilov, Y., & Levy, Y. (2019) · Biophysical Journal · doi:10.1016/j.bpj.2019.02.026 · Cited by 13
FILIP, A., Bata, Z., Anghel, A. E., Poppe, L., & BENCZE, L. C. (2022) · Studia Universitatis Babeș-Bolyai Chemia · doi:10.24193/subbchem.2022.4.03 · Cited by 2
Metadata
- Authors
- Mahapatra, N., Mahanta, P., Pandey, S., & Acharya, R.
- Affiliations
- National Institute of Science Education and Research (IN)
- Corresponding author
- Acharya, Rudresh
- Venue
- Proteins: Structure, Function, and Bioinformatics
- Publisher
- Wiley
- Published
- 2025-03-10
- Volume
- 93
- Issue
- 9
- Pages
- 1465-1480
- ISSN
- 0887-3585 (ISSN-L)
- 1097-0134
- PMC
- PMC12314577
- OpenAlex
- W4408301829
- Cited by
- 2
- References
- 68
- Citations by year
- 2025: 2
- FWCI
- 1.17
- Type
- journal article
- Language
- en
- Open access
- hybrid
- doi.org
- Licence
- Locations
- Proteins Structure Function and Bioinformatics (publishedVersion, cc-by-nc-nd)
- bioRxiv (Cold Spring Harbor Laboratory) (acceptedVersion)
- Europe PMC (PubMed Central) (publishedVersion, cc-by-nc-nd)
- PubMed Central (publishedVersion, cc-by-nc-nd)
- PubMed (publishedVersion)
- Funders
- National Institute of Science Education and Research (RIN4002)
- Council of Scientific and Industrial Research, India (09/1002(0045)/2019‐EMR‐I)
- Topics
- Life Sciences › Biochemistry, Genetics and Molecular Biology › Genetics › Bacterial Genetics and Biotechnology
- Life Sciences › Biochemistry, Genetics and Molecular Biology › Molecular Biology › Protein Structure and Dynamics
- Life Sciences › Biochemistry, Genetics and Molecular Biology › Structural Biology › Enzyme Structure and Function
- Keywords
- sensor histidine kinase, two-component systems, zinc ion detection, Escherichia coli, kinase domain, homodimer, ATPase activity, conformational dynamics
- MeSH terms
- Histidine Kinase, Protein Domains, Binding Sites, Cytoplasm, Escherichia coli, Models, Molecular, Protein Binding, Protein Conformation, Zinc, Signal Transduction, Crystallography, X-Ray, Escherichia coli Proteins, Protein Multimerization
About these checks
Registry, retraction, Cites and statistics results are computed, not judged, with one exception: a printed reference that no index lists is read once by a model before it counts as a citation error. Claims are extracted by a model and kept only when their quote appears verbatim in the text; each cited source is then checked, with a model’s help, for whether it says what the claim relies on. Those verdicts can be wrong — read the claim’s quote and the cited source before relying on one.
Statistics and arithmetic are recomputed, not judged.
Confidence bands are shown only for fields calibrated on our annotated test set. None is calibrated yet, so no band is shown.
What counts as a claim ›How we measure confidence ›How we check this ›
Are you an author, or do you see a problem with this page? Request a review
Data sources
Bibliographic data: Semantic Scholar, OpenAlex, Crossref.
Contains information from the Semantic Scholar Academic Graph Datasets, made available under the ODC Attribution License (ODC-BY 1.0).
Semantic Scholar’s data is described in: Kinney, R., et al. (2023). The Semantic Scholar Open Data Platform. arXiv:2301.10140.
