Cited by 20Immunotoxicology and immune responsesStatistical Methods in Clinical TrialsAnimal testing and alternatives

The DOI matches its Crossref record; the references it cites are not checked yet.

Systems Pharmacology Model of Gastrointestinal Damage Predicts Species Differences and Optimizes Clinical Dosing Schedules

Open access

Abstract

Gastrointestinal (GI) adverse events (AEs) are frequently dose limiting for oncology agents, requiring extensive clinical testing of alternative schedules to identify optimal dosing regimens. Here, we develop a translational mathematical model to predict these clinical AEs starting from preclinical GI toxicity data. The model structure incorporates known biology and includes stem cells, daughter cells, and enterocytes. Published data, including cellular numbers and division times, informed the system parameters for humans and rats. The drug‐specific parameters were informed with preclinical histopathology data from rats treated with irinotecan. The model fit the rodent irinotecan‐induced pathology changes well. The predicted time course of enterocyte loss in patients treated with weekly doses matched observed AE profiles. The model also correctly predicts a lower level of AEs for every 3 weeks (Q3W), as compared to the weekly schedule.

Overview

The claims and statistics of this paper haven’t been checked yet.

Run the check — free, no account needed. It reads the open-access text and checks the sources it cites.

A few free checks a day · papers already verified open instantly · results are public

Integrity signals

Registry

Crossref · 10.1002/psp4.12255

Cites

Statistics

Figures

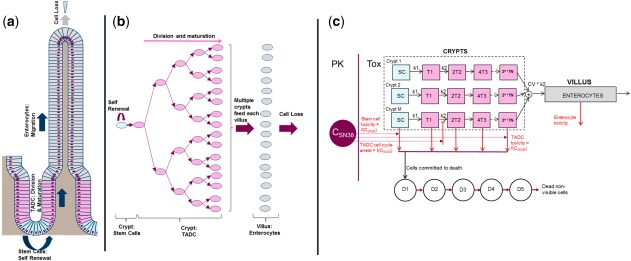
Figure 1 Schematic description of the renewal of the intestinal epithelium and of the mathematical model for drug‐induced GI (gastrointestinal) toxicity (TOX). (a) Schematic description of homeostasis in the intestinal epithelium wherein stem cells (blue) at the base of the crypt divide asymmetrically to give rise to transit amplifying daughter cells (TADCs, pink). TADCs undergo successive rounds of cell division and differentiate into enterocytes (gray). The proliferating cells (stem cells and TADCs) and the differentiated enterocytes, respectively, occupy the crypts and the villi. (b) The process of cell division and differentiation creates a steady flux of cells from the base of the crypts to the tips of villi from which mature enterocytes are shed. The organization of the intestinal epithelium is such that between 5 and 7 crypts reside at the base of each villus and together contribute to the enterocytes in the villus. (c) Schematic of the mathematical model. There are M crypts with stem cells (SCs) that divide with rate constant k1 and daughter cells (T1,T2) that divide with rate constant k2. There are multiple rounds of TADC division leading to multiple generations of daughter cells, with the final generation differentiating into enterocytes. The finite time taken for the migration of an enterocyte from the base of the crypt to the tip of the villus is captured via the transit of enterocytes through five hypothetical transit compartments (not shown here). In the model, drug‐induced GI toxicity is captured via the effect of the plasma concentration on cell death and proliferation (red lines). The finite time taken from the initiation of cell death to actual cell loss is captured by using the transit compartments D1‐D5. PK, pharmacokinetic; SN38, the active metabolite of irinotecan.
Figure 1 Schematic description of the renewal of the intestinal epithelium and of the mathematical model for drug‐induced GI (gastrointestinal) toxicity (TOX). (a) Schematic description of homeostasis in the intestinal epithelium wherein stem cells (blue) at the base of the crypt divide asymmetrically to give rise to transit amplifying daughter cells (TADCs, pink). TADCs undergo successive rounds of cell division and differentiate into enterocytes (gray). The proliferating cells (stem cells and TADCs) and the differentiated enterocytes, respectively, occupy the crypts and the villi. (b) The process of cell division and differentiation creates a steady flux of cells from the base of the crypts to the tips of villi from which mature enterocytes are shed. The organization of the intestinal epithelium is such that between 5 and 7 crypts reside at the base of each villus and together contribute to the enterocytes in the villus. (c) Schematic of the mathematical model. There are M crypts with stem cells (SCs) that divide with rate constant k1 and daughter cells (T1,T2) that divide with rate constant k2. There are multiple rounds of TADC division leading to multiple generations of daughter cells, with the final generation differentiating into enterocytes. The finite time taken for the migration of an enterocyte from the base of the crypt to the tip of the villus is captured via the transit of enterocytes through five hypothetical transit compartments (not shown here). In the model, drug‐induced GI toxicity is captured via the effect of the plasma concentration on cell death and proliferation (red lines). The finite time taken from the initiation of cell death to actual cell loss is captured by using the transit compartments D1‐D5. PK, pharmacokinetic; SN38, the active metabolite of irinotecan.CC BY-NC · PubMed Central
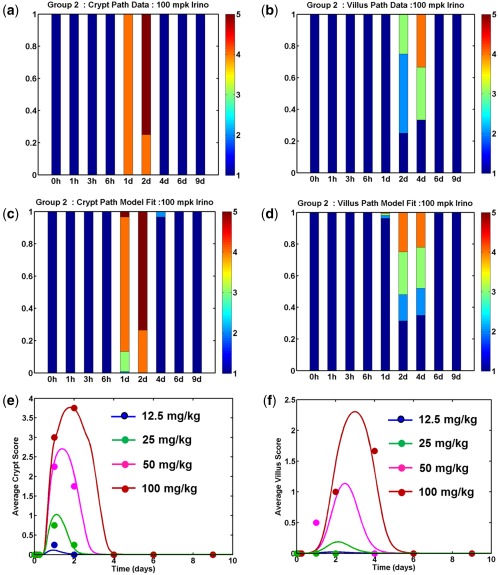
Figure 2 Model fits to rat histopathology data. Rats were given single intraperitoneal doses of irinotecan from 12.5–100 mg/kg and groups were terminated at various times following dosing to assess intestinal pathology. Data on the severity of crypt and villus pathology was fit using a mathematical model to determine the parameters for SN38‐induced toxicity. Observations (a,b) and model predictions (c,d) for the distribution of severity scores for crypt atrophy (a,c) and villus mucosal atrophy (b,d) for an irinotecan dose of 100 mg/kg. Each bar presents pathology severity scores (1 = NAD, 2 = minimal, 3 = mild, 4 = moderate, and 5 = marked) from 4–6 rats collected at that time point. Average severity scores for crypt atrophy (e) and villus atrophy (f) are plotted as a function of time for various doses. In each panel, markers represent the observed data, and the lines are model predictions.
Figure 2 Model fits to rat histopathology data. Rats were given single intraperitoneal doses of irinotecan from 12.5–100 mg/kg and groups were terminated at various times following dosing to assess intestinal pathology. Data on the severity of crypt and villus pathology was fit using a mathematical model to determine the parameters for SN38‐induced toxicity. Observations (a,b) and model predictions (c,d) for the distribution of severity scores for crypt atrophy (a,c) and villus mucosal atrophy (b,d) for an irinotecan dose of 100 mg/kg. Each bar presents pathology severity scores (1 = NAD, 2 = minimal, 3 = mild, 4 = moderate, and 5 = marked) from 4–6 rats collected at that time point. Average severity scores for crypt atrophy (e) and villus atrophy (f) are plotted as a function of time for various doses. In each panel, markers represent the observed data, and the lines are model predictions.CC BY-NC · PubMed Central
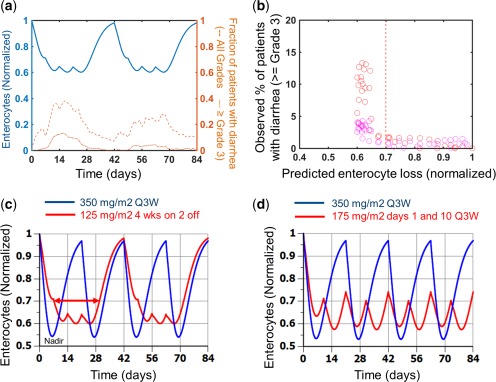
Figure 3 Model predictions of enterocyte loss for clinical schedules. (a) Model predictions of enterocyte loss for 125 mg/m2 irinotecan given as a weekly 90‐minute infusion on a 4‐week on, 2‐week off schedule for a total of 12 weeks (2 cycles; solid blue line) are compared with the incidence of all grades of diarrhea (dashed brown line) and severe diarrhea (grade ≥3; dash‐dot brown line). (b) The percentage of patients with severe (grades 3 and 4) diarrhea on each study day of the trial is plotted against model predictions of enterocyte loss for that day. (c) Comparison of enterocyte loss predictions for a 350 mg/m2 once every 3 weeks (Q3W; 1‐on/2‐off) schedule (blue line) with a 125 mg/m2 4‐on/2‐off schedule (red line). The doses used in these simulations were 325 mg/m2 and 95 mg/m2, respectively, for the blue and red lines, to account for the actual delivered dose in the clinical study. (d) Comparison of enterocyte loss predictions for a 350 mg/m2 once every 3 weeks schedule (blue line) with 175 mg/m2 delivered on days 1 and 10 on an every 3 week cycle (red line). The doses used in these simulations were 315 mg/m2 and 168 mg/m2, respectively, for the blue and red lines to account for the actual delivered dose in the clinical study. The nadir (point of maximal enterocyte loss) and the duration of time for which the enterocyte loss exceeds 30% are indicated on panel a for illustration. The blue regimens in panels c and d with less frequent dosing had lower incidence of late onset diarrhea than the red regimens.
Figure 3 Model predictions of enterocyte loss for clinical schedules. (a) Model predictions of enterocyte loss for 125 mg/m2 irinotecan given as a weekly 90‐minute infusion on a 4‐week on, 2‐week off schedule for a total of 12 weeks (2 cycles; solid blue line) are compared with the incidence of all grades of diarrhea (dashed brown line) and severe diarrhea (grade ≥3; dash‐dot brown line). (b) The percentage of patients with severe (grades 3 and 4) diarrhea on each study day of the trial is plotted against model predictions of enterocyte loss for that day. (c) Comparison of enterocyte loss predictions for a 350 mg/m2 once every 3 weeks (Q3W; 1‐on/2‐off) schedule (blue line) with a 125 mg/m2 4‐on/2‐off schedule (red line). The doses used in these simulations were 325 mg/m2 and 95 mg/m2, respectively, for the blue and red lines, to account for the actual delivered dose in the clinical study. (d) Comparison of enterocyte loss predictions for a 350 mg/m2 once every 3 weeks schedule (blue line) with 175 mg/m2 delivered on days 1 and 10 on an every 3 week cycle (red line). The doses used in these simulations were 315 mg/m2 and 168 mg/m2, respectively, for the blue and red lines to account for the actual delivered dose in the clinical study. The nadir (point of maximal enterocyte loss) and the duration of time for which the enterocyte loss exceeds 30% are indicated on panel a for illustration. The blue regimens in panels c and d with less frequent dosing had lower incidence of late onset diarrhea than the red regimens.CC BY-NC · PubMed Central
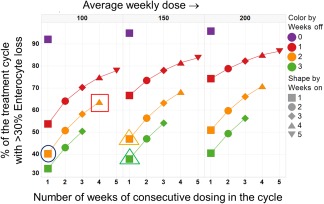
Figure 4 Simulations of enterocyte loss for various irinotecan schedules. The percentage of the treatment duration with >30% enterocyte loss is plotted for various schedules. Results are shown for 3 different average weekly dose levels of 100 mg/m2, 150 mg/m2, and 200 mg/m2. The x‐axis denotes the total number of consecutive weeks of dosing in a cycle, whereas the markers and lines within each panel are color‐coded based on the number of weeks of dose holiday within the cycle (purple = continuous, red = 1 off, orange = 2 off, and green = 3 off). As an illustration, the points encircled by a blue circle and a red square in the panels for the 100 mg/m2/week average dose, represent results for a 300 mg/m2 1 week on 2 weeks off and 150 mg/m2 4 weeks on 2 weeks off schedules. These are roughly in line with the schedules that are currently applied in Europe and the United States, respectively. The orange and green triangles in the 150 mg/m2/week panel represents results for a 450 mg/m2 1‐on/2‐off schedule and a 600 mg/m2 1‐on/3‐off schedule, respectively. The results shown here were generated by simulating the model for a duration of 12–15 weeks, as appropriate to ensure that at least 2 to 3 cycles were simulated for each schedule.
Figure 4 Simulations of enterocyte loss for various irinotecan schedules. The percentage of the treatment duration with >30% enterocyte loss is plotted for various schedules. Results are shown for 3 different average weekly dose levels of 100 mg/m2, 150 mg/m2, and 200 mg/m2. The x‐axis denotes the total number of consecutive weeks of dosing in a cycle, whereas the markers and lines within each panel are color‐coded based on the number of weeks of dose holiday within the cycle (purple = continuous, red = 1 off, orange = 2 off, and green = 3 off). As an illustration, the points encircled by a blue circle and a red square in the panels for the 100 mg/m2/week average dose, represent results for a 300 mg/m2 1 week on 2 weeks off and 150 mg/m2 4 weeks on 2 weeks off schedules. These are roughly in line with the schedules that are currently applied in Europe and the United States, respectively. The orange and green triangles in the 150 mg/m2/week panel represents results for a 450 mg/m2 1‐on/2‐off schedule and a 600 mg/m2 1‐on/3‐off schedule, respectively. The results shown here were generated by simulating the model for a duration of 12–15 weeks, as appropriate to ensure that at least 2 to 3 cycles were simulated for each schedule.CC BY-NC · PubMed Central

Verification

Claims the paper makes

The claims and statistics of this paper haven’t been checked yet.

Run the check — free, no account needed. It reads the open-access text and checks the sources it cites.

A few free checks a day · papers already verified open instantly · results are public

Self-check

Percentages, sums and reported differences re-computed from the paper’s own numbers.

The self-check needs the paper’s full text.

Citations

The citation lists haven’t been fetched yet

References 39 · Cited by 20

Research works printed but not linked: 1

  1. Hecht J.R., 1998, Gastrointestinal toxicity of irinotecan, Oncology (Williston Park), 12, 72

Metadata

Authors
Shankaran, H., Cronin, A., Barnes, J., Sharma, P., Tolsma, J., Jasper, P., & Mettetal, J. T.
Affiliations
  • AstraZeneca (United States) (US)
  • AstraZeneca (United Kingdom) (GB)
  • Renewable Energy Systems (United States) (US)
Corresponding author
Mettetal, Jerome T.
Venue
CPT: Pharmacometrics & Systems Pharmacology
Publisher
Wiley
Published
2017-12-06
Volume
7
Issue
1
Pages
26-33
ISSN
2163-8306 (ISSN-L)
OpenAlex
W2759966391
Cited by
20
References
39
Citations by year
2025: 1 · 2023: 2 · 2021: 4 · 2020: 4 · 2019: 3 · 2018: 5 · 2017: 1
FWCI
1.61
Type
journal article
Language
en
Open access
Locations
  • CPT Pharmacometrics & Systems Pharmacology (publishedVersion, cc-by-nc)
  • PubMed Central (publishedVersion, cc-by-nc)
  • PubMed (publishedVersion)
Topics
  • Life Sciences › Immunology and Microbiology › Immunology › Immunotoxicology and immune responses
  • Physical Sciences › Mathematics › Statistics and Probability › Statistical Methods in Clinical Trials
  • Health Sciences › Veterinary › Small Animals › Animal testing and alternatives
Keywords
gastrointestinal toxicity, irinotecan, dosing regimen, mathematical model, species differences, translational toxicology, stem cells, histopathology
MeSH terms
Irinotecan, Animals, Antineoplastic Agents, Dose-Response Relationship, Drug, Drug Administration Schedule, Humans, Models, Biological, Predictive Value of Tests, Species Specificity, Gastrointestinal Tract, Systems Biology, Translational Research, Biomedical, Drug-Related Side Effects and Adverse Reactions

About these checks

Registry, retraction, Cites and statistics results are computed, not judged, with one exception: a printed reference that no index lists is read once by a model before it counts as a citation error. Claims are extracted by a model and kept only when their quote appears verbatim in the text; each cited source is then checked, with a model’s help, for whether it says what the claim relies on. Those verdicts can be wrong — read the claim’s quote and the cited source before relying on one.

Statistics and arithmetic are recomputed, not judged.

Confidence bands are shown only for fields calibrated on our annotated test set. None is calibrated yet, so no band is shown.

What counts as a claim ›How we measure confidence ›How we check this ›

Are you an author, or do you see a problem with this page? Request a review

How to cite

Cite CoChat for the checks on this page, and the paper for its own findings.

This page
CoChat. (2026). Citation check: Systems Pharmacology Model of Gastrointestinal Damage Predicts Species Differences and Optimizes Clinical Dosing Schedules. https://app.cochat.ai/papers/10.1002/psp4.12255
The paper
Shankaran, H., Cronin, A., Barnes, J., Sharma, P., Tolsma, J., Jasper, P., & Mettetal, J. T. (2018). Systems Pharmacology Model of Gastrointestinal Damage Predicts Species Differences and Optimizes Clinical Dosing Schedules. CPT: Pharmacometrics & Systems Pharmacology. https://doi.org/10.1002/psp4.12255