

The DOI matches its Crossref record; 43 of the 43 references it cites were found in a registry or an index.
Assimilation of crowd‐sourced surface observations over Germany in a regional weather prediction system
Abstract
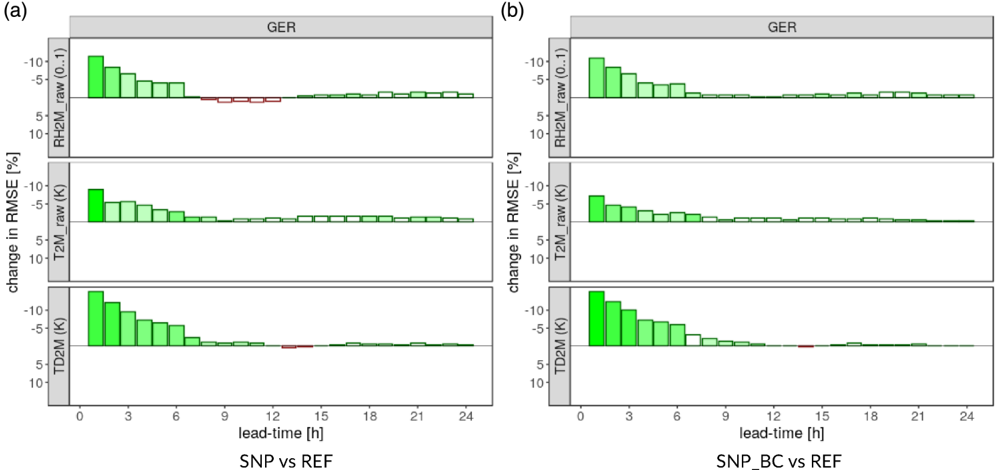
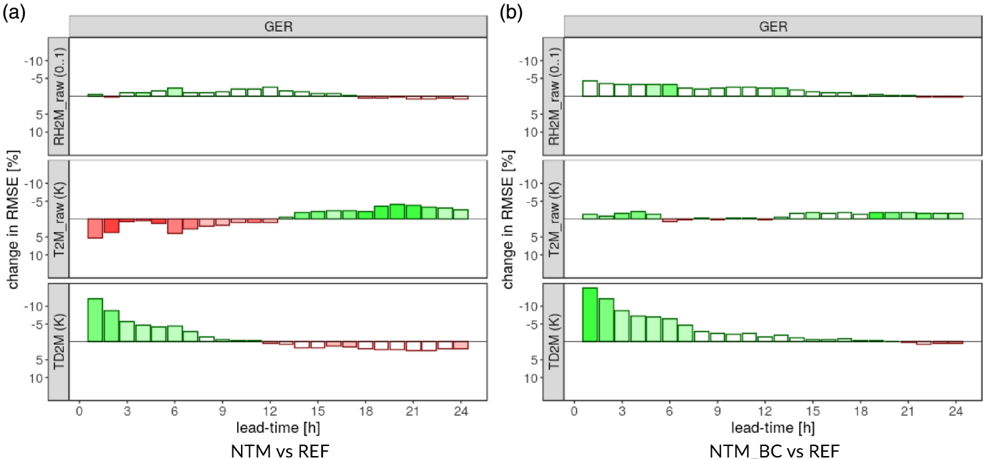
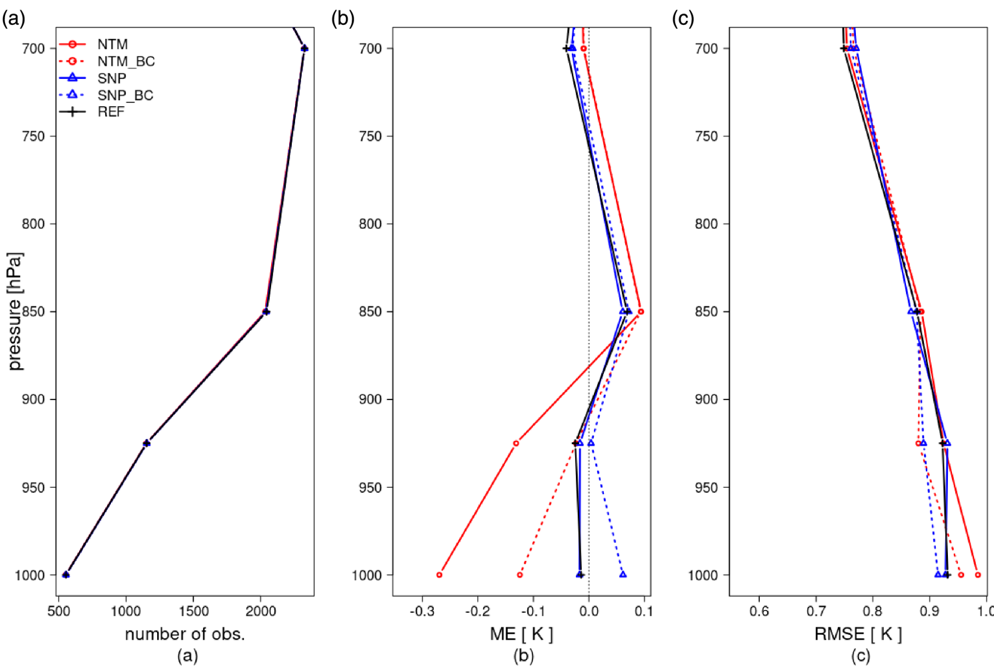
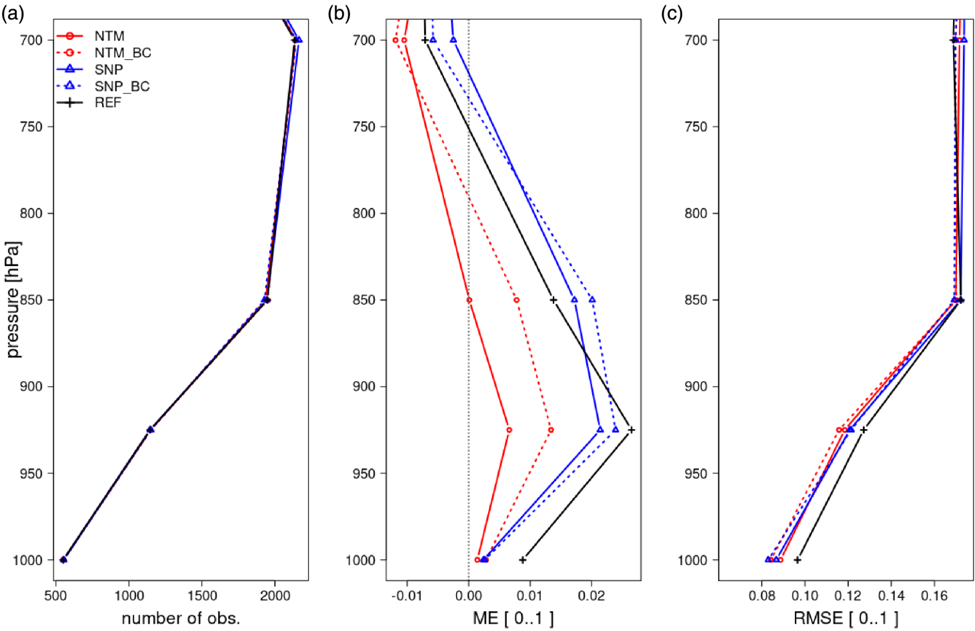
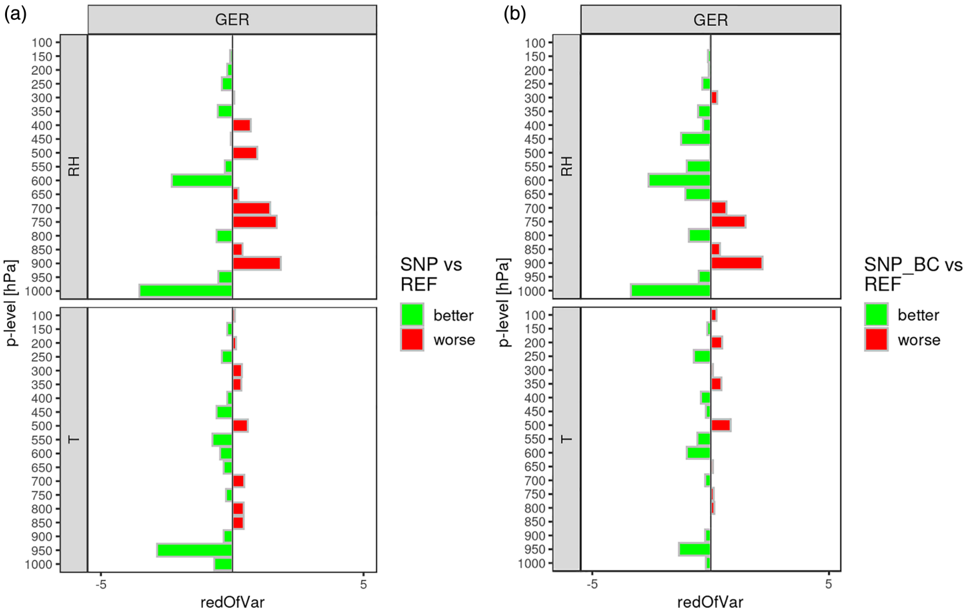
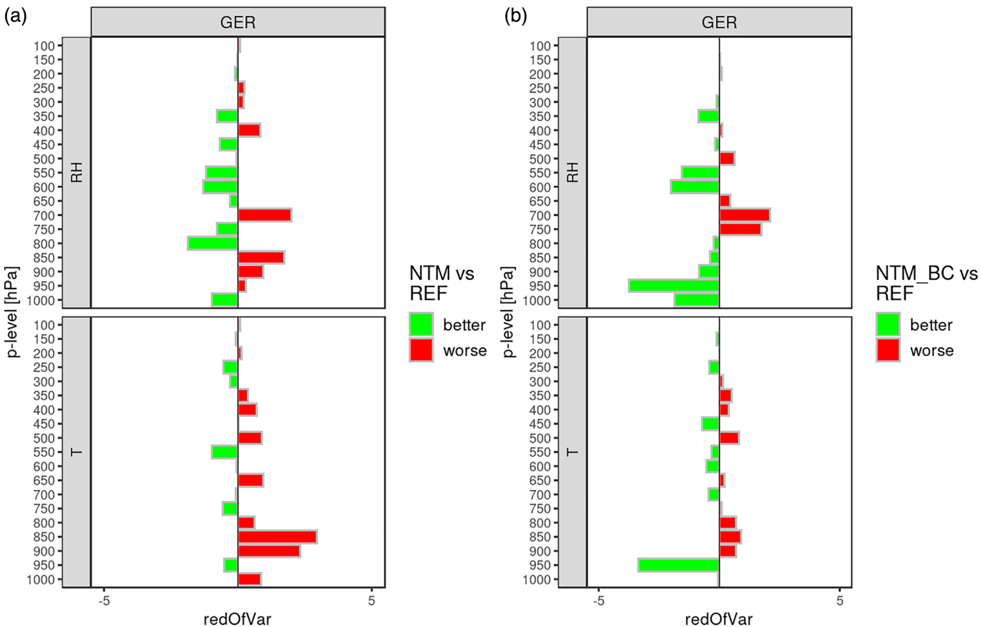
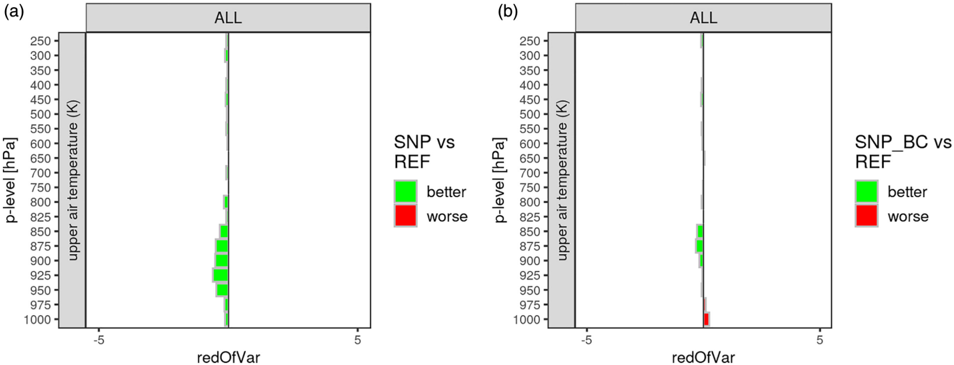
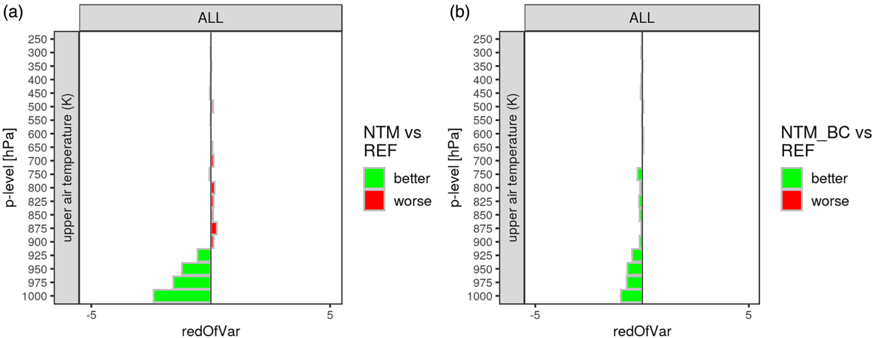
Near‐surface temperature and humidity observations over Germany, coming on the one hand from the citizen weather station's network Netatmo and on the other hand from synoptic weather stations, were assimilated into the limited are mode of the Icosahedral Nonhydrostatic Model with 2‐km resolution (ICON‐D2). For that we use the Kilometre‐Scale Ensemble Data Assimilation (KENDA) system and a bias‐correction approach that improves the assimilation of the observations by taking into account the diurnal cycle of temperature and humidity variables. Our results show that the assimilation of bias‐corrected observations from Netatmo stations reduces the forecast error considerably; meanwhile, the assimilation of Netatmo observations without bias correction leads to a strong warm bias with a negative impact on forecast performance. In contrast, for the assimilation of synoptic observations the usage of our bias‐correction approach does not lead to any significant decrease in the forecast error, yet reduces the bias for the diurnal cycle of synoptic stations. Overall, it can be concluded that the forecast quality can gain from assimilating Netatmo data, provided an effective bias‐correction approach is applied.
Overview
The claims and statistics of this paper haven’t been checked yet.
Run the check — free, no account needed. It reads the open-access text and checks the sources it cites.
Integrity signals
Registry
Cites
Statistics
Figures

Verification
Claims the paper makes
The claims and statistics of this paper haven’t been checked yet.
Run the check — free, no account needed. It reads the open-access text and checks the sources it cites.
Claims other papers make about this one
Each is checked against this paper’s own text: does it say what the citing paper says it does?
The source backs part of the claim, not all of it — or backs it for a different population, condition or comparison.
In the citing paper
“The dataset can also help refine existing weather forecast models which are currently mostly based on official rural observations (Sgoff et al., 2022).”
From Quality control and correction method for air temperature data from a citizen science weather station network in Leuven, Belgium (2022) · cites this paper as Sgoff et al., 2022
Experimental — accuracy not yet measured
Self-check
Percentages, sums and reported differences re-computed from the paper’s own numbers.
The self-check needs the paper’s full text.
Citations
Cites
Mlawer, E. J., Taubman, S. J., Brown, P. D., Iacono, M. J., & Clough, S. A. (1997) · Journal of Geophysical Research: Atmospheres · doi:10.1029/97jd00237 · Cited by 8,419
Construction of correlation functions in two and three dimensions
Gaspari, G., & Cohn, S. E. (1999) · Quarterly Journal of the Royal Meteorological Society · doi:10.1002/qj.49712555417 · Cited by 1,965
Efficient data assimilation for spatiotemporal chaos: A local ensemble transform Kalman filter
Hunt, B. R., Kostelich, E. J., & Szunyogh, I. (2007) · Physica D: Nonlinear Phenomena · doi:10.1016/j.physd.2006.11.008 · Cited by 1,742
Anderson, J. G., & Anderson, S. L. (1999) · Monthly Weather Review · Cited by 1,042
Zängl, G., Reinert, D., Rípodas, P., & Baldauf, M. (2015) · Quarterly Journal of the Royal Meteorological Society · doi:10.1002/qj.2378 · Cited by 950
The credibility of volunteered geographic information
Flanagin, A. J., & Metzger, M. J. (2008) · GeoJournal · doi:10.1007/s10708-008-9188-y · Cited by 751
Zhang, F., Snyder, C., & Sun, J. (2004) · Monthly Weather Review · doi:10.1175/1520-0493(2004)132<1238:ioieao>2.0.co;2 · Cited by 580
Crowdsourcing for climate and atmospheric sciences: current status and future potential
Muller, C. L., Chapman, L., Johnston, S., Kidd, C., Illingworth, S., Foody, G., Overeem, A., & Leigh, R. R. (2015) · International Journal of Climatology · doi:10.1002/joc.4210 · Cited by 372
Crowdsourcing: A Review and Suggestions for Future Research
Ghezzi, A., Gabelloni, D., Martini, A., & Natalicchio, A. (2018) · International Journal of Management Reviews · doi:10.1111/ijmr.12135 · Cited by 353
Steeneveld, G. J., Koopmans, S., Heusinkveld, B. G., van Hove, L. W. A., & Holtslag, A. A. M. (2011) · Journal of Geophysical Research · doi:10.1029/2011jd015988 · Cited by 330
Crowdsourcing air temperature from citizen weather stations for urban climate research
Meier, F., Fenner, D., Grassmann, T., Otto, M., & Scherer, D. (2017) · Urban Climate · doi:10.1016/j.uclim.2017.01.006 · Cited by 272
Kilometre‐scale ensemble data assimilation for the COSMO model (KENDA)
Schraff, C., Reich, H., Rhodin, A., Schomburg, A., Stephan, K. M., Periáñez, Á., & Potthast, R. (2016) · Quarterly Journal of the Royal Meteorological Society · doi:10.1002/qj.2748 · Cited by 241
Self-citationAssimilation of radar‐derived rain rates into the convective‐scale model COSMO‐DE at DWD
Stephan, K. M., Klink, S., & Schraff, C. (2008) · Quarterly Journal of the Royal Meteorological Society · doi:10.1002/qj.269 · Cited by 202
Chapman, L., Bell, C., & Bell, S. (2016) · International Journal of Climatology · doi:10.1002/joc.4940 · Cited by 192
Comparing the Quality of Crowdsourced Data Contributed by Expert and Non-Experts
See, L., Comber, A., Salk, C. F., Fritz, S., van der Velde, M., Perger, C., Schill, C., McCallum, I., Kraxner, F., & Obersteiner, M. H. (2013) · PLoS ONE · doi:10.1371/journal.pone.0069958 · Cited by 191
Fenner, D., Meier, F., Bechtel, B., Otto, M., & Scherer, D. (2017) · Meteorologische Zeitschrift · doi:10.1127/metz/2017/0861 · Cited by 190
Quality Control for Crowdsourced Personal Weather Stations to Enable Operational Rainfall Monitoring
de Vos, L. W., Leijnse, H., Overeem, A., & Uijlenhoet, R. (2019) · Geophysical Research Letters · doi:10.1029/2019gl083731 · Cited by 141
The potential of urban rainfall monitoring with crowdsourced automatic weather stations in Amsterdam
de Vos, L. W., Leijnse, H., Overeem, A., & Uijlenhoet, R. (2017) · Hydrology and earth system sciences · doi:10.5194/hess-21-765-2017 · Cited by 138
Foody, G. M., See, L., Fritz, S., van der Velde, M., Perger, C., Schill, C., & Boyd, D. S. (2013) · Transactions in GIS · doi:10.1111/tgis.12033 · Cited by 137
How good are citizen weather stations? Addressing a biased opinion
Bell, S., Cornford, D., & Bastin, L. (2015) · Weather · doi:10.1002/wea.2316 · Cited by 129
Estimation of rainfall fields using commercial microwave communication networks of variable density
Zinevich, A., Alpert, P., & Messer, H. (2008) · Advances in Water Resources · doi:10.1016/j.advwatres.2008.03.003 · Cited by 118
Adopting Citizen Observations in Operational Weather Prediction
Nipen, T. N., Seierstad, I. A., Lussana, C., Kristiansen, J., & Hov, Ø. (2019) · Bulletin of the American Meteorological Society · doi:10.1175/bams-d-18-0237.1 · Cited by 103
de Haan, S. (2011) · Journal of Geophysical Research Atmospheres · doi:10.1029/2010jd015264 · Cited by 94
The state of automated amateur weather observations
Bell, S., Cornford, D., & Bastin, L. (2013) · Weather · doi:10.1002/wea.1980 · Cited by 87
Eyre, J. R. (2016) · Quarterly Journal of the Royal Meteorological Society · doi:10.1002/qj.2819 · Cited by 85
Wolters, D., & Brandsma, T. (2012) · Journal of Applied Meteorology and Climatology · doi:10.1175/jamc-d-11-0135.1 · Cited by 74
Systematic Differences in Aircraft and Radiosonde Temperatures
Ballish, B. A., & Kumar, V. K. (2008) · Bulletin of the American Meteorological Society · doi:10.1175/2008bams2332.1 · Cited by 72
James, E. P., & Benjamin, S. G. (2017) · Monthly Weather Review · doi:10.1175/mwr-d-16-0398.1 · Cited by 70
Sobash, R. A., & Stensrud, D. J. (2015) · Monthly Weather Review · doi:10.1175/mwr-d-14-00126.1 · Cited by 45
Nonlinear Bias Correction for Satellite Data Assimilation Using Taylor Series Polynomials
Otkin, J. A., Potthast, R., & Lawless, A. S. (2017) · Monthly Weather Review · doi:10.1175/mwr-d-17-0171.1 · Cited by 45
Self-citationAutomatic processing, quality assurance and serving of real-time weather data
Williams, M., Cornford, D., Bastin, L., Jones, R. L., & Parker, S. (2010) · Computers & Geosciences · doi:10.1016/j.cageo.2010.05.010 · Cited by 43
Utility of Dense Pressure Observations for Improving Mesoscale Analyses and Forecasts
Madaus, L. E., Hakim, G. J., & Mass, C. F. (2014) · Monthly Weather Review · doi:10.1175/mwr-d-13-00269.1 · Cited by 40
Fine‐scale analysis of a severe hailstorm using crowd‐sourced and conventional observations
Clark, M. R., Webb, J. D. C., & Kirk, P. J. (2018) · Meteorological Applications · doi:10.1002/met.1715 · Cited by 35
Evolution and Accuracy of Surface Humidity Reports*
Ingleby, B., Moore, D. M., Sloan, C., & Dunn, R. (2013) · Journal of Atmospheric and Oceanic Technology · doi:10.1175/jtech-d-12-00232.1 · Cited by 25
Gasperoni, N. A., Wang, X., Brewster, K. A., & Carr, F. H. (2018) · Monthly Weather Review · doi:10.1175/mwr-d-18-0177.1 · Cited by 20
From Observations to Forecasts – Part 12: Getting the most out of model data
Moseley, S. (2011) · Weather · doi:10.1002/wea.844 · Cited by 18
Lussana, C., Seierstad, I. A., Nipen, T. N., & Cantarello, L. (2019) · Quarterly Journal of the Royal Meteorological Society · doi:10.1002/qj.3646 · Cited by 14
The cities weather forecasting by crowdsourced atmospheric data
Uteuov, A., Kalyuzhnaya, A. V., & Boukhanovsky, A. V. (2019) · Procedia Computer Science · doi:10.1016/j.procs.2019.08.211 · Cited by 13
Hintz, K. S., McNicholas, C., Randriamampianina, R., Williams, H. T. P., Macpherson, B., Mittermaier, M., Onvlee, J., & Szintai, B. (2021) · Atmospheric Science Letters · doi:10.1002/asl.1031 · Cited by 10
de Haan, S., de Jong, P. M. A., & van der Meulen, J. P. (2022) · Atmospheric measurement techniques · doi:10.5194/amt-15-811-2022 · Cited by 8
Quantifying uncertainty in citizen weather data
Bell, S. (2015) · Aston Publications Explorer (Aston University) · doi:10.48780/publications.aston.ac.uk.00026693 · Cited by 6
Programming of numerical algorithms and useful tools
Nakamura, G., & Potthast, R. (2015) · Institute of Physics eBooks · doi:10.1088/978-0-7503-1218-9ch6 · Cited by 1
Self-citation(2003) · doi:10.1175/1520-0442(2003)016
Research works printed but not linked: 7
- 10.1175/1520-0493(1999)127<2741:AMCIOT>2.0.CO;2 · doi:10.1175/1520-0493(1999)127
- Meier F., 2015, ICUC9 – 9th International Conference on Urban Climate jointly with 12th Symposium on the Urban Environment Challenges
- MetOffice, 2021, Weather Observations Website – WOW
- Netatmo, 2021, Netatmo Website
- Tostrams L.(2017)Spatio‐temporal analysis and error correction of consumer weather station data. PhD thesis Nijmegen Radbound University.
- US National Weather Service, 2021, Citizen Weather Observer Program
- Zahumenský I., 2017, Guidelines on quality control procedures for data from automatic weather stations, World Meteorological Organization
Cited by
Beele, E., Reyniers, M., Aerts, R., & Somers, B. (2022) · Earth System Science Data Discussions · doi:10.5194/essd-2022-113 · Cited by 44
Metadata
- Authors
- Sgoff, C., Acevedo, W., Paschalidi, Z., Ulbrich, S., Bauernschubert, E., Kratzsch, T., & Potthast, R.
- Affiliations
- Data Assimilation Deutscher Wetterdienst Offenbach Germany
- ORCID
- Sgoff, Christine
- Venue
- Quarterly Journal of the Royal Meteorological Society
- Publisher
- Wiley
- Published
- 2022-04
- Volume
- 148
- Issue
- 745
- Pages
- 1752-1767
- ISSN
- 0035-9009
- 1477-870X
- Cited by
- 18
- References
- 43
- Language
- en
- Funders
- Bundesministerium für Verkehr und Digitale Infrastruktur (19F2045B, 0350004B)
About these checks
Registry, retraction, Cites and statistics results are computed, not judged, with one exception: a printed reference that no index lists is read once by a model before it counts as a citation error. Claims are extracted by a model and kept only when their quote appears verbatim in the text; each cited source is then checked, with a model’s help, for whether it says what the claim relies on. Those verdicts can be wrong — read the claim’s quote and the cited source before relying on one.
Statistics and arithmetic are recomputed, not judged.
Confidence bands are shown only for fields calibrated on our annotated test set. None is calibrated yet, so no band is shown.
What counts as a claim ›How we measure confidence ›How we check this ›
Are you an author, or do you see a problem with this page? Request a review
Data sources
Bibliographic data: Semantic Scholar, OpenAlex, Crossref.
Contains information from the Semantic Scholar Academic Graph Datasets, made available under the ODC Attribution License (ODC-BY 1.0).
Semantic Scholar’s data is described in: Kinney, R., et al. (2023). The Semantic Scholar Open Data Platform. arXiv:2301.10140.
