Cited by 30

The DOI matches its Crossref record.

FluorMango, an RNA-based fluorogenic biosensor for the direct and specific detection of fluoride

Husser, Claire, Vuilleumier, Stéphane, Ryckelynck, Michael·2023·Small

Abstract

Nucleic acids are not only essential actors of cell life but also extremely appealing molecular objects in the development of synthetic molecules for biotechnological application, such as biosensors to report on the presence and concentration of a target ligand by emission of a measurable signal. In this work, FluorMango, a fluorogenic ribonucleic acid (RNA)‐based biosensor specific for fluoride is introduced. The molecule consists of two RNA aptamer modules, a fluoride‐specific sensor derived from the crcB riboswitch which changes its structure upon interaction with the target ion, and the light‐up RNA Mango‐III that emits fluorescence when complexed with a fluorogen. The two modules are connected by an optimized communication module identified by ultrahigh‐throughput screening, which results in extremely high fluorescence of FluorMango in the presence of fluoride, and background fluorescence in its absence. The value and efficiency of this biosensor by direct monitoring of defluorinase activity in living bacterial cells is illustrated, and the use of this new tool in future screening campaigns aiming at discovering new defluorinase activities is discussed.

Overview

The claims and statistics of this paper haven’t been checked yet.

Run the check — free, no account needed. It reads the open-access text and checks the sources it cites.

A few free checks a day · papers already verified open instantly · results are public

Integrity signals

Registry

Crossref · 10.1002/smll.202205232

Cites

Statistics

Figures

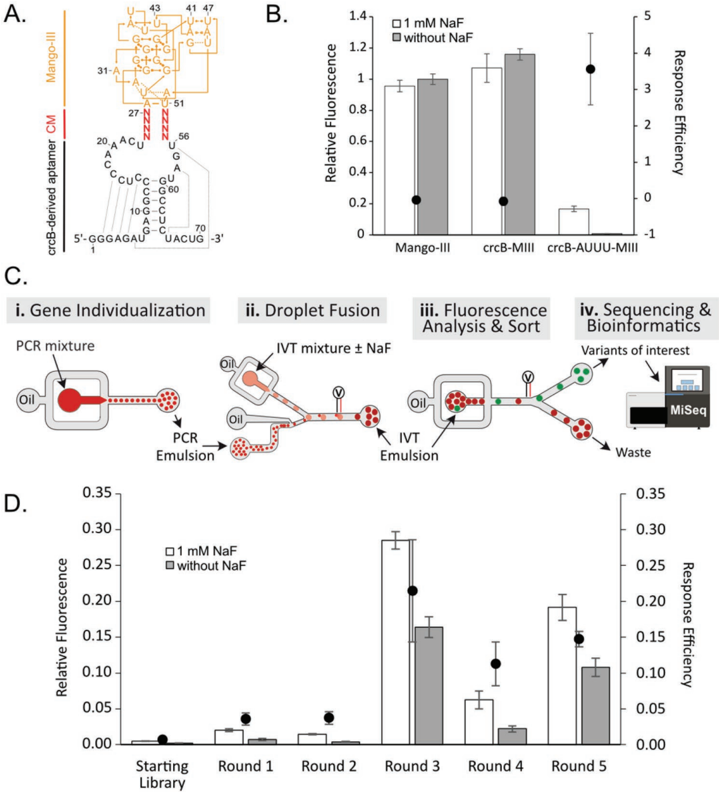
Figure 1 Selection of an RNA-based fluoride biosensor from a randomized library using µ IVC-Seq. A) Secondary structure of the starting library. A crcB-derived RNA aptamer (black) was fused to the Mango-III aptamer (orange) by two stretches of four randomized nucleotides (red Ns), some of which were expected to behave as communication modules (CM). Base paires are represented according to Leontis-Westhof classification. [47] B) Impact of fluoride on the fluorescence of Mango-III and its derivatives. Purified RNAs were incubated with (white bars) or without (gray bars) 1 mm sodium fluoride (NaF) prior to measuring the fluorescence of the RNA/TO1-biotin complex and normalizing it to that of Mango-III/TO1-biotin in the absence of fluoride. Response efficiency (dots) was calculated as described in the Experimental Section. Values are the mean of three independent experiments, and error bars correspond to ± 1 standard deviation. C) µ IVC-seq screening strategy. The different libraries were screened in a four-step process as follows: C-i) genes diluted into a PCR mixture were individualized in water-in-oil droplets prior to PCR amplification. C-ii) An in vitro transcription medium (IVT) containing the fluorogen (TO1-biotin) and supplemented or not with NaF was added to each PCR-amplified droplet by droplet fusion. C-iii) Upon gene transcription, droplets of interest were sorted according to their fluorescence. C-iv) Last, the sequences recovered after each round of screening were determined by next generation sequencing (NGS) and bioinformatics. D) Functional validation of the rounds of screening. Libraries were in vitro transcribed in the presence of TO1-biotin and in the presence or not of NaF, and fluorescence was measured and normalized by that of Mango-III in the absence of fluoride. Response efficiency of each library (dots) was calculated. Values are the mean of three independent experiments, and error bars correspond to ± 1 standard deviation.
Figure 1 Selection of an RNA-based fluoride biosensor from a randomized library using µ IVC-Seq. A) Secondary structure of the starting library. A crcB-derived RNA aptamer (black) was fused to the Mango-III aptamer (orange) by two stretches of four randomized nucleotides (red Ns), some of which were expected to behave as communication modules (CM). Base paires are represented according to Leontis-Westhof classification. [47] B) Impact of fluoride on the fluorescence of Mango-III and its derivatives. Purified RNAs were incubated with (white bars) or without (gray bars) 1 mm sodium fluoride (NaF) prior to measuring the fluorescence of the RNA/TO1-biotin complex and normalizing it to that of Mango-III/TO1-biotin in the absence of fluoride. Response efficiency (dots) was calculated as described in the Experimental Section. Values are the mean of three independent experiments, and error bars correspond to ± 1 standard deviation. C) µ IVC-seq screening strategy. The different libraries were screened in a four-step process as follows: C-i) genes diluted into a PCR mixture were individualized in water-in-oil droplets prior to PCR amplification. C-ii) An in vitro transcription medium (IVT) containing the fluorogen (TO1-biotin) and supplemented or not with NaF was added to each PCR-amplified droplet by droplet fusion. C-iii) Upon gene transcription, droplets of interest were sorted according to their fluorescence. C-iv) Last, the sequences recovered after each round of screening were determined by next generation sequencing (NGS) and bioinformatics. D) Functional validation of the rounds of screening. Libraries were in vitro transcribed in the presence of TO1-biotin and in the presence or not of NaF, and fluorescence was measured and normalized by that of Mango-III in the absence of fluoride. Response efficiency of each library (dots) was calculated. Values are the mean of three independent experiments, and error bars correspond to ± 1 standard deviation.CC-BY · From the PDF
Image 2
CC-BY · From the PDF
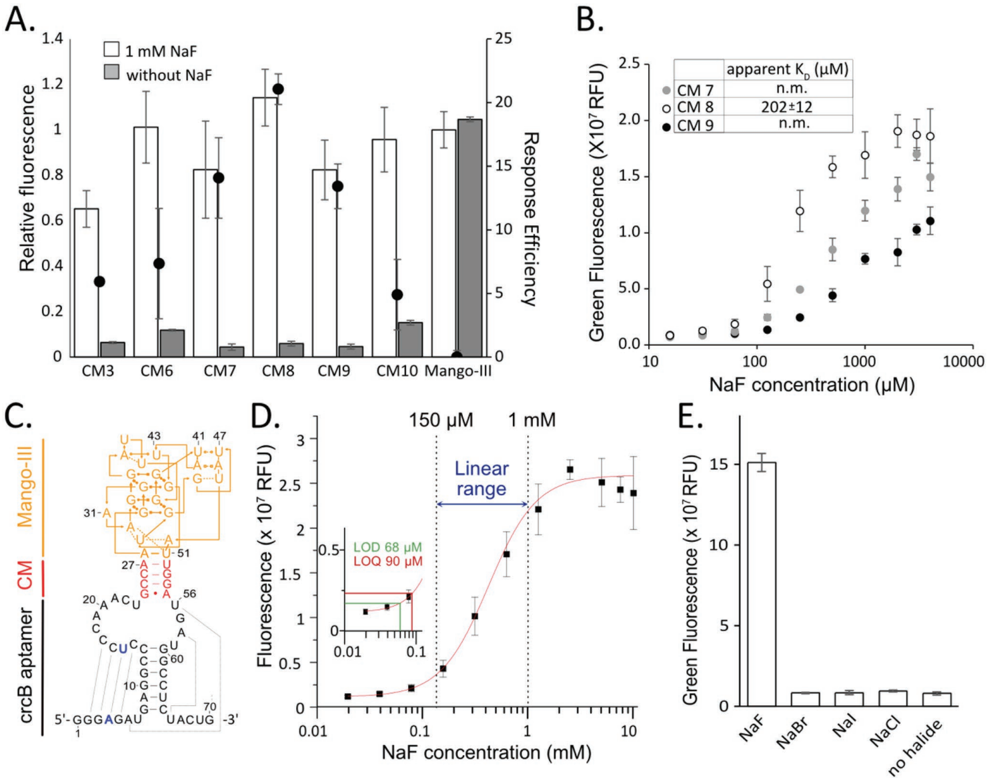
Figure 2 Identification and functional characterization of fluoride biosensors. A) Response of purified RNAs to fluoride. The most promising RNAs identified by bioinformatic analysis were produced by in vitro transcription and purified. 400 nm of RNA was then incubated with 700 nm TO1-biotin in the presence (white bars) or absence (gray bars) of 1 mm sodium fluoride (NaF). After 60 min, green fluorescence of the RNA/TO1-biotin complex was measured and normalized to that of Mango-III/TO1-biotin in the absence of fluoride. Response efficiency was calculated as described in the Experimental Section. Values are the mean of three independent experiments, and error bars correspond to ± 1 standard deviation. Sequences of the communication modules of tested variants are provided in Table S1, Supporting Information. B) Determination of the apparent dissociation constant ( K D) of three RNA candidates. Purified RNAs were incubated with a range of NaF concentrations, and fluorescence of the RNA/TO1-biotin complex was measured. The K D value was calculated by fitting the data to a Hill equation when possible. Non-measurable (n.m.) values are also indicated. C) Secondary structure of the fluoride RNA-based biosensor FluorMango (CM8). The selected communication module (CM) sequence is shown in red, the reporter module Mango-III in orange, and the sensor module crcB aptamer in black. Positions mutated to improve the transcription rate that preserves the formation of the pseudoknot are shown in blue. D) Fluoride detection by FluorMango. Limit of detection (LOD), limit of quantification (LOQ), and linear range of fluoride detection by FluorMango were determined as described elsewhere. [36] 400 nm of RNA was incubated in the presence of a range of NaF concentrations prior to measuring fluorescence of RNA/TO1-biotin complex. Values are the mean of seven (no NaF) or three (other NaF concentrations) independent experiments, and error bars correspond to ± 1 standard deviation. LOD was derived from three times the standard deviation, and LOQ from ten times the standard deviation. E) Specificity of FluorMango. 400 nm of purified RNAs was incubated with 1 mm of the specified halide, and fluorescence of the FluorMango/TO1-biotin complex was measured. Values are the mean of three independent experiments, and error bars correspond to ± 1 standard deviation.
Figure 2 Identification and functional characterization of fluoride biosensors. A) Response of purified RNAs to fluoride. The most promising RNAs identified by bioinformatic analysis were produced by in vitro transcription and purified. 400 nm of RNA was then incubated with 700 nm TO1-biotin in the presence (white bars) or absence (gray bars) of 1 mm sodium fluoride (NaF). After 60 min, green fluorescence of the RNA/TO1-biotin complex was measured and normalized to that of Mango-III/TO1-biotin in the absence of fluoride. Response efficiency was calculated as described in the Experimental Section. Values are the mean of three independent experiments, and error bars correspond to ± 1 standard deviation. Sequences of the communication modules of tested variants are provided in Table S1, Supporting Information. B) Determination of the apparent dissociation constant ( K D) of three RNA candidates. Purified RNAs were incubated with a range of NaF concentrations, and fluorescence of the RNA/TO1-biotin complex was measured. The K D value was calculated by fitting the data to a Hill equation when possible. Non-measurable (n.m.) values are also indicated. C) Secondary structure of the fluoride RNA-based biosensor FluorMango (CM8). The selected communication module (CM) sequence is shown in red, the reporter module Mango-III in orange, and the sensor module crcB aptamer in black. Positions mutated to improve the transcription rate that preserves the formation of the pseudoknot are shown in blue. D) Fluoride detection by FluorMango. Limit of detection (LOD), limit of quantification (LOQ), and linear range of fluoride detection by FluorMango were determined as described elsewhere. [36] 400 nm of RNA was incubated in the presence of a range of NaF concentrations prior to measuring fluorescence of RNA/TO1-biotin complex. Values are the mean of seven (no NaF) or three (other NaF concentrations) independent experiments, and error bars correspond to ± 1 standard deviation. LOD was derived from three times the standard deviation, and LOQ from ten times the standard deviation. E) Specificity of FluorMango. 400 nm of purified RNAs was incubated with 1 mm of the specified halide, and fluorescence of the FluorMango/TO1-biotin complex was measured. Values are the mean of three independent experiments, and error bars correspond to ± 1 standard deviation.CC-BY · From the PDF
Image 4
CC-BY · From the PDF
Image 5
CC-BY · From the PDF
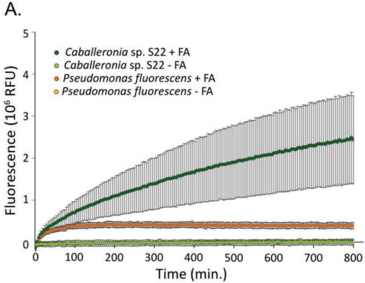
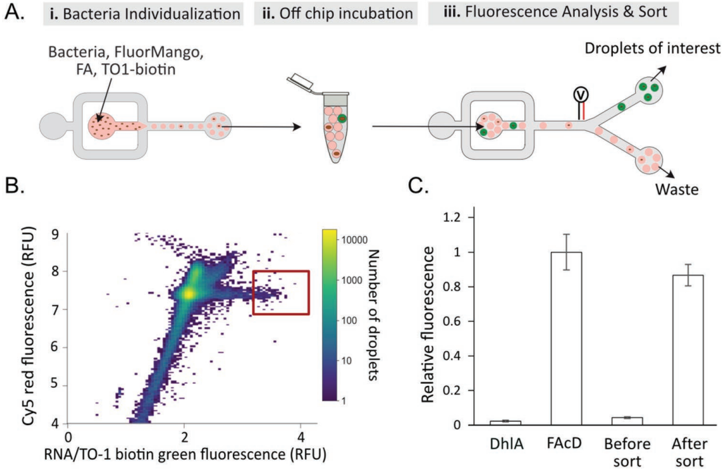
Figure 4 Screening of bacteria for defluorinase activity. A) Microfluidic screening strategy. A mixed bacterial population (1 FAcD for 99 DhlA producing strains) was screened in a three-step process as follows: A-i) bacteria were diluted into a refolding buffer supplemented with 1 mg mL -1 sodium fluoroacetate, purified RNA FluorMango, TO1-biotin, and proteinase K individualized in water-in-oil droplets. A-ii) The emulsion was incubated off-chip at 30 ° C prior to A-iii) sorting droplets according to their fluorescence. B) Fluorescence profile of droplets analyzed during the screening. Green fluorescence of RNA/TO1-biotin complex and Cy5 red fluorescence (droplet tracer) were measured, and droplets containing elevated green fluorescence (so high fluoride concentration) were sorted (red box). C) Validation of the round of screening. Plasmids were extracted from sorted and unsorted bacteria and used to transform E. coli . The same number of cells was incubated in PBS supplemented with refolding buffer in the presence of FluorMango, TO1biotin, proteinase K, and 1 mg mL -1 fluoroacetate. Fluoride production was monitored in real time for 12 h at 28 ° C in a microtiter plate. The fluorescence appearance rate of the RNA/TO1-biotin complex was normalized to that of a control condition with a strain transformed by pure FAcD-coding plasmid.
Figure 4 Screening of bacteria for defluorinase activity. A) Microfluidic screening strategy. A mixed bacterial population (1 FAcD for 99 DhlA producing strains) was screened in a three-step process as follows: A-i) bacteria were diluted into a refolding buffer supplemented with 1 mg mL -1 sodium fluoroacetate, purified RNA FluorMango, TO1-biotin, and proteinase K individualized in water-in-oil droplets. A-ii) The emulsion was incubated off-chip at 30 ° C prior to A-iii) sorting droplets according to their fluorescence. B) Fluorescence profile of droplets analyzed during the screening. Green fluorescence of RNA/TO1-biotin complex and Cy5 red fluorescence (droplet tracer) were measured, and droplets containing elevated green fluorescence (so high fluoride concentration) were sorted (red box). C) Validation of the round of screening. Plasmids were extracted from sorted and unsorted bacteria and used to transform E. coli . The same number of cells was incubated in PBS supplemented with refolding buffer in the presence of FluorMango, TO1biotin, proteinase K, and 1 mg mL -1 fluoroacetate. Fluoride production was monitored in real time for 12 h at 28 ° C in a microtiter plate. The fluorescence appearance rate of the RNA/TO1-biotin complex was normalized to that of a control condition with a strain transformed by pure FAcD-coding plasmid.CC-BY · From the PDF
Image 7
CC-BY · From the PDF

Verification

Claims the paper makes

The claims and statistics of this paper haven’t been checked yet.

Run the check — free, no account needed. It reads the open-access text and checks the sources it cites.

A few free checks a day · papers already verified open instantly · results are public

Claims other papers make about this one

Each is checked against this paper’s own text: does it say what the citing paper says it does?

Self-check

Percentages, sums and reported differences re-computed from the paper’s own numbers.

The self-check needs the paper’s full text.

Citations

Cites

No references could be resolved yet.

Research works printed but not linked: 47

  1. 10.1002/sstr.202000132 · DOI
  2. 10.1016/j.bbagrm.2020.194501 · DOI
  3. 10.1039/D0CS00617C · DOI
  4. Ariza‐Mateos A., 2021, Biochemistry, 86, 962
  5. 10.1039/D1CB00138H · DOI
  6. 10.1016/j.jmb.2022.167631 · DOI
  7. 10.1016/j.copbio.2019.11.008 · DOI
  8. 10.1038/s41545-020-0064-8 · DOI
  9. 10.2174/092986710791698503 · DOI
  10. 10.1002/etc.4890 · DOI · Paper page
  11. 10.1186/s13765-019-0469-6 · DOI · Paper page
  12. 10.1016/j.tibtech.2022.06.006 · DOI
  13. 10.1126/science.154.3756.1553 · DOI
  14. 10.1128/mBio.03001-21 · DOI · Paper page
  15. 10.1128/aem.00288-22 · DOI
  16. 10.3389/fchem.2021.666450 · DOI
  17. 10.7150/thno.9860 · DOI
  18. 10.1016/j.dyepig.2022.110200 · DOI
  19. 10.1039/D1RA08037G · DOI
  20. 10.1126/science.1215063 · DOI · Paper page
  21. 10.1038/nature11152 · DOI · Paper page
  22. 10.1021/acssynbio.9b00347 · DOI
  23. 10.1093/nar/gkaa673 · DOI
  24. 10.1039/D1SC03508H · DOI
  25. 10.1007/978-1-0716-0712-1_5 · DOI
  26. 10.3390/ijms19010044 · DOI
  27. 10.1039/C9AN01825E · DOI
  28. 10.1039/C9TB02668A · DOI
  29. 10.1073/pnas.1504354112 · DOI
  30. 10.1126/science.1218298 · DOI
  31. 10.1038/s41467-018-02993-8 · DOI
  32. 10.1038/s41589-019-0267-9 · DOI
  33. 10.1038/nsmb.3316 · DOI
  34. 10.1016/j.ymeth.2019.03.015 · DOI
  35. 10.1007/978-1-0716-1386-3_17 · DOI
  36. 10.3390/chemosensors9110299 · DOI
  37. 10.1186/s40104-017-0180-6 · DOI
  38. 10.1007/s10529-008-9849-4 · DOI · Paper page
  39. 10.1016/S1381-1177(03)00098-5 · DOI · Paper page
  40. 10.1128/jb.171.12.6791-6799.1989 · DOI
  41. 10.1021/acsomega.2c00248 · DOI
  42. M. A.Boyd W.Thavarajah J. B.Lucks N. P.Kamat. bioRxiv https://doi.org/10.1101/2022.03.02.482665. · DOI
  43. 10.1002/cbic.202200006 · DOI
  44. 10.1039/C8CC08796B · DOI
  45. 10.1038/s41467-017-00425-7 · DOI
  46. 10.1261/rna.048033.114 · DOI
  47. 10.1017/S1355838201002515 · DOI

Cited by

Sorted by citations

Metadata

Authors
Husser, C., Vuilleumier, S., & Ryckelynck, M.
Affiliations
  • CNRS, Architecture et Réactivité de l'ARN Université de Strasbourg UPR 9002, 2 allée Konrad Roentgen Strasbourg 67000 France
  • CNRS, Génétique Moléculaire, Génomique, Microbiologie Université de Strasbourg UMR 7156, 4 allée Konrad Roentgen Strasbourg 67000 France
Venue
Small
Publisher
Wiley
Published
2022-11-27
Volume
19
Issue
13
ISSN
  • 1613-6810
  • 1613-6829
Cited by
30
References
0
Language
en
Funders
  • Agence Nationale de la Recherche (ANR‐17‐CE07‐0009)
  • Centre National de la Recherche Scientifique
  • Université de Strasbourg

About these checks

Registry, retraction, Cites and statistics results are computed, not judged, with one exception: a printed reference that no index lists is read once by a model before it counts as a citation error. Claims are extracted by a model and kept only when their quote appears verbatim in the text; each cited source is then checked, with a model’s help, for whether it says what the claim relies on. Those verdicts can be wrong — read the claim’s quote and the cited source before relying on one.

Statistics and arithmetic are recomputed, not judged.

Confidence bands are shown only for fields calibrated on our annotated test set. None is calibrated yet, so no band is shown.

What counts as a claim ›How we measure confidence ›How we check this ›

Are you an author, or do you see a problem with this page? Request a review