Student or educator? Sign up with your school email and get 6 months of Pro free.
CoChat

The DOI matches its Crossref record; the references it cites are not checked yet.

Quickly “learning” to move optimally

Open access
Brenner, Eli, Smeets, Jeroen B. J. · 2011 · Experimental Brain Research

Abstract

People take account of the variability in their movements in a near-optimal manner in various visuo-motor tasks. Is knowledge of one's variability needed for such near-optimal performance, or could it arise from responding to one's success in previous attempts in some simple manner? We asked subjects to move a pen back and forth across a tablet to make a cursor move as quickly as possible between two targets. The cursor had to stop within the targets. Task difficulty was varied between blocks. Part of the variation in difficulty was explicit (three target sizes) whereas the rest had to be discovered during the movements (two mappings between the movements of pen and cursor). In all cases, subjects sped up after stopping within a target and slowed down after failing to do so. We interpret this as evidence that explicit knowledge of one's variability is not necessary for performing close to optimally.

Overview

The claims and statistics of this paper haven’t been checked yet.

Free: it reads the open-access text and checks the first 5 claims that cite a source we can check. Create a free account to check every claim.

A few free checks a day · papers already verified open instantly · results are public

Integrity signals

Registry

Crossref · 10.1007/s00221-011-2786-9

Cites

Statistics

Figures

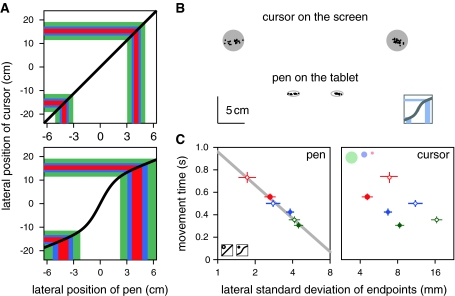
Fig. 1 Variation on Fernandez and Bootsma’s (2004) rapid pointing task, in which subjects had to move a cursor back and forth as quickly as possible between two targets by moving a pen across a graphics tablet. a Two mappings between the horizontal coordinates of pen and cursor. Normally, motion of the cursor is a linearly scaled version of that of the pen (top panel). People move faster if more of the space on the tablet is attributed to the region on the screen containing the targets and less to the space between the targets (lower panel). The three target sizes are shown in different colours. Note that the non-linear mapping makes a larger part of the tablet fall ‘within’ each target on the screen. b Example showing the endpoints (black dots) of the pen and the cursor for a trial with the non-linear mapping. The grey areas represent the visible targets on the screen. The ellipses represent the regions on the tablet that correspond with these targets. c The relationship between the movement times and the standard deviations in the lateral positions of the endpoints of the pen and cursor. Open and solid symbols: linear and non-linear mapping. Movements were faster with the non-linear mapping, but the relationship between the speed and accuracy of the pen did not change (the points fall on a single line when expressed in terms of endpoints of the pen: grey line with a slope of −0.3 for the relationship between movement time in seconds and the binary logarithm of the standard deviation of the endpoints in mm). Error bars indicate standard errors across subjects
Fig. 1 Variation on Fernandez and Bootsma’s (2004) rapid pointing task, in which subjects had to move a cursor back and forth as quickly as possible between two targets by moving a pen across a graphics tablet. a Two mappings between the horizontal coordinates of pen and cursor. Normally, motion of the cursor is a linearly scaled version of that of the pen (top panel). People move faster if more of the space on the tablet is attributed to the region on the screen containing the targets and less to the space between the targets (lower panel). The three target sizes are shown in different colours. Note that the non-linear mapping makes a larger part of the tablet fall ‘within’ each target on the screen. b Example showing the endpoints (black dots) of the pen and the cursor for a trial with the non-linear mapping. The grey areas represent the visible targets on the screen. The ellipses represent the regions on the tablet that correspond with these targets. c The relationship between the movement times and the standard deviations in the lateral positions of the endpoints of the pen and cursor. Open and solid symbols: linear and non-linear mapping. Movements were faster with the non-linear mapping, but the relationship between the speed and accuracy of the pen did not change (the points fall on a single line when expressed in terms of endpoints of the pen: grey line with a slope of −0.3 for the relationship between movement time in seconds and the binary logarithm of the standard deviation of the endpoints in mm). Error bars indicate standard errors across subjectsCC BY-NC · PubMed Central
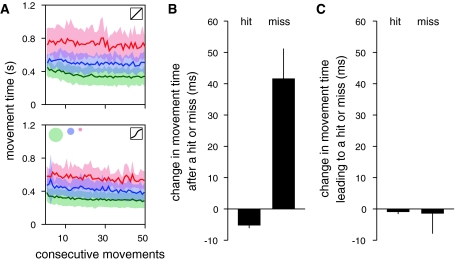
Fig. 2 Learning the adequate response. a Changes in movement time during sets of movements. Red, blue and green curves represent movements between the small, intermediate and large targets, respectively. The shaded areas are standard errors across subjects. b Influence that hitting or missing the target has on the movement time on the next trial. The average changes in movement time between the movements that resulted in a hit or miss and the next movements were determined separately for each subject (irrespective of the condition), and then averaged across subjects. Error bars are standard errors across subjects. c Change in movement time with respect to the previous movement when the target was hit or missed. Other details as in b
Fig. 2 Learning the adequate response. a Changes in movement time during sets of movements. Red, blue and green curves represent movements between the small, intermediate and large targets, respectively. The shaded areas are standard errors across subjects. b Influence that hitting or missing the target has on the movement time on the next trial. The average changes in movement time between the movements that resulted in a hit or miss and the next movements were determined separately for each subject (irrespective of the condition), and then averaged across subjects. Error bars are standard errors across subjects. c Change in movement time with respect to the previous movement when the target was hit or missed. Other details as in bCC BY-NC · PubMed Central
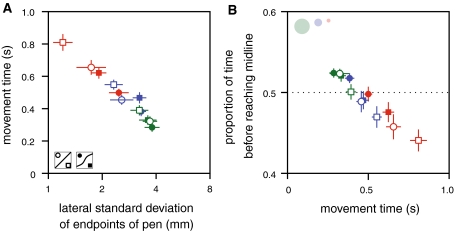
Fig. 3 Differences between conditions follow the same relationship as differences between the faster (circles) and slower (squares) half of the trials within each condition. Coding of mapping and target size as in Fig. 1c. a Relationship between speed and accuracy. b For longer movement times, the time spent after reaching the midline increased more than did the time that it took to reach the midline, irrespective of the mapping
Fig. 3 Differences between conditions follow the same relationship as differences between the faster (circles) and slower (squares) half of the trials within each condition. Coding of mapping and target size as in Fig. 1c. a Relationship between speed and accuracy. b For longer movement times, the time spent after reaching the midline increased more than did the time that it took to reach the midline, irrespective of the mappingCC BY-NC · PubMed Central
Fig. 4 Simulating performance in Trommershäuser, Maloney and Landy’s rapid pointing task with a simple algorithm that does not rely on knowing one’s variability (Eq. 3). The task is to quickly hit a green 18 mm diameter target disk to gain 100 points. Accidentally hitting a red penalty disk gives a loss of either 100 points (a) or 500 points (b). The separation between the disks is varied and the average position that is hit is compared with the optimal position to aim for. A positive position is away from the target centre with respect to the penalty region. The grey points are human pointing data from Figure 5 of Trommershäuser et al. (2003). The blue curves represent simulations for an aiming point that is updated in accordance with Eq. 3, and pointing movements with a horizontal and vertical standard deviation of 4 mm with respect to the aiming point. We used 1 mm per 100 points for g and l, so both are 1 mm when hitting the penalty disk gives a loss of 100 points (a), but l is 5 mm when the penalty is 500 points (b). Although the simulations were done in two dimensions, only the component in the direction of a line through the centres of the two disks is shown, because there were no systematic effects in the orthogonal direction. Each position on the curve (and the standard deviation represented by the shaded area) is based on 10,000 simulations of 40 trials each (the number of trials for each separation in the experiments). The initial aiming point for each simulation is along the line through the centres of the two disks, half way across the part of the target that does not overlap with the penalty area. The curve connects simulations for separations between 7 and 22 mm. The insets in b show the hit positions on single simulations for separations of 9 and 18 mm. Positions in the relevant direction on consecutive trials of these two simulations are shown in c and d respectively. Lag-one autocorrelations in such data were negligible: −0.01 ± 0.15 and 0.00 ± 0.16 (mean ± standard deviation) for separations of 9 and 18 mm, respectively
Fig. 4 Simulating performance in Trommershäuser, Maloney and Landy’s rapid pointing task with a simple algorithm that does not rely on knowing one’s variability (Eq. 3). The task is to quickly hit a green 18 mm diameter target disk to gain 100 points. Accidentally hitting a red penalty disk gives a loss of either 100 points (a) or 500 points (b). The separation between the disks is varied and the average position that is hit is compared with the optimal position to aim for. A positive position is away from the target centre with respect to the penalty region. The grey points are human pointing data from Figure 5 of Trommershäuser et al. (2003). The blue curves represent simulations for an aiming point that is updated in accordance with Eq. 3, and pointing movements with a horizontal and vertical standard deviation of 4 mm with respect to the aiming point. We used 1 mm per 100 points for g and l, so both are 1 mm when hitting the penalty disk gives a loss of 100 points (a), but l is 5 mm when the penalty is 500 points (b). Although the simulations were done in two dimensions, only the component in the direction of a line through the centres of the two disks is shown, because there were no systematic effects in the orthogonal direction. Each position on the curve (and the standard deviation represented by the shaded area) is based on 10,000 simulations of 40 trials each (the number of trials for each separation in the experiments). The initial aiming point for each simulation is along the line through the centres of the two disks, half way across the part of the target that does not overlap with the penalty area. The curve connects simulations for separations between 7 and 22 mm. The insets in b show the hit positions on single simulations for separations of 9 and 18 mm. Positions in the relevant direction on consecutive trials of these two simulations are shown in c and d respectively. Lag-one autocorrelations in such data were negligible: −0.01 ± 0.15 and 0.00 ± 0.16 (mean ± standard deviation) for separations of 9 and 18 mm, respectivelyCC BY-NC · PubMed Central

Verification

Claims the paper makes

The claims and statistics of this paper haven’t been checked yet.

Free: it reads the open-access text and checks the first 5 claims that cite a source we can check. Create a free account to check every claim.

A few free checks a day · papers already verified open instantly · results are public

Claims other papers make about this one

Each is checked against this paper’s own text: does it say what the citing paper says it does?

Self-check

Percentages, sums and reported differences re-computed from the paper’s own numbers.

The self-check needs the paper’s full text.

Citations

The citation lists are queued

They are fetched later and appear here then.

References 25 · Cited by 32

Metadata

Authors
Brenner, E., & Smeets, J. B. J.
Affiliations
Vrije Universiteit Amsterdam (NL)
Corresponding author
Brenner, Eli
Venue
Experimental Brain Research
Published
2011-07-12
Volume
213
Issue
1
Pages
153-161
ISSN
  • 0014-4819 (ISSN-L)
  • 1432-1106
OpenAlex
W2117454579
Cited by
32
References
25
Citations by year
2026: 1 · 2025: 3 · 2024: 1 · 2023: 1 · 2022: 3 · 2021: 1 · 2020: 1 · 2019: 2 · 2018: 4 · 2017: 2 · 2016: 1 · 2015: 1 · 2014: 1 · 2013: 3 · 2012: 7
FWCI
1.78
Type
journal article
Language
en
Open access
Licence
cc-by-nc
Locations
  • Experimental Brain Research (publishedVersion, cc-by-nc)
  • PubMed Central (publishedVersion, cc-by-nc)
  • PubMed (publishedVersion)
  • VU Research Portal (publishedVersion, other-oa)
  • Digital Academic REpository of VU University Amsterdam (Vrije Universiteit Amsterdam) (submittedVersion)
  • Data Archiving and Networked Services (DANS) (submittedVersion, other-oa)
Topics
  • Life Sciences › Neuroscience › Cognitive Neuroscience › Motor Control and Adaptation
  • Life Sciences › Neuroscience › Cognitive Neuroscience › Visual perception and processing mechanisms
  • Social Sciences › Psychology › Developmental and Educational Psychology › Sport Psychology and Performance
Keywords
movement variability, visuomotor control, cursor control, task difficulty, visuomotor mapping, visuomotor adaptation
MeSH terms
Adaptation, Psychological, Humans, Learning, Movement, Psychomotor Performance, Time Factors

About these checks

Registry, retraction, Cites and statistics results are computed, not judged, with one exception: a printed reference that no index lists is read once by a model before it counts as a citation error. Claims are extracted by a model and kept only when their quote appears verbatim in the text; each cited source is then checked, with a model’s help, for whether it says what the claim relies on. Those verdicts can be wrong — read the claim’s quote and the cited source before relying on one.

Statistics and arithmetic are recomputed, not judged.

Confidence bands are shown only for fields calibrated on our annotated test set. None is calibrated yet, so no band is shown.

What counts as a claim ›How we measure confidence ›How we check this ›

Are you an author, or do you see a problem with this page? Request a review

How to cite

Cite CoChat for the checks on this page, and the paper for its own findings.

This page
CoChat. (2026). Citation check: Quickly “learning” to move optimally. https://app.cochat.ai/papers/10.1007/s00221-011-2786-9
The paper
Brenner, E., & Smeets, J. B. J. (2011). Quickly “learning” to move optimally. Experimental Brain Research. https://doi.org/10.1007/s00221-011-2786-9

Data sources

Bibliographic data: Semantic Scholar, OpenAlex, Crossref.

Contains information from the Semantic Scholar Academic Graph Datasets, made available under the ODC Attribution License (ODC-BY 1.0).

Semantic Scholar’s data is described in: Kinney, R., et al. (2023). The Semantic Scholar Open Data Platform. arXiv:2301.10140.