

The DOI matches its Crossref record.
Living with Reduced Income: An Analysis of Household Financial Vulnerability Under COVID-19
Open accessAbstract
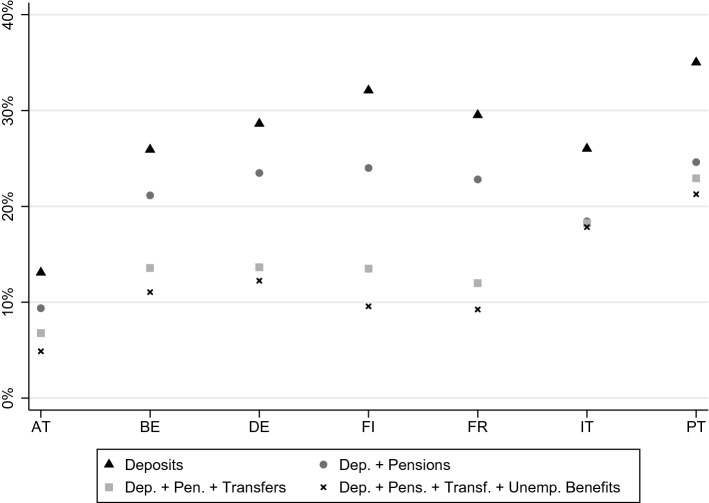
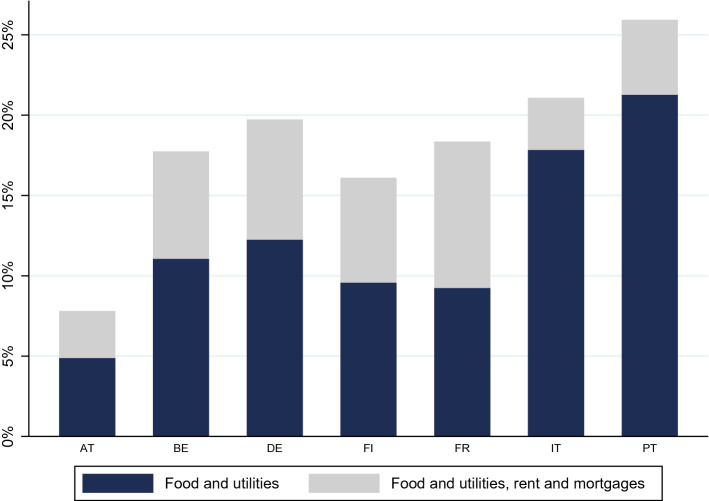
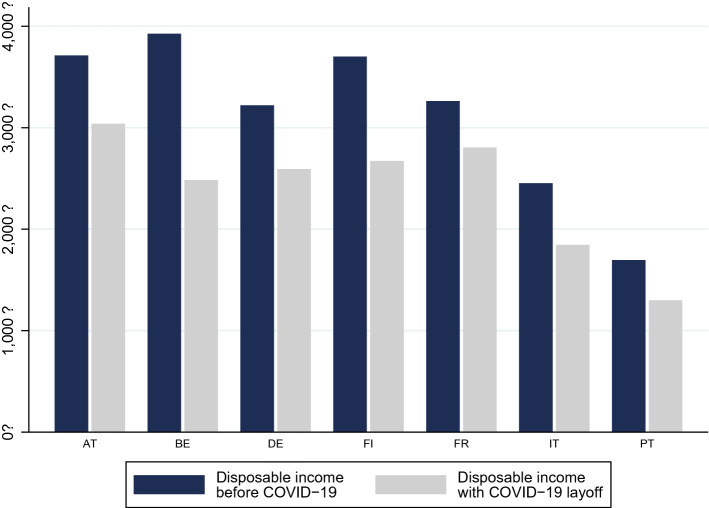
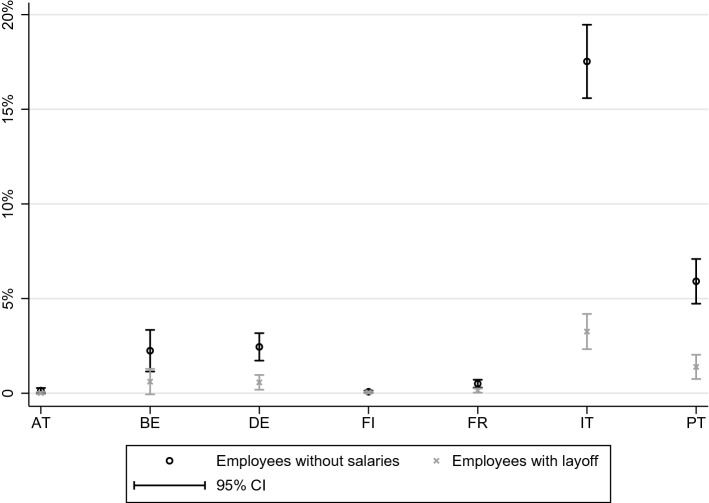
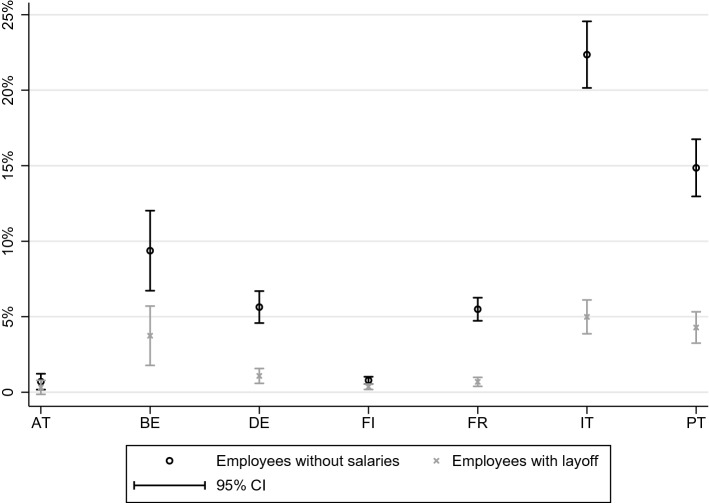
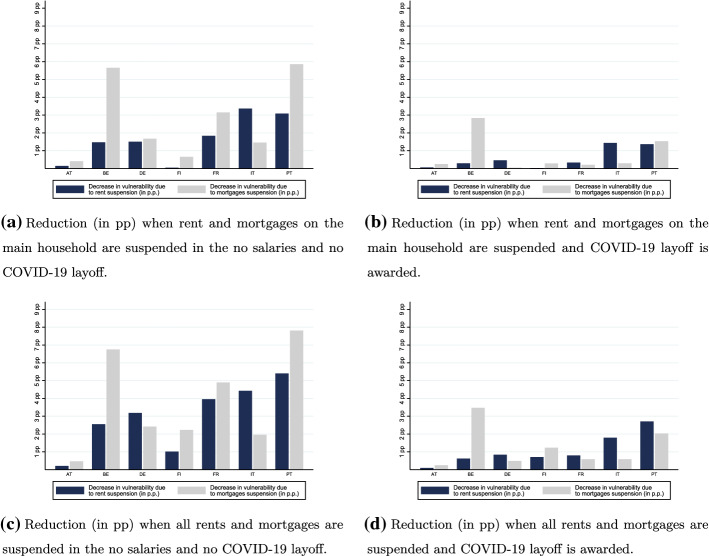
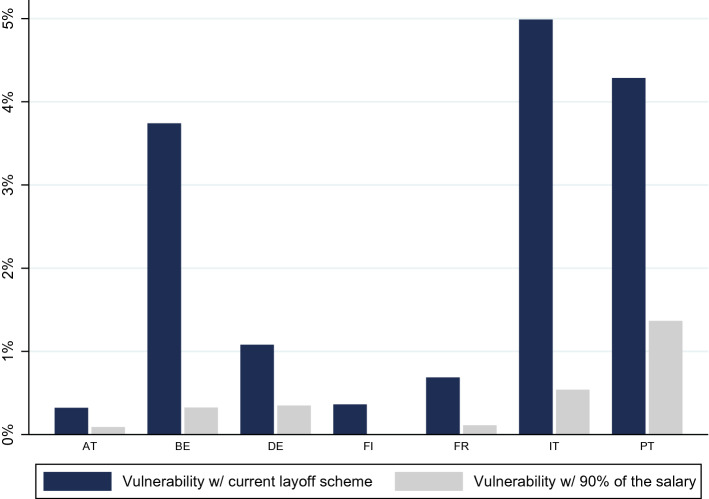
The COVID-19 crisis has led to substantial reductions in earnings. We propose a new measure of financial vulnerability, computable through survey data, to determine whether households can withstand a certain income shock for a defined period of time. Using data from the ECB Household Finance and Consumption Survey (HFCS) we analyse financial vulnerability in seven EU countries. We find that, out of the 243 million individuals considered, 47 million are vulnerable to a three month long income shock (the average length of the first wave COVID-19 lockdown), i.e., they cannot afford food and housing expenses for three months without privately earned income. Differences across countries are stark. Individuals born outside the EU are especially likely to be vulnerable. Being younger, a single parent, and a woman are also statistically significant risk factors. Through a tax-benefit microsimulation exercise, we look into the COVID-19 employment protection benefits, the largest income support measure in the countries considered. Considering as our sample individuals in households where someone receives a salary, we derive household net income when employees are laid-off and awarded the COVID-19 employment protection benefits enacted. Our findings suggest that the employment protection schemes are extremely effective in reducing the number of vulnerable individuals. The relative importance of rent and mortgage suspensions, (likewise, widespread COVID-19 policies), in alleviating vulnerability, is highly country dependent.
Overview
The claims and statistics of this paper haven’t been checked yet.
Run the check — free, no account needed. It reads the open-access text and checks the sources it cites.
Integrity signals
Registry
Cites
Statistics
Figures
Verification
Claims the paper makes
The claims and statistics of this paper haven’t been checked yet.
Run the check — free, no account needed. It reads the open-access text and checks the sources it cites.
Claims other papers make about this one
Each is checked against this paper’s own text: does it say what the citing paper says it does?
The check wasn’t confident either way, so it gives no verdict — never disputed.
In the citing paper
“In 2020, 23.6% of South Africans were food insecure [88].”
From Exploring Psychosocial Stressors and Coping Strategies During the COVID‐19 Lockdown: A Study of Two Low‐Income Communities in South Africa (2025) · cites this paper as [88]
Experimental — accuracy not yet measured
Self-check
Percentages, sums and reported differences re-computed from the paper’s own numbers.
The self-check needs the paper’s full text.
Citations
Cites
No references could be resolved yet.
Research works printed but not linked: 29
- Adams-Prassl, A., Boneva, T., Golin, M., & Rauh, C. (2020a). Inequality in the impact of the coronavirus shock: evidence from real time surveys. Journal of Public Economics, 189, 104245. · DOI
- Aguiar, M., & Erik, H. (2007). Life-cycle prices and production. American Economic Review, 97(5), 1533–1559. · DOI
- Anderloni, L., Emanuele, B., & Daniela, V. (2012). Household financial vulnerability: an empirical analysis. Research in Economics, 66(3), 284–296. · DOI
- Andersen, A. L, Hansen, E. T., Johannesen, N., & Sheridan, A. (2020). Consumer responses to the COVID-19 crisis: Evidence from bank account transaction data. In CEPR Discussion Papers 14809, C.E.P.R. Discussion Papers. · DOI
- Browning, M., & Thomas, F. C. (2009). Shocks, stocks, and socks: smoothing consumption over a temporary income loss. Journal of the European Economic Association, 7(6), 1169–1192. · DOI
- Chetty, R., & Adam, S. (2007). Consumption commitments and risk preferences. The Quarterly Journal of Economics, 122(2), 831–877. · DOI
- Claeys, G., Darvas, Z., Demertzis, M., & Wolff, G. B. (2021). The great COVID-19 divergence: managing a sustainable and equitable recovery in the European Union. Intereconomics, 2021(4), 301–309.
- Codagnone, C., Bogliacino, F., Gómez, C., Charris, R., Montealegre, F., Liva, G., et al. (2020). Assessing concerns for the economic consequence of the COVID-19 response and mental health problems associated with economic vulnerability and negative economic shock in Italy, Spain, and the United Kingdom. Plos one, 15(10), e0240876. · DOI
- Collins, J.M. (2015). Paying for the unexpected: making the case for a new generation of strategies to boost emergency savings, affording contingencies, and liquid resources for low-income families. In A fragile balance. Springer, pp. 1-15. · DOI
- De, W., Hans, T.V.E., Nele D.C. (2015). Job insecurity, health and well-being. In Sustainable working lives. Springer, pp. 109-128. · DOI
- Dynarski, M., & Steven, M. S. (1987). Consumption and unemployment. The Quarterly Journal of Economics, 102(2), 411–428. · DOI
- Esselink, H., & Lola H. (2017). The use of cash by households in the euro area. In: ECB Occasional Paper 201. · DOI
- Ferrie, J. E., Shipley, M. J., Marmot, M. G., Martikainen, P., Stansfeld, S. A., & Smith, G. D. (2001). Job insecurity in white-collar workers: toward an explanation of association with health. Journal of Occupational Health Psychology, 6(1), 26. · DOI
- Günther, I., & Maier, J. K. (2014). Poverty, vulnerability, and reference-dependent utility. Review of Income and Wealth, 60(1), 155–181. · DOI
- Hamermesh, D. S. (1982). Minimum wages and the demand for labor. Economic Inquiry, 20(3), 365–380. · DOI
- Hoddinott, J., & Quisumbing, A. (2010). Methods for microeconometric risk and vulnerability assessment. In Risk, shocks, and human development. Springer, pp. 62-100. · DOI
- Horvath, A., Benjamin K., & Carlo W. (2020). The COVID-19 shock and consumer credit: Evidence from credit card data. In CEPR: COVID economics - vetted and real-time papers. https://cepr.org/sites/default/files/news/CovidEconomics36.pdf. · DOI
- Kendall, J. (2010). A penny saved: How do savings accounts help the poor?” In Randomized Social Experiments eJournal. · DOI
- Kuypers, S., Francesco, F., Gerlinde V. (2016). The eurosystem household finance and consumption survey: a new underlying database for EUROMOD. In Technical report EUROMOD working paper. · DOI
- Larson, J. H., Stephan, M. W., & Rochelle, B. (1994). The impact of job insecurity on marital and family relationships. Family Relations, 43(2), 138–143. · DOI
- Long, M.G. (2020). Informal borrowers and financial exclusion: the invisible unbanked at the intersections of race and gender. In The review of black political economy, p. 0034644620938620. · DOI
- Minguez, J.G., Alberto U., de Mirasierra, M.P. et al. (2020). Consumption in Spain during the state of alert: an analysis based on payment card spending. In Economic bulletin 3/2020, pp. 1-14.
- Naik, N. Y., & Moore, M. J. (1996). Habit formation and intertemporal substitution in individual food consumption. The Review of Economics and Statistics, 78(2), 321–328. · DOI
- Piyapromdee, S., & Spittal P. (2020). The income and consumption effects of covid-19 and the role of public policy. In Fiscal studies. · DOI
- Rao, J. N. K., Wu, C. F. J., & Yue, K. (1992). Some recent work on resampling methods for complex surveys. Survey Methodology, 18(2), 209–217.
- Simha, A., et al. (2020). Effect of gender and clinical-financial vulnerability on mental distress due to COVID-19. Archives of Women’s Mental Health, 23(6), 775–777. · DOI
- Sjöberg, O. (2010). Social insurance as a collective resource: unemployment benefits, job insecurity and subjective well-being in a comparative perspective. Social Forces, 88(3), 1281–1304. · DOI
- Stephens, M., Jr. (2001). The long-run consumption effects of earnings shocks. Review of Economics and Statistics, 83(1), 28–36. · DOI
- Whelan, C. T. (1993). The role of social support in mediating the psychological consequences of economic stress. Sociology of Health & Illness, 15(1), 86–101. · DOI
Cited by
Gwadiso, X. A., Taliep, N., Ismail, G., James (née Louw), S., & Swart, L.-A. (2025) · Journal of Theoretical Social Psychology · doi:10.1155/jts5/8167323 · Cited by 2
Metadata
- Authors
- Midões, C., & Seré, M.
- Affiliations
- Ca' Foscari University of Venice (IT)
- University of Antwerp (BE)
- Corresponding author
- Seré, Mateo
- Venue
- Social Indicators Research
- Published
- 2021-10-08
- Volume
- 161
- Issue
- 1
- Pages
- 125-149
- ISSN
- 0303-8300 (ISSN-L)
- 1573-0921
- PMC
- PMC8500469
- OpenAlex
- W3205813136
- Cited by
- 65
- References
- 0
- Citations by year
- 2026: 11 · 2025: 19 · 2024: 14 · 2023: 12 · 2022: 9
- FWCI
- 12.13
- Type
- journal article
- Language
- en
- Open access
- hybrid
- doi.org
- Locations
- Social Indicators Research (publishedVersion, cc-by)
- PubMed Central (publishedVersion, cc-by)
- PubMed (publishedVersion)
- RePEc: Research Papers in Economics (submittedVersion)
- Funders
- Universitat Pompeu Fabra
- Topics
- Social Sciences › Sociology and Political Science › Income, Poverty, and Inequality
- Social Sciences › Economics, Econometrics and Finance › Economics and Econometrics › COVID-19 Pandemic Impacts
- Social Sciences › Economics, Econometrics and Finance › Finance › Financial Literacy, Pension, Retirement Analysis
- Keywords
- household financial vulnerability, COVID-19 pandemic, income shocks, tax-benefit microsimulation, COVID-19 lockdown, EU member states, single-parent families, gender differences, employment protection
About these checks
Registry, retraction, Cites and statistics results are computed, not judged, with one exception: a printed reference that no index lists is read once by a model before it counts as a citation error. Claims are extracted by a model and kept only when their quote appears verbatim in the text; each cited source is then checked, with a model’s help, for whether it says what the claim relies on. Those verdicts can be wrong — read the claim’s quote and the cited source before relying on one.
Statistics and arithmetic are recomputed, not judged.
Confidence bands are shown only for fields calibrated on our annotated test set. None is calibrated yet, so no band is shown.
What counts as a claim ›How we measure confidence ›How we check this ›
Are you an author, or do you see a problem with this page? Request a review
Data sources
Bibliographic data: Semantic Scholar, OpenAlex, Crossref.
Contains information from the Semantic Scholar Academic Graph Datasets, made available under the ODC Attribution License (ODC-BY 1.0).
Semantic Scholar’s data is described in: Kinney, R., et al. (2023). The Semantic Scholar Open Data Platform. arXiv:2301.10140.
