

The DOI matches its Crossref record; 32 of the 32 references it cites were found in a registry or an index.
A real-time system for biomechanical analysis of human movement and muscle function
Open accessAbstract
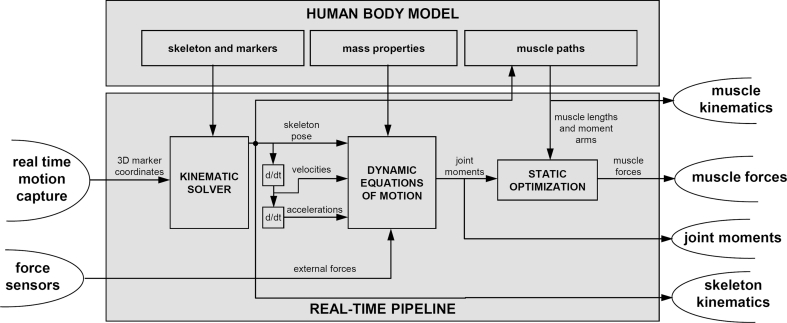
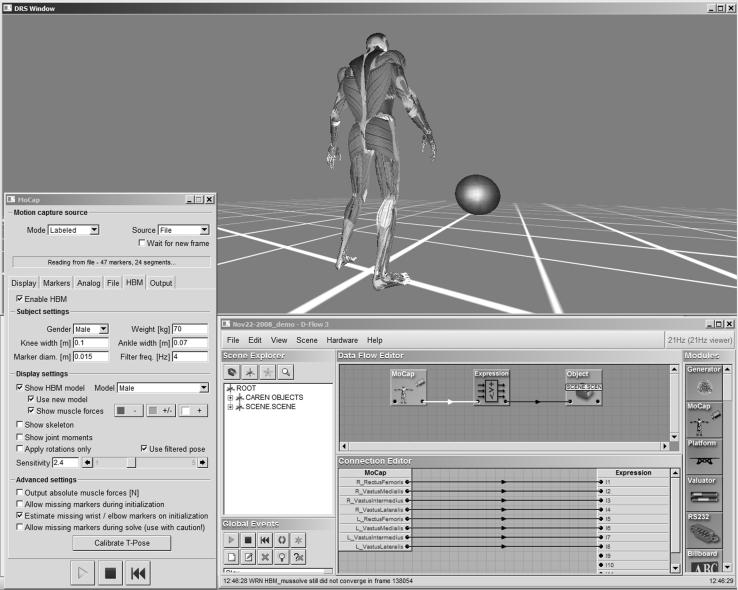
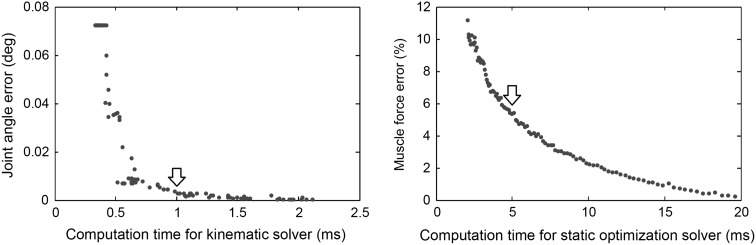
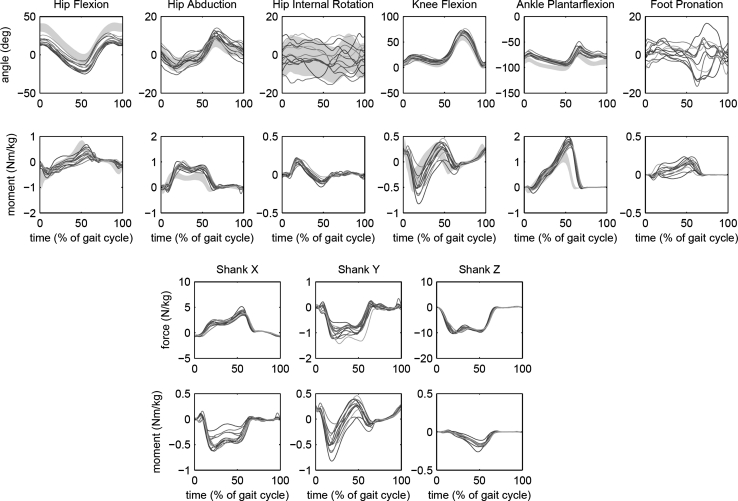
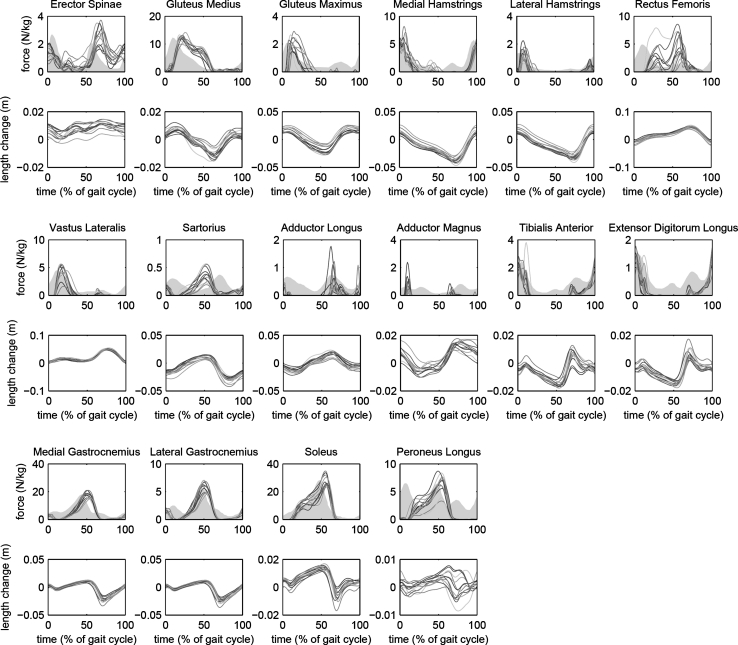
Mechanical analysis of movement plays an important role in clinical management of neurological and orthopedic conditions. There has been increasing interest in performing movement analysis in real-time, to provide immediate feedback to both therapist and patient. However, such work to date has been limited to single-joint kinematics and kinetics. Here we present a software system, named human body model (HBM), to compute joint kinematics and kinetics for a full body model with 44 degrees of freedom, in real-time, and to estimate length changes and forces in 300 muscle elements. HBM was used to analyze lower extremity function during gait in 12 able-bodied subjects. Processing speed exceeded 120 samples per second on standard PC hardware. Joint angles and moments were consistent within the group, and consistent with other studies in the literature. Estimated muscle force patterns were consistent among subjects and agreed qualitatively with electromyography, to the extent that can be expected from a biomechanical model. The real-time analysis was integrated into the D-Flow system for development of custom real-time feedback applications and into the gait real-time analysis interactive lab system for gait analysis and gait retraining.
Overview
The claims and statistics of this paper haven’t been checked yet.
Run the check — free, no account needed. It reads the open-access text and checks the sources it cites.
Integrity signals
Registry
Cites
Statistics
Figures
Verification
Claims the paper makes
The claims and statistics of this paper haven’t been checked yet.
Run the check — free, no account needed. It reads the open-access text and checks the sources it cites.
Self-check
Percentages, sums and reported differences re-computed from the paper’s own numbers.
The self-check needs the paper’s full text.
Citations
Cites
Numerical Recipes, The Art of Scientific Computing
Press, W. H., Flannery, B. P., Teukolsky, S. A., Vetterling, W. T., & Gould, H. (1987) · American Journal of Physics · doi:10.1119/1.14981 · Cited by 10,032
OpenSim: Open-Source Software to Create and Analyze Dynamic Simulations of Movement
Delp, S. L., Anderson, F. C., Arnold, A. S., Loan, P., Habib, A., John, C. T., Guendelman, E., & Thelen, D. G. (2007) · IEEE Transactions on Biomedical Engineering · doi:10.1109/tbme.2007.901024 · Cited by 4,951
Numerical Recipes--The Art of Scientific Computing.
Fritsch, F. N., Press, W. H., Flannery, B. P., Teukolsky, S. A., & Vetterling, W. T. (1988) · Mathematics of Computation · doi:10.2307/2007938 · Cited by 4,846
Hewett, T. E., Myer, G. D., Ford, K. R., Heidt, R. S., Colosimo, A. J., McLean, S. G., van den Bogert, A. J., Paterno, M. V., & Succop, P. (2005) · The American Journal of Sports Medicine · doi:10.1177/0363546504269591 · Cited by 3,577
Adjustments to Zatsiorsky-Seluyanov's segment inertia parameters
de Leva, P. (1996) · Journal of Biomechanics · doi:10.1016/0021-9290(95)00178-6 · Cited by 3,072
An interactive graphics-based model of the lower extremity to study orthopaedic surgical procedures
Delp, S. L., Loan, J. P., Hoy, M. G., Zajac, F. E., Topp, E. L., & Rosen, J. M. (1990) · IEEE Transactions on Biomedical Engineering · doi:10.1109/10.102791 · Cited by 2,003
Repeatability of kinematic, kinetic, and electromyographic data in normal adult gait
Kadaba, M. P., Ramakrishnan, H. K., Wootten, M. E., Gainey, J., Gorton, G. E., & Cochran, G. V. B. (1989) · Journal of Orthopaedic Research® · doi:10.1002/jor.1100070611 · Cited by 1,479
A physiologically based criterion of muscle force prediction in locomotion
Crowninshield, R. D., & Brand, R. A. (1981) · Journal of Biomechanics · doi:10.1016/0021-9290(81)90035-x · Cited by 1,434
Model-based estimation of muscle forces exerted during movements
Erdemir, A., McLean, S. G., Herzog, W., & van den Bogert, A. J. (2006) · Clinical Biomechanics · doi:10.1016/j.clinbiomech.2006.09.005 · Cited by 873
EMG profiles during normal human walking: stride-to-stride and inter-subject variability
Winter, D. A., & Yack, H. J. (1987) · Electroencephalography and Clinical Neurophysiology · doi:10.1016/0013-4694(87)90003-4 · Cited by 681
Research works printed but not linked: 2
- Rasmussen J, de Zee M, Dahl J, Damsgaard M (2009) Salient properties of a combined minimum-fatigue and and quadratic muscle recruitment criterion. In: Proceedings of the 12th international symposium on computer simulation in biomechanics, Cape Town, South Africa, 2–4 July 2009
- van den Bogert AJ, Geijtenbeek T A state space filter for smoothing and differentiation of real-time data with variable sampling rate. Comput Methods Biomech Biomed Eng (in review)
Cited by
Sorted by citations
Fukuchi, C. A., Fukuchi, R., & Duarte, M. (2019) · Systematic Reviews · doi:10.1186/s13643-019-1063-z · Cited by 538
A public dataset of overground and treadmill walking kinematics and kinetics in healthy individuals
Fukuchi, C. A., Fukuchi, R., & Duarte, M. (2018) · PeerJ · doi:10.7717/peerj.4640 · Cited by 297
Falisse, A. M. D., Pitto, L., Kainz, H., Hoang, H., Wesseling, M., Rossom, S. V., Papageorgiou, E., Bar‐On, L., Hallemans, A., Desloovere, K., et al. (2019) · Journal of The Royal Society Interface · doi:10.1098/rsif.2019.0402 · Cited by 239
Derrick, T. R., van den Bogert, A. J., Cereatti, A., Dumas, R., Fantozzi, S., & Leardini, A. (2019) · Journal of Biomechanics · doi:10.1016/j.jbiomech.2019.109533 · Cited by 186
Robust Real-Time Musculoskeletal Modeling Driven by Electromyograms
Durandau, G., Farina, D., & Sartori, M. (2017) · IEEE Transactions on Biomedical Engineering · doi:10.1109/tbme.2017.2704085 · Cited by 158
Metadata
- Authors
- van den Bogert, A. J., Geijtenbeek, T., Even-Zohar, O., Steenbrink, F., & Hardin, E. C.
- Affiliations
- Louis Stokes Cleveland VA Medical Center (US)
- Venue
- Medical & Biological Engineering & Computing
- Published
- 2013-07-25
- Volume
- 51
- Issue
- 10
- Pages
- 1069-1077
- ISSN
- 0140-0118 (ISSN-L)
- 1741-0444
- PMC
- PMC3751375
- OpenAlex
- W2050578981
- Cited by
- 392
- References
- 32
- Citations by year
- 2026: 20 · 2025: 31 · 2024: 30 · 2023: 49 · 2022: 38 · 2021: 42 · 2020: 34 · 2019: 35 · 2018: 32 · 2017: 35 · 2016: 17 · 2015: 17 · 2014: 10 · 2013: 2
- FWCI
- 8.43
- Type
- journal article
- Language
- en
- Open access
- hybrid
- doi.org
- Locations
- Medical & Biological Engineering & Computing (publishedVersion, cc-by)
- Europe PMC (PubMed Central) (publishedVersion)
- PubMed Central (publishedVersion, cc-by)
- PubMed (publishedVersion)
- EngagedScholarship @ Cleveland State University (Cleveland State University) (submittedVersion)
- Topics
- Physical Sciences › Engineering › Biomedical Engineering › Muscle activation and electromyography studies
- Physical Sciences › Engineering › Biomedical Engineering › Lower Extremity Biomechanics and Pathologies
- Physical Sciences › Computer Science › Computer Graphics and Computer-Aided Design › Human Motion and Animation
- Keywords
- human body model, joint kinematics, joint kinetics, muscle force estimation, gait analysis, lower extremity, real-time feedback, gait retraining, electromyography validation
- MeSH terms
- Adult, Biomechanical Phenomena, Computer Simulation, Computer Systems, Female, Gait, Humans, Male, Models, Biological, Movement, Software, User-Computer Interface, Range of Motion, Articular, Muscle, Skeletal
About these checks
Registry, retraction, Cites and statistics results are computed, not judged, with one exception: a printed reference that no index lists is read once by a model before it counts as a citation error. Claims are extracted by a model and kept only when their quote appears verbatim in the text; each cited source is then checked, with a model’s help, for whether it says what the claim relies on. Those verdicts can be wrong — read the claim’s quote and the cited source before relying on one.
Statistics and arithmetic are recomputed, not judged.
Confidence bands are shown only for fields calibrated on our annotated test set. None is calibrated yet, so no band is shown.
What counts as a claim ›How we measure confidence ›How we check this ›
Are you an author, or do you see a problem with this page? Request a review
