

The DOI matches its Crossref record; 2 of the 2 references it cites were found in a registry or an index.
An integrated cyberGIS and machine learning framework for fine-scale prediction of Urban Heat Island using satellite remote sensing and urban sensor network data
Open accessAbstract
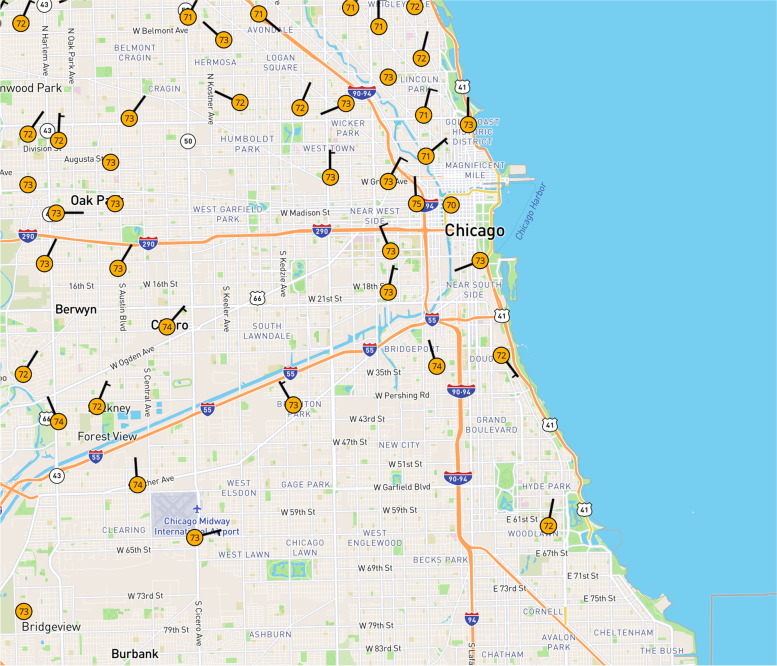
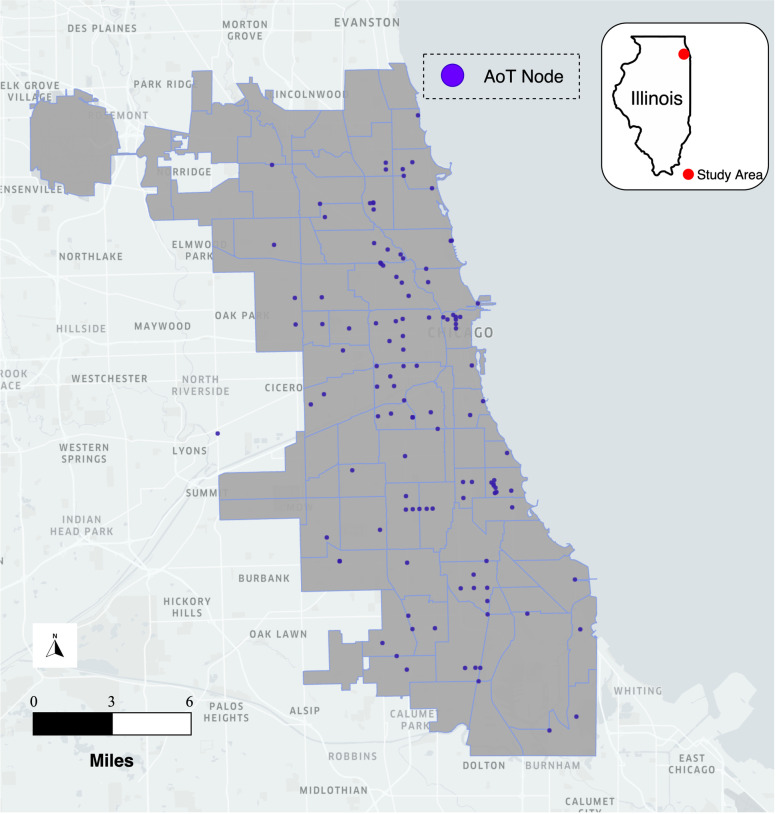
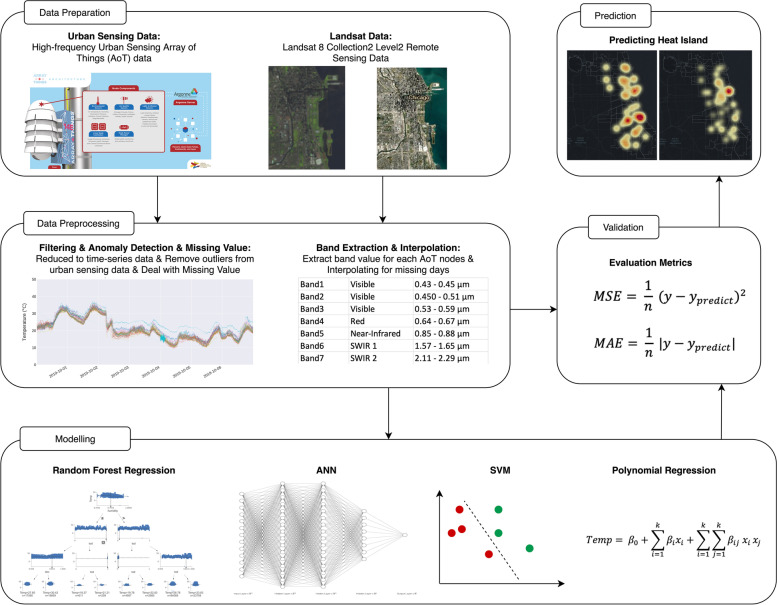
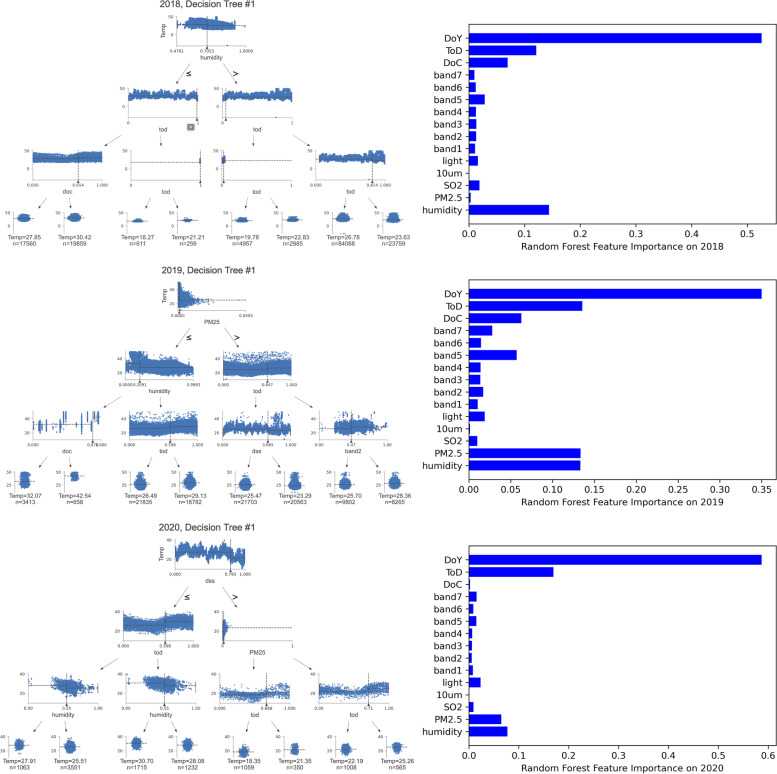
Due to climate change and rapid urbanization, Urban Heat Island (UHI), featuring significantly higher temperature in metropolitan areas than surrounding areas, has caused negative impacts on urban communities. Temporal granularity is often limited in UHI studies based on satellite remote sensing data that typically has multi-day frequency coverage of a particular urban area. This low temporal frequency has restricted the development of models for predicting UHI. To resolve this limitation, this study has developed a cyber-based geographic information science and systems (cyberGIS) framework encompassing multiple machine learning models for predicting UHI with high-frequency urban sensor network data combined with remote sensing data focused on Chicago, Illinois, from 2018 to 2020. Enabled by rapid advances in urban sensor network technologies and high-performance computing, this framework is designed to predict UHI in Chicago with fine spatiotemporal granularity based on environmental data collected with the Array of Things (AoT) urban sensor network and Landsat-8 remote sensing imagery. Our computational experiments revealed that a random forest regression (RFR) model outperforms other models with the prediction accuracy of 0.45 degree Celsius in 2020 and 0.8 degree Celsius in 2018 and 2019 with mean absolute error as the evaluation metric. Humidity, distance to geographic center, and PM 2.5 concentration are identified as important factors contributing to the model performance. Furthermore, we estimate UHI in Chicago with 10-min temporal frequency and 1-km spatial resolution on the hottest day in 2018. It is demonstrated that the RFR model can accurately predict UHI at fine spatiotemporal scales with high-frequency urban sensor network data integrated with satellite remote sensing data.
Overview
The claims and statistics of this paper haven’t been checked yet.
Run the check — free, no account needed. It reads the open-access text and checks the sources it cites.
Integrity signals
Registry
Cites
Statistics
Figures
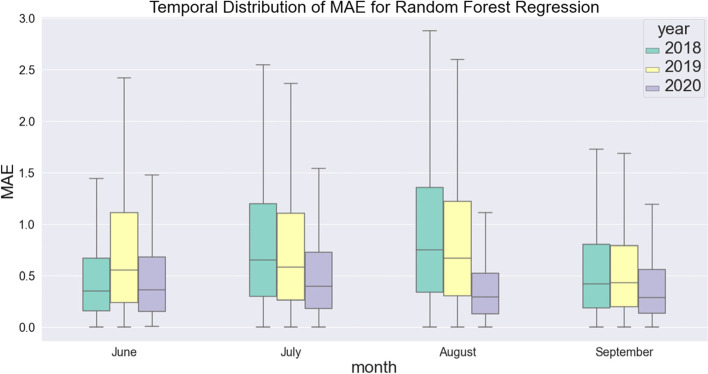
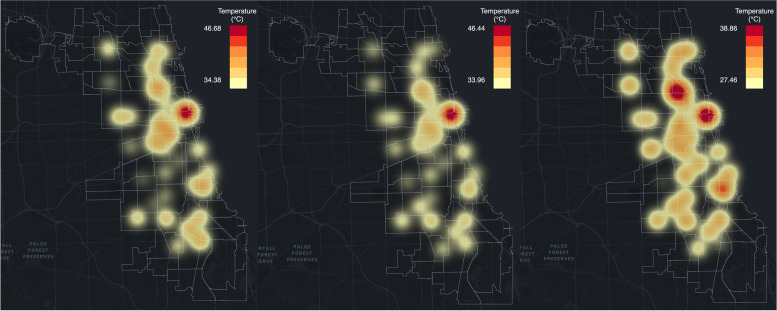
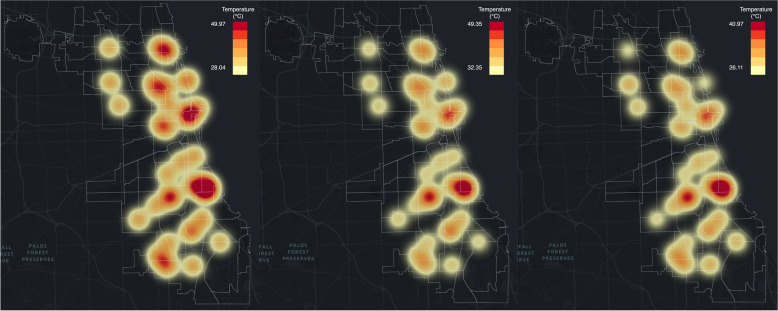
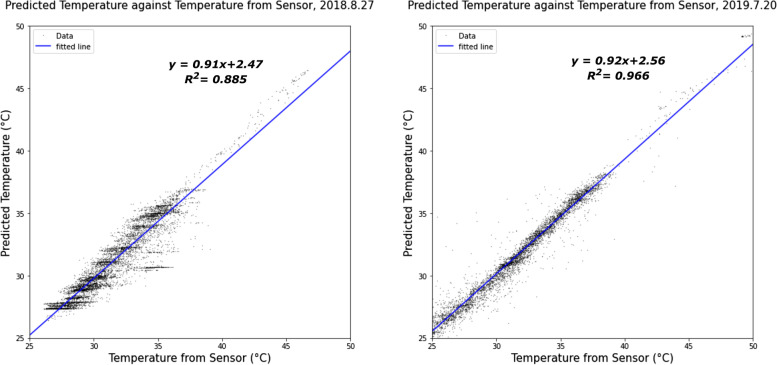
Verification
Claims the paper makes
The claims and statistics of this paper haven’t been checked yet.
Run the check — free, no account needed. It reads the open-access text and checks the sources it cites.
Claims other papers make about this one
Each is checked against this paper’s own text: does it say what the citing paper says it does?
The source backs part of the claim, not all of it — or backs it for a different population, condition or comparison.
In the citing paper
“In general, the literature suggests that deep learning-based heat prediction [27, 28], urban heat risk assessment [29], and GPU-accelerated computation [26] have mostly been examined separately.”
From GPU-Accelerated Deep Learning for Heatwave Prediction and Urban Heat Risk Assessment (2026) · cites this paper as [28]
Experimental — accuracy not yet measured
Self-check
Percentages, sums and reported differences re-computed from the paper’s own numbers.
The self-check needs the paper’s full text.
Citations
Cites
Global forecasts of urban expansion to 2030 and direct impacts on biodiversity and carbon pools
Seto, K. C., Güneralp, B., & Hutyra, L. R. (2012) · Proceedings of the National Academy of Sciences · doi:10.1073/pnas.1211658109 · Cited by 5,086
Strong contributions of local background climate to urban heat islands
Zhao, L., Lee, X., Smith, R. B., & Oleson, K. (2014) · Nature · doi:10.1038/nature13462 · Cited by 1,577
Research works printed but not linked: 55
- Acharya, T., & Yang, I. (2015). Exploring Landsat 8. International Journal of IT Engineering and Applied Sciences Research (IJIEASR), 4(4), 4–10. April 2015.
- Alfraihat, R., Mulugeta, G., & Gala, T. S. (2016). Ecological evaluation of urban heat island in Chicago City, USA. Journal of Atmospheric Pollution, 4(1), 23–29.
- Amato, F., Guignard, F., Robert, S., et al. (2020). A novel framework for spatio-temporal prediction of environmental data using deep learning. Science and Reports, 10, 22243. https://doi.org/10.1038/s41598-020-79148-7 · DOI
- Anselin, L., & Rey, S. J. (2012). Spatial econometrics in an age of cyberGIScience. International Journal of Geographical Information Science, 26(12), 2211–2226. · DOI
- Armstrong, M. P., Wang, S., & Zhang, Z. (2019). The Internet of Things and fast data streams: Prospects for geospatial data science in emerging information ecosystems. Cartography and Geographic Information Science, 46(1), 39–56. · DOI
- Baklanov, A., Molina, L., & Gauss, M. (2016). Megacities, air quality and climate. Atmospheric Environment, 126, 235–249. · DOI
- Beckman P, Catlett C, Altintas I, Kelly E, Collis S. (2019). Mid-scale RI-1: SAGE: A Software-Defined Sensor Network (NSF OAC 1935984), https://sagecontinuum.org/.
- Boyle, D. E., Yates, D. C., & Yeatman, E. M. (2013). Urban Sensor Data Streams: London 2013. IEEE Internet Computing, 17(6), 12–20. https://doi.org/10.1109/MIC.2013.85 Nov.-Dec. 2013. · DOI
- Buuren, S., & Groothuis-Oudshoorn, K. (2011). MICE: Multivariate Imputation by Chained Equations in R. Journal of Statistical Software, 45(3), 1–67. · DOI · Paper page
- Catlett, C., Beckman, P., Ferrier, N., Papka, M.E., Sankaran, R., Solin, J., Taylor, V., Pancoast, D. and Reed, D., 2022. Hands-On Computer Science: The Array of Things Experimental Urban Instrument. Computing in Science & Engineering, 24(1), 57–63. https://doi.org/10.1109/MCSE.2021.3139405. · DOI
- Catlett, CE., Beckman, PH., Sankaran, R., and Galvin, KK. (2017). Array of things: a scientific research instrument in the public way: platform design and early lessons learned. In: Proceedings of the 2nd international workshop on science of smart city operations and platforms engineering. Association for Computing Machinery, New York, NY, USA, 26–33. https://doi.org/10.1145/3063386.3063771. · DOI
- Chen, S., & Hwang, J. (2020). Temperature prediction using fuzzy time series. IEEE Transactions on Systems Man and Cybernetics Part B (Cybernetics), 30(2), 263–275. https://doi.org/10.1109/3477.836375 · DOI
- Daepp, M., et al. (2022). Eclipse: An end-to-end platform for low-cost, hyperlocal environmental sensing in cities. 2022 21st ACM/IEEE International Conference on Information Processing in Sensor Networks (IPSN). https://doi.org/10.1109/IPSN54338.2022.00010. · DOI
- Desa, U. (2002). World urbanization prospects: The 2001 revision, data tables and highlights. New York: United Nations Population Division-Department of Economic and Social Affairs, United Nations Secretariat. (ESA/P/WP. 173),.
- Fan, Y., Zhan, Q., Tang, L., Liu, H., & Gao, S. (2021). Temporal characterization of minute-level PM25 variation within a local monitoring network using DWT-DTW. Building and Environment, 205, 108221. https://doi.org/10.1016/j.buildenv.2021.108221 ISSN 0360-1323. · DOI
- Gardes, T., et al. (2020). Statistical prediction of the nocturnal urban heat island intensity based on urban morphology and geographical factors - An investigation based on numerical model results for a large ensemble of French cities. Science of The Total Environment, 737, 139253. https://doi.org/10.1016/j.scitotenv.2020.139253 ISSN 0048-9697. · DOI
- Imhoff, M. (2010). Remote sensing of the urban heat island effect across biomes in the continental USA. Remote Sensing of Environment, 114(3), 504–513. · DOI
- Kang, J. Y., Michels, A., Lyu, F., et al. (2020). Rapidly measuring spatial accessibility of COVID-19 healthcare resources: A case study of Illinois, USA. International Journal of Health Geographics, 19, 36. https://doi.org/10.1186/s12942-020-00229-x · DOI
- Lai, L. W., & Cheng, W. L. (2010). Air temperature change due to human activities in Taiwan for the past century. International Journal of Climatology, 30(3), 432–444. https://doi.org/10.1002/joc.1898 · DOI
- Lee, U., Zhou, B., Gerla, M., Magistretti, E., Bellavista, P. and Corradi, A. (2006). Mobeyes: smart mobs for urban monitoring with a vehicular sensor network. IEEE Wireless Communications, 13(5), 52–57. https://doi.org/10.1109/WC-M.2006.250358. · DOI
- Li, H. (2018). Interaction between urban heat island and urban pollution island during summer in Berlin. Science of The Total Environment, 636, 818–828. · DOI
- Li, M., Liu, J., Lin, Y., Xiao, L., & Zhou, J. (2021). Revitalizing historic districts: Identifying built environment predictors for street vibrancy based on urban sensor data. Cities, 117, 103305. https://doi.org/10.1016/j.cities.2021.103305 ISSN 0264-2751. · DOI
- Li, X., Zhou, W., & Ouyang, Z. (2013). Relationship between land surface temperature and spatial pattern of greenspace: What are the effects of spatial resolution? Landscape and Urban Planning, 114(2013), 1–8. · DOI
- Lo, C. P., Quattrochi, D. A., & Luvall, J. C. (1997). Application of high-resolution thermal infrared remote sensing and GIS to assess the urban heat island effect. International Journal of Remote Sensing, 18(2), 287–304. https://doi.org/10.1080/014311697219079 · DOI
- Lyu, F., Xu, Z., Ma, X., Wang, S., Li, Z., & Wang, S. (2021). A vector-based method for drainage network analysis based on LiDAR data. Computers & Geosciences, 156, 104892. ISSN 0098-3004. · DOI
- Lyu, F., Yin, D., et al. (2019). Reproducible hydrological modeling with cyberGIS-Jupyter: A case study on SUMMA. Proceedings of the Practice and Experience in Advanced Research Computing on Rise of the Machines (learning).
- Mead, M., Popoola, O., Stewart, G., Landshoff, P., Calleja, M., Hayes, M., Baldovi, J., Mcleod, M., Hodgson, T., & Dicks, J. (2013). The use of electrochemical sensors for monitoring urban air quality in low-cost, high-density networks. Atmospheric Environment, 70, 186–203. · DOI
- Meehl, G. A., & Tebaldi, C. (2004). More intense, more frequent, and longer lasting heat waves in the 21st century. Science, 305, 994–997. · DOI · Paper page
- Menze, B. H., Kelm, B. M., Masuch, R., et al. (2009). A comparison of random forest and its Gini importance with standard chemometric methods for the feature selection and classification of spectral data. BMC Bioinformatics, 10, 213. https://doi.org/10.1186/1471-2105-10-213 · DOI
- Mohajerani, A., Bakaric, J., & Jeffrey-Bailey, T. (2017). The urban heat island effect, its causes, and mitigation, with reference to the thermal properties of asphalt concrete. Journal of Environmental Management, 197(2017), 522–538. · DOI
- Moore, N.Y. (2016). The south side: a portrait of Chicago and American segregation. New York City, NY: St. Martin’s Press.
- Nellore, K., & Hancke, G. P. (2016). A survey on urban traffic management system using wireless sensor networks. Sensors, 16, 157. · DOI
- Oh, J. W., Ngarambe, J., Duhirwe, P. N., et al. (2020). Using deep-learning to forecast the magnitude and characteristics of urban heat island in Seoul Korea. Science and Reports, 10, 3559. https://doi.org/10.1038/s41598-020-60632-z · DOI
- Radhika, Y., & Shashi, M. (2009). Atmospheric temperature prediction using support vector machines. International Journal of Computer Theory and Engineering, 1(1), 1793–8201.
- Rathore, M. M., Ahmad, A., Paul, A., & Rho, S. (2016). Urban planning and building smart cities based on the internet of things using big data analytics. Computer Networks, 101, 63–80. · DOI · Paper page
- Rousseeuw, P. J., & Hubert, M. (2011). Robust statistics for outlier detection. Wires Data Mining Knowl Discov, 1, 73–79. https://doi.org/10.1002/widm.2 · DOI
- Sharma, A., et al. (2016). Green and cool roofs to mitigate urban heat island effects in the Chicago metropolitan area: Evaluation with a regional climate model. Environmental Research Letters, 11, 064004. · DOI
- Shen, H., Huang, L., Zhang, L., Wu, P., & Zeng, C. (2016). Long-term and fine-scale satellite monitoring of the urban heat island effect by the fusion of multi-temporal and multi-sensor remote sensed data: A 26-year case study of the city of Wuhan in China. Remote Sensing of Environment, 172, 109–125. https://doi.org/10.1016/j.rse.2015.11.005 ISSN 0034-4257. · DOI
- Shi, Y., Katzschner, L., & Ng, E. (2018). Modelling the fine-scale spatiotemporal pattern of urban heat island effect using land use regression approach in a megacity, Science of The Total Environment, Volume 618, 2018. ISSN, 891–904, 0048–9697. https://doi.org/10.1016/j.scitotenv.2017.08.252 ISSN 0048-9697. · DOI
- Somers, K., et al. (2013). Streams in the urban heat island: spatial and temporal variability in temperature. Freshwater Science, 32(1), 309–326. · DOI
- Stempihar, J. J., Pourshams-Manzouri, T., Kaloush, K. E., & Rodezno, M. C. (2012). Porous asphalt pavement temperature effects for urban heat island analysis. Transportation Research Record, 2293(1), 123–130. https://doi.org/10.3141/2293-15 · DOI
- Szymanowski, M., & Kryza, M. (2009). GIS-based techniques for urban heat island spatialization. Clim Res, 38, 171–187. https://doi.org/10.3354/cr00780 · DOI
- Tan, J. (2010). The urban heat island and its impact on heat waves and human health in Shanghai. International Journal of Biometeorology, 54, 75–84. · DOI · Paper page
- Thakur, G., Bhaduri, B., Piburn, J., Sims, K., Stewart, R., & Urban, M. (2015). PlanetSense: a real-time streaming and spatio-temporal analytics platform for gathering geo-spatial intelligence from open source data. SIGSPATIAL’15: Proceedings of the 23rd SIGSPATIAL International Conference on Advances in Geographic Information Systems (pp. 1–4)
- USGS. (2020). Landsat 8–9 Operational Land Imager (OLI) - Thermal Infrared Sensor (TIRS) Collection 2 Level 2 (L2) Data Format Control Book (DFCB). https://d9-wret.s3.us-west-2.amazonaws.com/assets/palladium/production/s3fs-public/atoms/files/LSDS-1328_Landsat8-9-OLI-TIRS-C2-L2-DFCB-v6.pdf.
- Wang, S. (2010). A cyberGIS framework for the synthesis of cyberinfrastructure, GIS, and spatial analysis. Annals of the Association of American Geographers, 100(3), 535–557. · DOI
- Wang, S. (2016). cyberGIS and spatial data science. GeoJournal, 81(6) , 965–968. https://doi.org/10.1007/s10708-016-9740-0. · DOI
- Wang, S., & Goodchild, M. F. (2019). cyberGIS for Geospatial Innovation and Discovery. Springer, Dordrecht, Netherlands,. https://doi.org/10.1007/978-94-024-1531-5 · DOI
- Wang, S., Lyu, F., Wang, S., Catlet, C. E., Padmanabhan, A., & Soltani, K. (2021). Integrating cyberGIS and Urban Sensing for Reproducible Streaming Analytics. In W. Shi, M. F. Goodchild, M. Batty, M. P. Kwan, & A. Zhang (Eds.), Urban Informatics The Urban Book Series. Singapore: Springer. https://doi.org/10.1007/978-981-15-8983-6_36 · DOI
- Wang, S., Zhong, Y., & Wang, E. (2019). An integrated GIS platform architecture for spatiotemporal big data. Future Generation Computer Systems, 94, 160–172. · DOI
- Wong, M. S., Zhu, R., Kwok, Y. T., Kwan, M. P., Santi, P., Lee, K. H., Heo, J., Li, H., & Ratti, C. (2021). Association between NO2 concentrations and spatial configuration: A study of the impacts of COVID-19 lockdowns in 54 US cities. Environmental Research Letters, 16, 054064. · DOI
- Xie, Z. Q., Du, Y., Zeng, Y., Yan, M. L., & Zhu, C. Y. (2010). Accelerated human activities affecting the spatial pattern of temperature in the Yangtze River Delta. Quaternary International, 226, 112–121. https://doi.org/10.1016/j.quaint.2010.04.027 · DOI
- Yang, J., Wang, Z., & Kaloush, K. (2015). Environmental impacts of reflective materials: Is high albedo a ‘silver bullet’ for mitigating urban heat island? Renewable and Sustainable Energy Reviews, 47, 830–843. https://doi.org/10.1016/j.rser.2015.03.092 ISSN 1364-0321. · DOI
- Yin, D., Liu, Y., Hu, H., et al. (2019). cyberGIS-Jupyter for reproducible and scalable geospatial analytics. Concurrency Computat Pract Exper, 31, e5040. https://doi.org/10.1002/cpe.5040. · DOI
- Zhou, W., Huang, G., & Cadenasso, M. L. (2011). Does spatial configuration matter? Understanding the effects of land cover pattern on land surface temperature in urban landscapes. Landscape and Urban Planning, 102, 54–63. · DOI
Cited by
Sorted by citations
GPU-Accelerated Deep Learning for Heatwave Prediction and Urban Heat Risk Assessment
Alihodžić, A. (2026) · arXiv · doi:10.48550/arxiv.2605.16435
“In general, the literature suggests that deep learning-based heat prediction [27, 28], urban heat risk assessment [29], and GPU-accelerated computation [26] have mostly been examined separately.”
Metadata
- Authors
- Lyu, F., Wang, S., Han, S. Y., Catlett, C., & Wang, S.
- Affiliations
- University of Illinois Urbana-Champaign (US)
- Argonne National Laboratory (US)
- Corresponding author
- Wang, Shaohua
- Wang, Shaowen
- Venue
- Urban Informatics
- Published
- 2022-09-09
- Volume
- 1
- Issue
- 1
- Pages
- 6-6
- ISSN
- 2731-6963 (ISSN-L)
- PMC
- PMC9458483
- OpenAlex
- W4297848564
- Cited by
- 55
- References
- 2
- Citations by year
- 2026: 11 · 2025: 20 · 2024: 13 · 2023: 9 · 2022: 2
- FWCI
- 3.33
- Type
- journal article
- Language
- en
- Open access
- diamond
- doi.org
- Locations
- Urban Informatics (publishedVersion, cc-by)
- PubMed Central (publishedVersion, cc-by)
- PubMed (publishedVersion)
- Funders
- Directorate for Geosciences (1833225)
- Topics
- Physical Sciences › Environmental Science › Environmental Engineering › Urban Heat Island Mitigation
- Social Sciences › Urban Studies › Smart Cities and Technologies
- Physical Sciences › Environmental Science › Global and Planetary Change › Land Use and Ecosystem Services
- Keywords
- urban heat island, CyberGIS, urban sensor networks, Landsat 8, random forest regression, high-frequency sensor data, PM2.5, humidity, Chicago
About these checks
Registry, retraction, Cites and statistics results are computed, not judged, with one exception: a printed reference that no index lists is read once by a model before it counts as a citation error. Claims are extracted by a model and kept only when their quote appears verbatim in the text; each cited source is then checked, with a model’s help, for whether it says what the claim relies on. Those verdicts can be wrong — read the claim’s quote and the cited source before relying on one.
Statistics and arithmetic are recomputed, not judged.
Confidence bands are shown only for fields calibrated on our annotated test set. None is calibrated yet, so no band is shown.
What counts as a claim ›How we measure confidence ›How we check this ›
Are you an author, or do you see a problem with this page? Request a review
