

The DOI matches its Crossref record; 92 of the 92 references it cites were found in a registry or an index.
CHARGE and Kabuki Syndromes: Gene-Specific DNA Methylation Signatures Identify Epigenetic Mechanisms Linking These Clinically Overlapping Conditions
Open accessAbstract
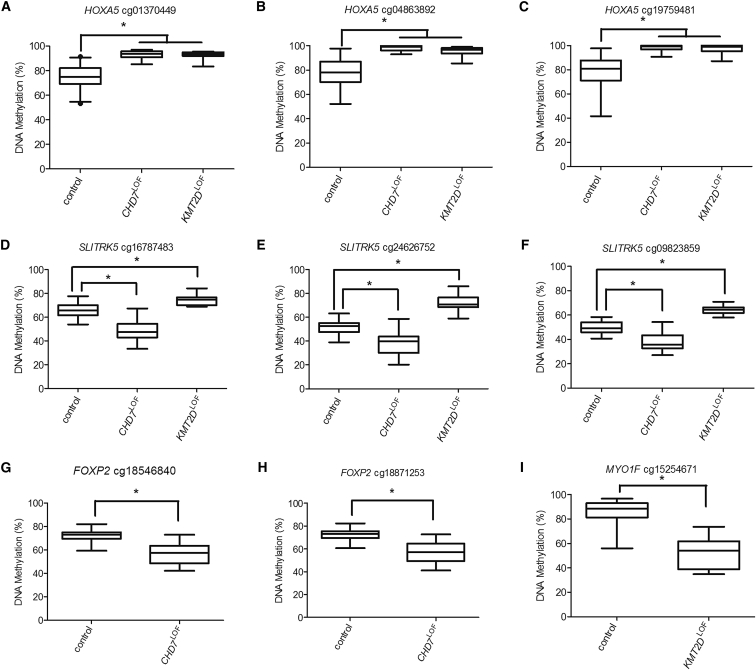
Epigenetic dysregulation has emerged as a recurring mechanism in the etiology of neurodevelopmental disorders. Two such disorders, CHARGE and Kabuki syndromes, result from loss of function mutations in chromodomain helicase DNA-binding protein 7 ( CHD7 LOF ) and lysine (K) methyltransferase 2D ( KMT2D LOF ), respectively. Although these two syndromes are clinically distinct, there is significant phenotypic overlap. We therefore expected that epigenetically driven developmental pathways regulated by CHD7 and KMT2D would overlap and that DNA methylation (DNAm) alterations downstream of the mutations in these genes would identify common target genes, elucidating a mechanistic link between these two conditions, as well as specific target genes for each disorder. Genome-wide DNAm profiles in individuals with CHARGE and Kabuki syndromes with CHD7 LOF or KMT2D LOF identified distinct sets of DNAm differences in each of the disorders, which were used to generate two unique, highly specific and sensitive DNAm signatures. These DNAm signatures were able to differentiate pathogenic mutations in these two genes from controls and from each other. Analysis of the DNAm targets in each gene-specific signature identified both common gene targets, including homeobox A5 ( HOXA5 ), which could account for some of the clinical overlap in CHARGE and Kabuki syndromes, as well as distinct gene targets. Our findings demonstrate how characterization of the epigenome can contribute to our understanding of disease pathophysiology for epigenetic disorders, paving the way for explorations of novel therapeutics.
Overview
The claims and statistics of this paper haven’t been checked yet.
Run the check — free, no account needed. It reads the open-access text and checks the sources it cites.
Integrity signals
Registry
Cites
Statistics
Figures
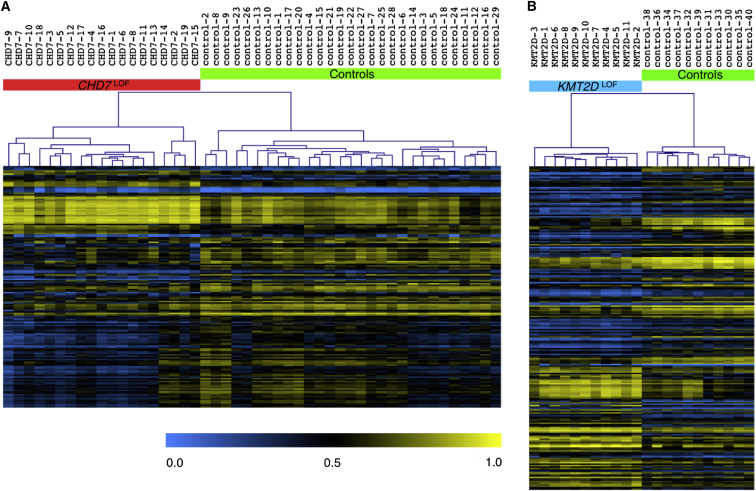
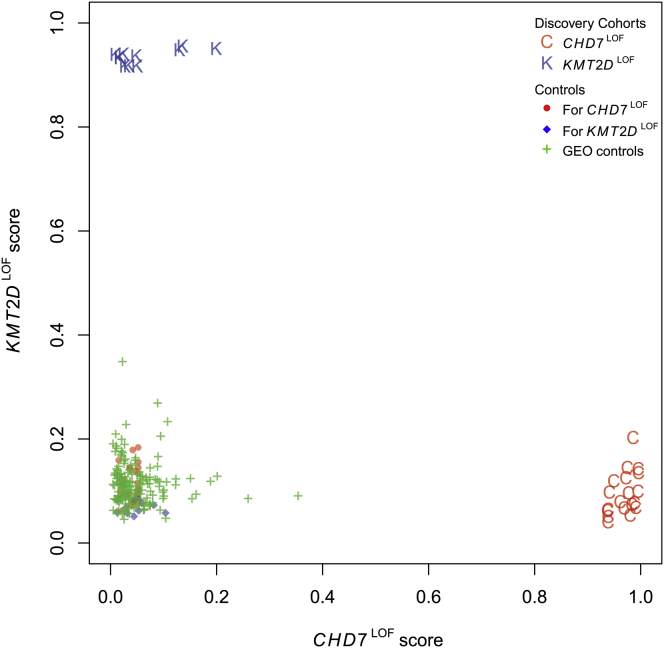
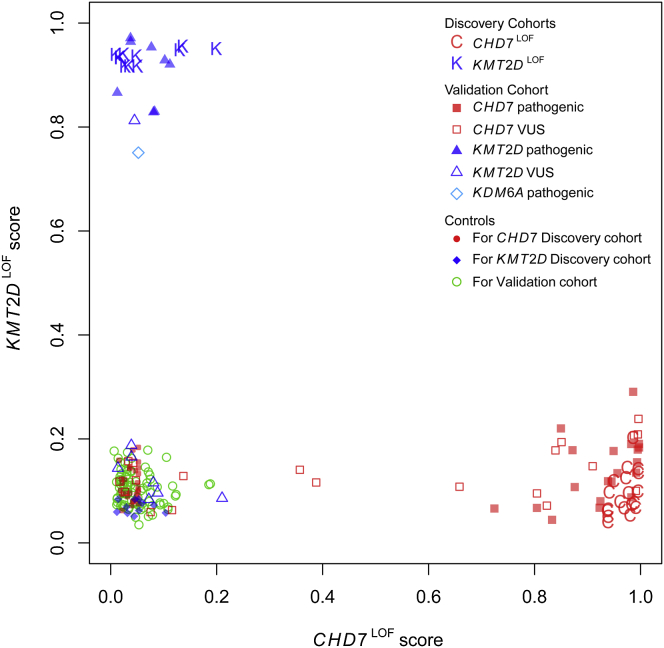
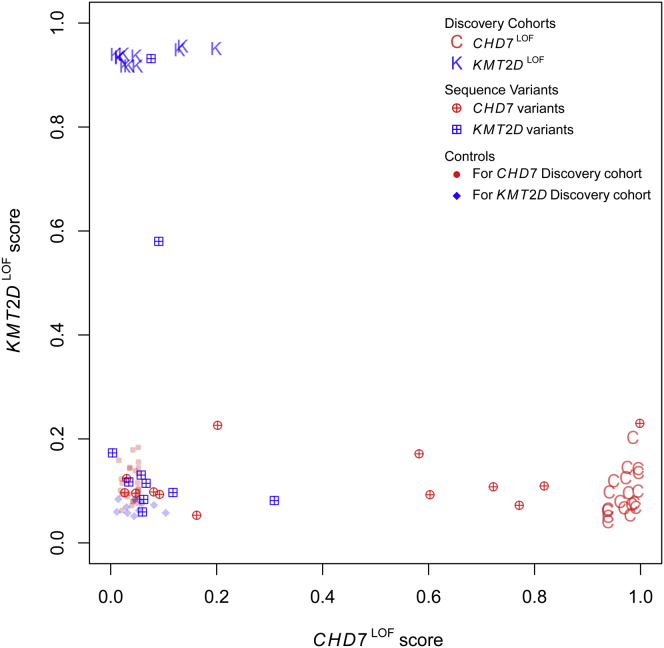
Verification
Claims the paper makes
The claims and statistics of this paper haven’t been checked yet.
Run the check — free, no account needed. It reads the open-access text and checks the sources it cites.
Claims other papers make about this one
Each is checked against this paper’s own text: does it say what the citing paper says it does?
In the citing paper
“Direct functional genomic exploration of accessible and disease-relevant tissues from patients using RNA sequencing and DNA methylation assays30,31 can identify previously cryptic causal genetic variants, particularly in under-explored regions outside protein-coding genes32,33.”
From A brief history of human disease genetics (2020) · cites this paper as [31]
Self-check
Percentages, sums and reported differences re-computed from the paper’s own numbers.
The self-check needs the paper’s full text.
Citations
Cites
1 retracted
Hanna, G. L., Liu, Y., Isaacs, Y. E., Ayoub, A. M., Torres, J. J., O’Hara, N. B., & Gehring, W. J. (2016) · Journal of the American Academy of Child & Adolescent Psychiatry · doi:10.1016/j.jaac.2016.06.012 · Cited by 30
Retractedlimma powers differential expression analyses for RNA-sequencing and microarray studies
Ritchie, M. E., Phipson, B., Wu, D., Hu, Y., Law, C. W., Shi, W., & Smyth, G. K. (2015) · Nucleic Acids Research · doi:10.1093/nar/gkv007 · Cited by 40,458
Richards, S., Aziz, N., Bale, S., Bick, D., Das, S., Gastier-Foster, J., Grody, W. W., Hegde, M., Lyon, E., Spector, E., et al. (2015) · Genetics in Medicine · doi:10.1038/gim.2015.30 · Cited by 32,594
A method and server for predicting damaging missense mutations.
Adzhubei, I. A., Schmidt, S., Peshkin, L., Ramensky, V. E., Gerasimova, A., Bork, P., Kondrashov, A. S., & Sunyaev, S. R. (2010) · Nature Methods · doi:10.1038/nmeth0410-248 · Cited by 13,194
The Human Genome Browser at UCSC
Kent, W. J., Sugnet, C. W., Furey, T. S., Roskin, K. M., Pringle, T. H., Zahler, A. M., & Haussler, A. D. (2002) · Genome Research · doi:10.1101/gr.229102 · Cited by 10,400
Integrative analysis of 111 reference human epigenomes
Roadmap Epigenomics Consortium, Kundaje, A., Meuleman, W., Ernst, J., Bilenky, M., Yen, A., Heravi-Moussavi, A., Kheradpour, P., Zhang, Z., Wang, J., et al. (2015) · Nature · doi:10.1038/nature14248 · Cited by 6,368
GREAT improves functional interpretation of cis-regulatory regions
McLean, C. Y., Bristor, D., Hiller, M., Clarke, S. L., Schaar, B. T., Lowe, C. B., Wenger, A. M., & Bejerano, G. (2010) · Nature Biotechnology · doi:10.1038/nbt.1630 · Cited by 4,502
Gene Ontology Consortium: going forward
The Gene Ontology Consortium (2015) · Nucleic Acids Research · doi:10.1093/nar/gku1179 · Cited by 3,492
Long Noncoding RNA as Modular Scaffold of Histone Modification Complexes
Tsai, M.-C., Manor, O., Wan, Y., Mosammaparast, N., Wang, J. K., Lan, F., Shi, Y., Segal, E., & Chang, H. Y. (2010) · Science · doi:10.1126/science.1192002 · Cited by 3,290 · cited 1×
“HOTAIRM is a long non-coding RNA (lncRNA), which has been found to interact with different chromatinmodifying complexes.(78) Recent work by Wang and Dostie (2016) found that HOTAIRM1 contributes to three-dimensional changes in chromatin organization required for the temporal collinear activation of HOXA genes.”
BackgroundMutationTaster evaluates disease-causing potential of sequence alterations
Schwarz, J. M., Rödelsperger, C., Schuelke, M., & Seelow, D. (2010) · Nature Methods · doi:10.1038/nmeth0810-575 · Cited by 2,975
Cited by
Sorted by citations
A brief history of human disease genetics
Claussnitzer, M., Cho, J. H., Collins, R., Cox, N. J., Dermitzakis, E. T., Hurles, M. E., Kathiresan, S., Kenny, E. E., Lindgren, C. M., MacArthur, D. G., et al. (2020) · Nature · doi:10.1038/s41586-019-1879-7 · Cited by 697
Monies, D., Abouelhoda, M. I., Alsayed, M. D., Al‐Hassnan, Z. N., Alotaibi, M., Kayyali, H. R., Al‐Owain, M. A., Shah, A., Rahbeeni, Z. A., Al–Muhaizea, M. A., et al. (2017) · Human Genetics · doi:10.1007/s00439-017-1821-8 · Cited by 306
Kabuki syndrome: international consensus diagnostic criteria
Adam, M. P., Banka, S., Bjornsson, H. T., Bodamer, O. A., Chudley, A. E., Harris, J., Kawame, H., Lanpher, B. C., Lindsley, A., Merla, G., et al. (2018) · Journal of Medical Genetics · doi:10.1136/jmedgenet-2018-105625 · Cited by 245
Aref-Eshghi, E., Bend, E. G., Colaiacovo, S., Caudle, M., Chakrabarti, R., Napier, M., Brick, L., Brady, L., Carere, D. A., Levy, M. A., et al. (2019) · The American Journal of Human Genetics · doi:10.1016/j.ajhg.2019.03.008 · Cited by 201
Clinical epigenomics: genome-wide DNA methylation analysis for the diagnosis of Mendelian disorders
Sadiković, B., Levy, M. A., Kerkhof, J., Aref‐Eshghi, E., Schenkel, L. C., Stuart, A., McConkey, H., Henneman, P., Venema, A., Schwartz, C. E., et al. (2021) · Genetics in Medicine · doi:10.1038/s41436-020-01096-4 · Cited by 216
Metadata
- Authors
- Butcher, D. T., Cytrynbaum, C., Turinsky, A. L., Siu, M. T., Inbar-Feigenberg, M., Mendoza-Londono, R., Chitayat, D., Walker, S., Machado, J., Caluseriu, O., Dupuis, L., Grafodatskaya, D., Reardon, W., Gilbert-Dussardier, B., Verloes, A., Bilan, F., Milunsky, J. M., Basran, R., Papsin, B., Stockley, T. L., Scherer, S. W., Choufani, S., Brudno, M., & Weksberg, R.
- Affiliations
- Hospital for Sick Children (CA)
- University of Toronto (CA)
- Mount Sinai Hospital (CA)
- Manitoba Harm Reduction Network (CA)
- University of Alberta (CA)
- McMaster University (CA)
- Children's Health Ireland at Crumlin (IE)
- Center for Human Genetics (US)
- University Health Network (CA)
- Corresponding author
- Weksberg, Rosanna
- ORCID
- Venue
- The American Journal of Human Genetics
- Publisher
- Elsevier BV
- Published
- 2017-05
- Volume
- 100
- Issue
- 5
- Pages
- 773-788
- ISSN
- 0002-9297 (ISSN-L)
- PMC
- PMC5420353
- OpenAlex
- W2610666651
- Cited by
- 200
- References
- 92
- Citations by year
- 2026: 12 · 2025: 12 · 2024: 17 · 2023: 27 · 2022: 26 · 2021: 24 · 2020: 29 · 2019: 29 · 2018: 15 · 2017: 7
- FWCI
- 13.35
- Type
- journal article
- Language
- en
- Open access
- hybrid
- doi.org
- Licence
- Locations
- The American Journal of Human Genetics (publishedVersion, cc-by-nc-nd)
- PubMed Central (publishedVersion, cc-by-nc-nd)
- PubMed (publishedVersion)
- Topics
- Health Sciences › Medicine › Genetics (clinical) › Congenital Ear and Nasal Anomalies
- Life Sciences › Biochemistry, Genetics and Molecular Biology › Molecular Biology › Epigenetics and DNA Methylation
- Life Sciences › Biochemistry, Genetics and Molecular Biology › Genetics › Genomics and Rare Diseases
- Keywords
- CHARGE syndrome, Kabuki syndrome, CHD7, KMT2D, DNA methylation signature, epigenetic dysregulation, neurodevelopmental disorders, loss-of-function mutations, HOXA5, phenotypic overlap, epigenetic disorders, disease pathophysiology
- MeSH terms
- Abnormalities, Multiple, Cell Line, DNA Helicases, DNA-Binding Proteins, Face, Gene Expression Regulation, Hematologic Diseases, Humans, Leukocytes, Mononuclear, Mutation, Neoplasm Proteins, Sensitivity and Specificity, Reproducibility of Results, Vestibular Diseases, Genome, Human, Homeodomain Proteins, DNA Methylation, Epigenesis, Genetic, CHARGE Syndrome
About these checks
Registry, retraction, Cites and statistics results are computed, not judged, with one exception: a printed reference that no index lists is read once by a model before it counts as a citation error. Claims are extracted by a model and kept only when their quote appears verbatim in the text; each cited source is then checked, with a model’s help, for whether it says what the claim relies on. Those verdicts can be wrong — read the claim’s quote and the cited source before relying on one.
Statistics and arithmetic are recomputed, not judged.
Confidence bands are shown only for fields calibrated on our annotated test set. None is calibrated yet, so no band is shown.
What counts as a claim ›How we measure confidence ›How we check this ›
Are you an author, or do you see a problem with this page? Request a review
