

The DOI matches its Crossref record.
Efficiency optimisation and converterless PV integration by applying a dynamic voltage on an LVDC backbone
Overview
The claims and statistics of this paper haven’t been checked yet.
Run the check — free, no account needed. It reads the open-access text and checks the sources it cites.
Integrity signals
Registry
Cites
Statistics
Figures

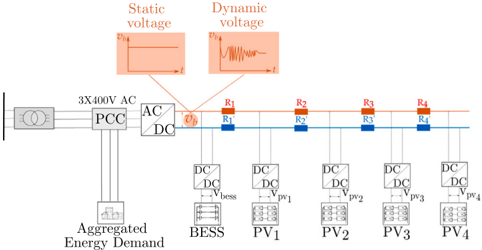
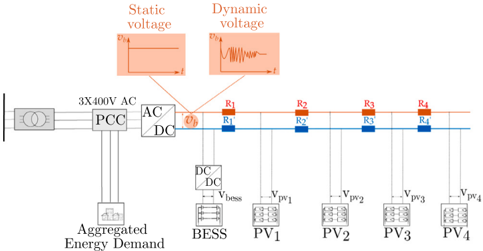
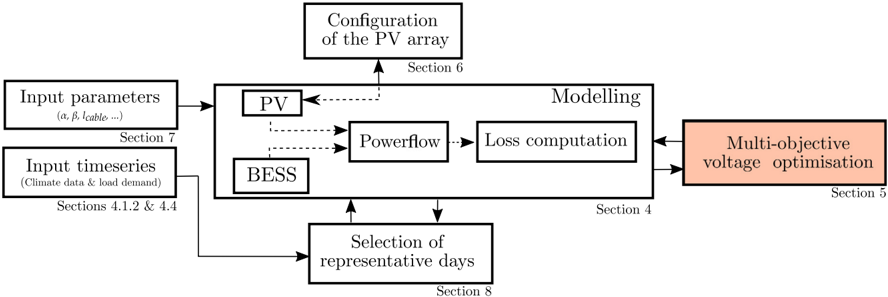
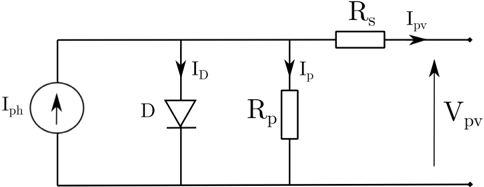
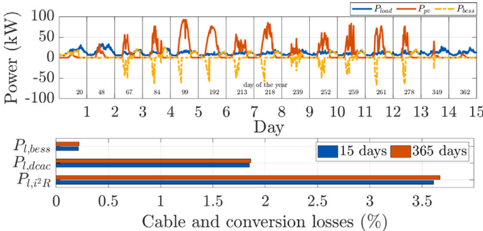
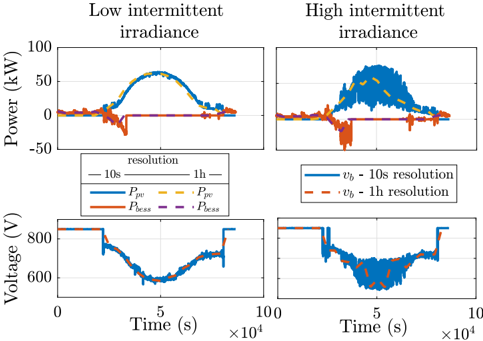
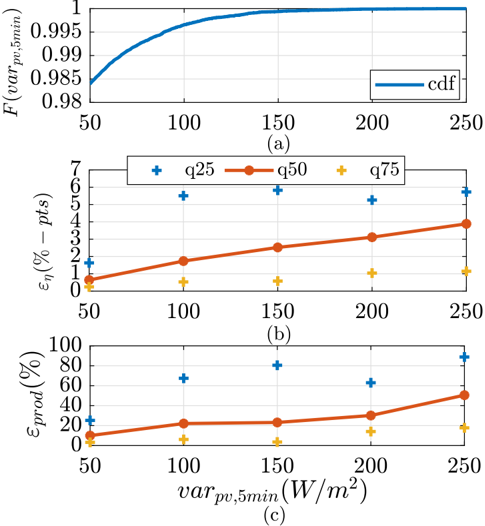
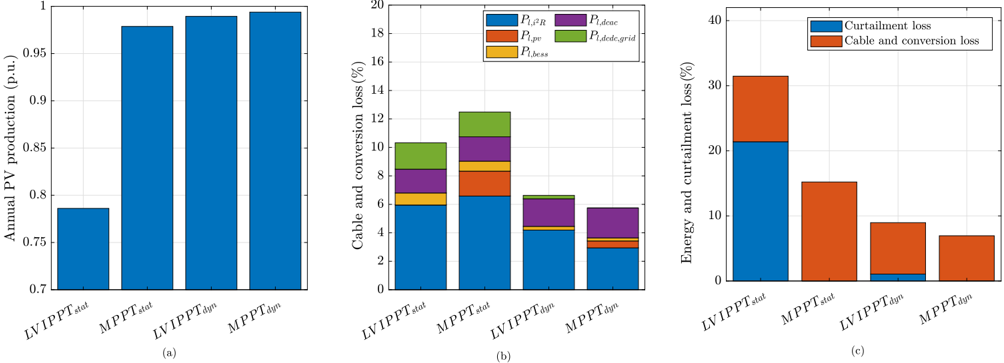
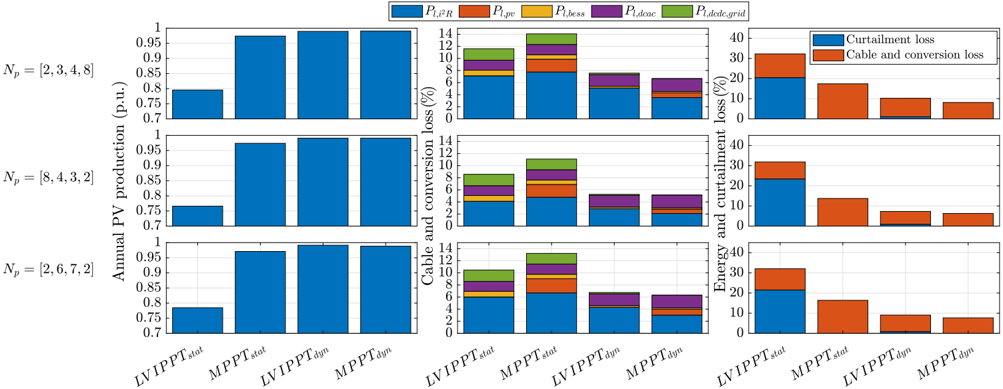
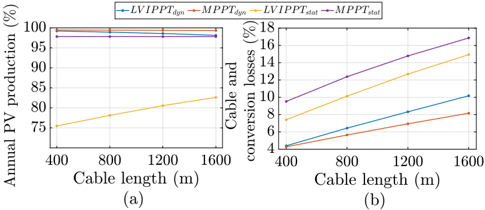
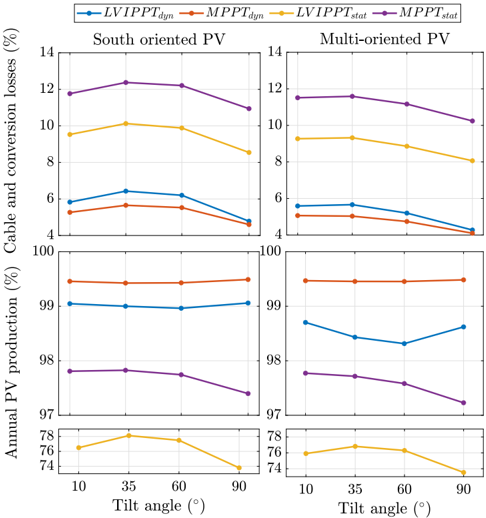
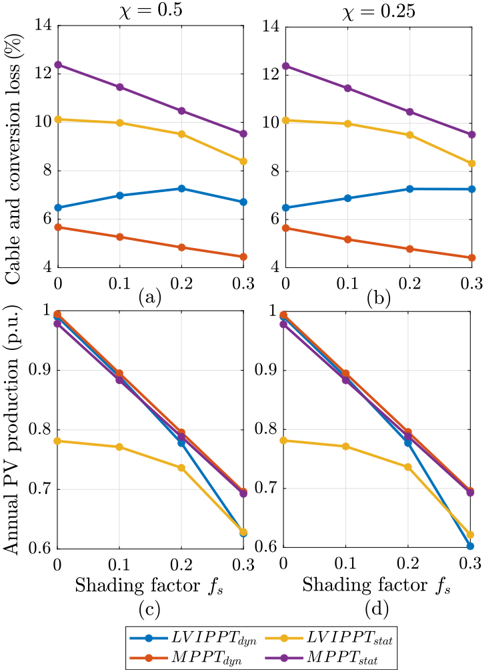
Verification
Claims the paper makes
The claims and statistics of this paper haven’t been checked yet.
Run the check — free, no account needed. It reads the open-access text and checks the sources it cites.
Claims other papers make about this one
Each is checked against this paper’s own text: does it say what the citing paper says it does?
In the citing paper
“These studies propose using a DC backbone as an alternative to alternative current (AC) backbones in smart grids by connecting various DC-based renewable energy generation systems, storage systems [39], and loads such as EV chargers [40,41].”
From Smart, circular and renewable: The role of cooperative governance in accelerating a sustainable energy transition (2025) · cites this paper as [40]
Self-check
Percentages, sums and reported differences re-computed from the paper’s own numbers.
The self-check needs the paper’s full text.
Citations
Cites
No references could be resolved yet.
Research works printed but not linked: 33
- Zhang, 2009, Technical and economic impacts of active management on distribution network, Int J Electr Power Energy Syst, 31, 130, 10.1016/j.ijepes.2008.10.016 · DOI
- Cleenwerck, 2022, An approach to the impedance modelling of low-voltage cables in digital twins, Electr Power Syst Res, 210, 10.1016/j.epsr.2022.108075 · DOI
- Cleenwerck, 2023, Impact assessment of electric vehicle charging in an AC and DC microgrid: A comparative study, Energies, 16, 3205, 10.3390/en16073205 · DOI · Paper page
- Azaioud, 2021, A low-voltage DC backbone with aggregated RES and BESS: Benefits compared to a traditional low-voltage AC system, Energies, 14, 1420, 10.3390/en14051420 · DOI · Paper page
- McCormick, 2018, The effect of intermittent solar radiation on the performance of pv systems, Sol Energy, 171, 667, 10.1016/j.solener.2018.06.043 · DOI
- Elvira, 2018, Efficiency optimization of a variable bus voltage DC microgrid, Energies, 11, 3090, 10.3390/en11113090 · DOI
- Teo, 2018, Impact of Partial Shading on the P-V Characteristics and the Maximum Power of a Photovoltaic String, Energies, 11, 1860, 10.3390/en11071860 · DOI
- Renaudineau, 2015, A PSO-Based Global MPPT Technique for Distributed PV Power Generation, IEEE Trans Ind Electron, 62, 1047, 10.1109/TIE.2014.2336600 · DOI
- Ravyts, 2019, Review on Building-Integrated Photovoltaics Electrical System Requirements and Module-Integrated Converter Recommendation, Energies, 12, 1532, 10.3390/en12081532 · DOI
- Zhang, 2020, Global sensitivity analysis for key parameters identification of net-zero energy buildings for grid interaction optimization, Appl Energy, 279, 10.1016/j.apenergy.2020.115820 · DOI
- Bird, 2016, Wind and solar energy curtailment: A review of international experience, Renew Sustain Energy Rev, 65, 577, 10.1016/j.rser.2016.06.082 · DOI
- Ishaque, 2011, Simple, fast and accurate two-diode model for photovoltaic modules, Sol Energy Mater Sol Cells, 95, 586, 10.1016/j.solmat.2010.09.023 · DOI
- Manuel Godinho Rodrigues, 2018, Simulation and Comparison of Mathematical Models of PV Cells with Growing Levels of Complexity, Energies, 11, 10.3390/en11112902 · DOI
- Ruschel, 2021, Experimental analysis of the single diode model parameters dependence on irradiance and temperature, Sol Energy, 217, 134, 10.1016/j.solener.2021.01.067 · DOI
- Villalva, 2009, Comprehensive approach to modeling and simulation of photovoltaic arrays, IEEE Trans Power Electron, 24, 1198, 10.1109/TPEL.2009.2013862 · DOI
- Kaldellis, 2014, Temperature and wind speed impact on the efficiency of PV installations. Experience obtained from outdoor measurements in Greece, Renew Energy, 66, 612, 10.1016/j.renene.2013.12.041 · DOI
- Azaioud, 2020, Benefit evaluation of PV orientation for individual residential consumers, Energies, 13, 10.3390/en13195122 · DOI
- Hay JE. Calculation if the solar radiation incident on inclined surfaces. In: Proceedings First Canadian solar radiation data workshop, Toronto. Ontario, Canada. 1978.
- Shepherd, 1965, Design of primary and secondary cells: II. An equation describing battery discharge, J. Electrochem. Soc., 112, 657, 10.1149/1.2423659 · DOI
- Ding, 2016, Adaptive DC-link voltage control of two-stage photovoltaic inverter during low voltage ride-through operation, IEEE Trans Power Electron, 31, 4182, 10.1109/TPEL.2015.2469603 · DOI
- Ahmadi, 2014, Improving the performance of a line regulating converter in a converter-dominated DC microgrid system, IEEE Trans Smart Grid, 5, 2553, 10.1109/TSG.2014.2319267 · DOI
- Hava, 1998, Carrier-based PWM-VSI overmodulation strategies: analysis, comparison, and design, IEEE Trans Power Electron, 13, 674, 10.1109/63.704136 · DOI
- Gaing, 2003, Particle swarm optimization to solving the economic dispatch considering the generator constraints, IEEE Trans Power Syst, 18, 1187, 10.1109/TPWRS.2003.814889 · DOI
- Bidram, 2012, Control and circuit techniques to mitigate partial shading effects in photovoltaic arrays, IEEE J Photovolt, 2, 532, 10.1109/JPHOTOV.2012.2202879 · DOI
- Kermadi, 2017, Artificial intelligence-based maximum power point tracking controllers for photovoltaic systems: Comparative study, Renew Sustain Energy Rev, 69, 369, 10.1016/j.rser.2016.11.125 · DOI
- Lalwani, 2013, A comprehensive survey: Applications of multi-objective particle swarm optimization (MOPSO) algorithm, Trans combinatorics, 2, 39
- Ananth, 2021, A review of different optimisation techniques for solving single and multi-objective optimisation problem in power system and mostly unit commitment problem, Int J Ambient Energy, 42, 1676, 10.1080/01430750.2019.1611632 · DOI
- Kolmogorov, 1933, Sulla determinazione empirica di una lgge di distribuzione, Inst. Ital. Attuari, Giorn., 4, 83
- Dimitrova, 2020, Computing the Kolmogorov-Smirnov distribution when the underlying CDF is purely discrete, mixed, or continuous, J Stat Softw, 95, 1, 10.18637/jss.v095.i10 · DOI
- Al-Sumaiti, 2019, Stochastic PV model for power system planning applications, IET Renew Power Gener, 13, 3168, 10.1049/iet-rpg.2019.0345 · DOI
- Silva, 2021, Calculation of the Shading Factors for Solar Modules with Matlab, Energies, 14, 10.3390/en14154713 · DOI
- Seyedmahmoudian, 2013, Analytical modeling of partially shaded photovoltaic systems, Energies, 6, 128, 10.3390/en6010128 · DOI
- Poncelet, 2017, Selecting representative days for capturing the implications of integrating intermittent renewables in generation expansion planning problems, IEEE Trans Power Syst, 32, 1936, 10.1109/TPWRS.2016.2596803 · DOI
Cited by
Sorted by citations
Van Opstal, W., Bocken, N., & Brusselaers, J. (2025) · Energy Research & Social Science · doi:10.1016/j.erss.2025.104049 · Cited by 20
Metadata
- Authors
- Azaioud, H., Farnam, A., Knockaert, J., Vandevelde, L., & Desmet, J.
- Venue
- Applied Energy
- Publisher
- Elsevier BV
- Published
- 2024-02
- Volume
- 356
- Pages
- 122416
- ISSN
- 0306-2619
- Cited by
- 12
- References
- 0
- Language
- en
About these checks
Registry, retraction, Cites and statistics results are computed, not judged, with one exception: a printed reference that no index lists is read once by a model before it counts as a citation error. Claims are extracted by a model and kept only when their quote appears verbatim in the text; each cited source is then checked, with a model’s help, for whether it says what the claim relies on. Those verdicts can be wrong — read the claim’s quote and the cited source before relying on one.
Statistics and arithmetic are recomputed, not judged.
Confidence bands are shown only for fields calibrated on our annotated test set. None is calibrated yet, so no band is shown.
What counts as a claim ›How we measure confidence ›How we check this ›
Are you an author, or do you see a problem with this page? Request a review
