

The DOI matches its Crossref record; 12 of the 12 references it cites were found in a registry or an index.
Comparison of regulated emission factors of Euro 6 LDV in Nordic temperatures and cold start conditions: Diesel- and gasoline direct-injection
Open accessAbstract
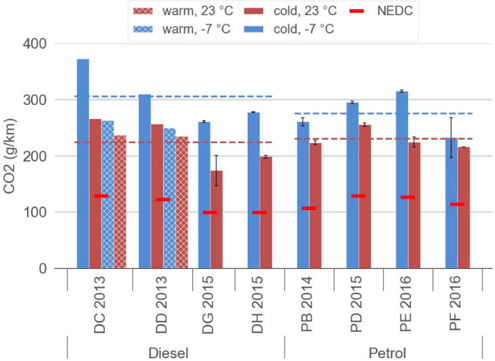
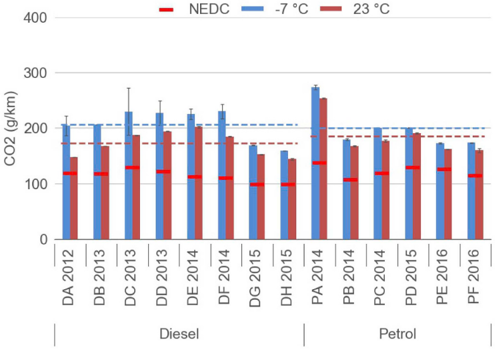
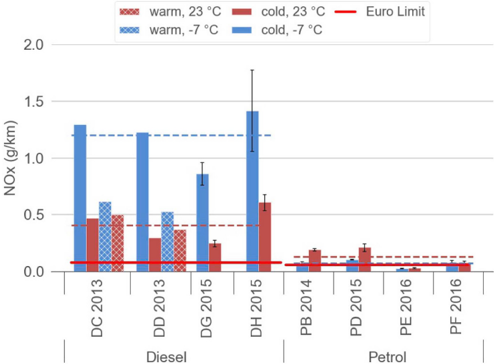
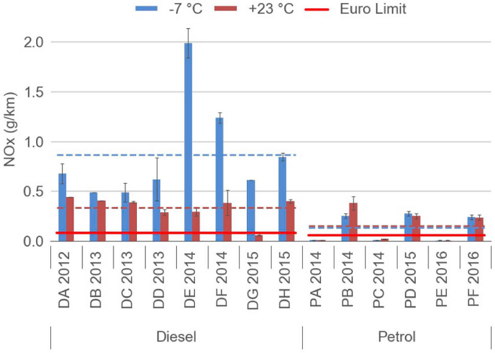
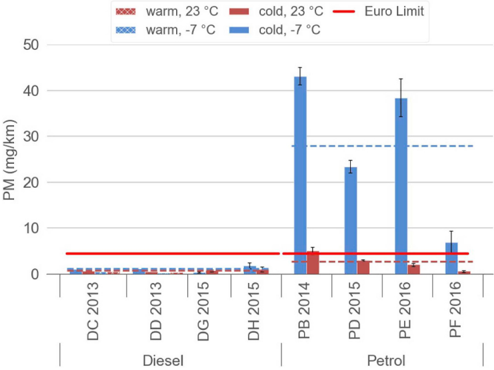
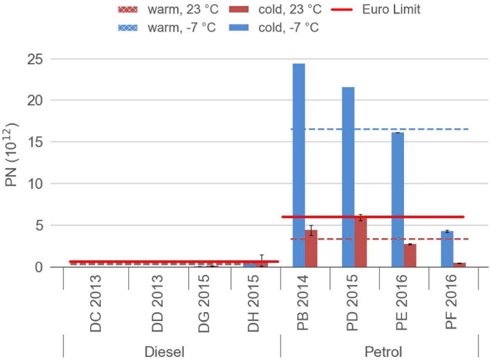
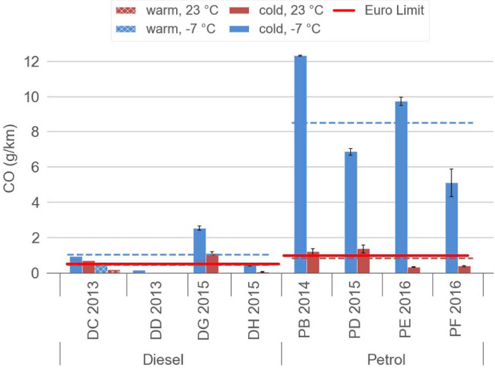
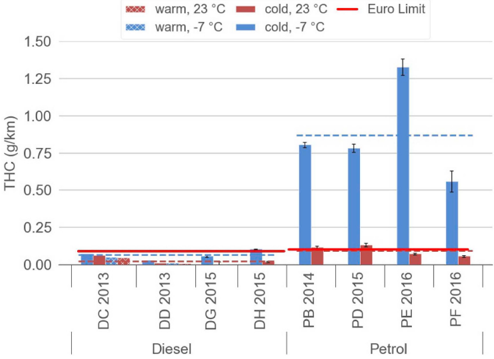
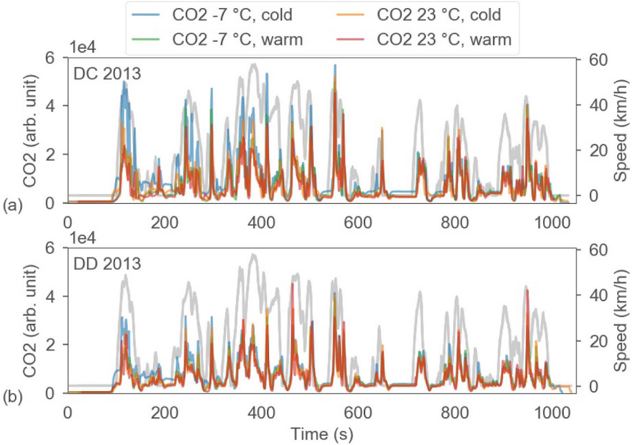
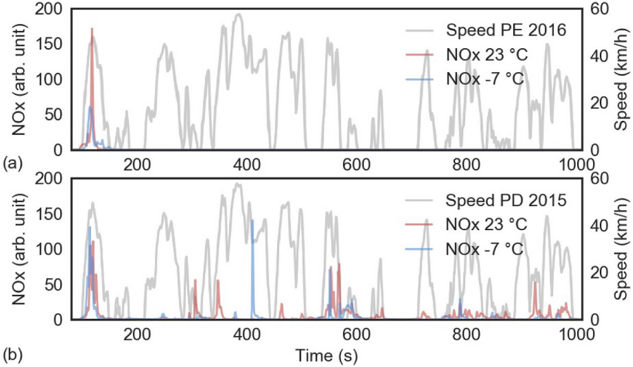
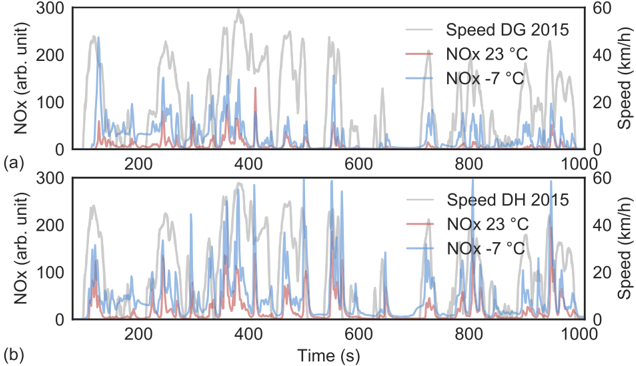
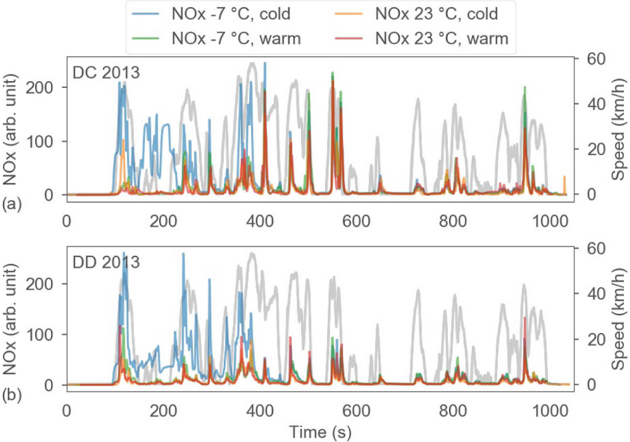
Local air pollution in Norwegian wintertime is characterized by an increase in NO 2 concentrations, due to poor dispersion and increased vehicle emissions. The focus of this study is therefore the characterisation of exhaust vehicle emissions in cold ambient temperatures. Euro 6 Gasoline Direct Injection (GDI) cars and diesel cars were tested in the laboratory in cold temperatures, including with cold start of the engine. Results show high emissions of CO 2 , PM and NO x . For the first time, we report also elevated NO x values for GDI vehicles. Further measurements are required to investigate whether these results are the beginning of a new trend of high NO x emissions from GDIs, or if these results represent singular events, but it may indicate that further NO x traps or catalysts are required for these vehicles. Understanding the relationship of cold ambient temperatures and vehicle emissions is also particularly important for air quality dispersion modelling, which do not currently account for emission temperature dependence.
Overview
The claims and statistics of this paper haven’t been checked yet.
Run the check — free, no account needed. It reads the open-access text and checks the sources it cites.
Integrity signals
Registry
Cites
Statistics
Figures

Verification
Claims the paper makes
The claims and statistics of this paper haven’t been checked yet.
Run the check — free, no account needed. It reads the open-access text and checks the sources it cites.
Claims other papers make about this one
Each is checked against this paper’s own text: does it say what the citing paper says it does?
The source backs part of the claim, not all of it — or backs it for a different population, condition or comparison.
In the citing paper
“Under extremely cold conditions, pollution emission rates from domestic heating and energy production are generally high, and traffic emissions at cold temperatures can release comparatively more pollutants than under higher temperatures due to inefficient combustion conditions (e.g., Brett et al., 2025;Weber et al., 2019;Zhu et al., 2022).”
From In situ vertical observations of the layered structure of air pollution in a continental high-latitude urban boundary layer during winter (2025) · cites this paper as Weber et al., 2019
Experimental — accuracy not yet measuredThe source backs part of the claim, not all of it — or backs it for a different population, condition or comparison.
In the citing paper
“Under extremely cold conditions, pollution emission rates from domestic heating and energy production are generally high, and traffic emissions at cold temperatures can release comparatively more pollutants than under higher temperatures due to inefficient combustion conditions (e.g., Brett et al., 2025;Weber et al., 2019;Zhu et al., 2022).”
From In situ vertical observations of the layered structure of air pollution in a continental high-latitude urban boundary layer during winter (2025) · cites this paper as Weber et al., 2019
Experimental — accuracy not yet measured
Self-check
Percentages, sums and reported differences re-computed from the paper’s own numbers.
The self-check needs the paper’s full text.
Citations
Cites
The ARTEMIS European driving cycles for measuring car pollutant emissions
André, M. (2004) · The Science of The Total Environment · doi:10.1016/j.scitotenv.2004.04.070 · Cited by 686
Roberts, A., Brooks, R., & Shipway, P. H. (2014) · Energy Conversion and Management · doi:10.1016/j.enconman.2014.03.002 · Cited by 425
Weilenmann, M. F., Favez, J.-Y., & Alvarez, R. (2009) · Atmospheric Environment · doi:10.1016/j.atmosenv.2009.02.005 · Cited by 283
Raza, M., Chen, L., Leach, F. C. P., & Ding, S. (2018) · Energies · doi:10.3390/en11061417 · Cited by 233
Real world CO2 and NOx emissions from 149 Euro 5 and 6 diesel, gasoline and hybrid passenger cars
O’Driscoll, R., Stettler, M. E. J., Molden, N., Oxley, T., & ApSimon, H. M. (2017) · The Science of The Total Environment · doi:10.1016/j.scitotenv.2017.11.271 · Cited by 221
Impact of cold temperature on Euro 6 passenger car emissions
Suárez‐Bertoa, R., & Astorga, C. (2017) · Environmental Pollution · doi:10.1016/j.envpol.2017.10.096 · Cited by 206
Low-temperature cold-start gaseous emissions of late technology passenger cars
Dardiotis, C. K., Martini, G., Marotta, A., & Manfredi, U. (2013) · Applied Energy · doi:10.1016/j.apenergy.2013.04.093 · Cited by 168
Two-stroke scooters are a dominant source of air pollution in many cities
Platt, S. M., Haddad, I. E., Pieber, S. M., Huang, R., Zardini, A. A., Clairotte, M., Suárez‐Bertoa, R., Barmet, P., Pfaffenberger, L., Wolf, R., et al. (2014) · Nature Communications · doi:10.1038/ncomms4749 · Cited by 154
Gordon, T. D., Presto, A. A., Nguyen, N. T., Robertson, W. H., Na, K., Sahay, K., Zhang, M., Maddox, C., Rieger, P. L., Chattopadhyay, S., et al. (2014) · Atmospheric chemistry and physics · doi:10.5194/acp-14-4643-2014 · Cited by 141
Ko, J., Jin, D., Jang, W., Myung, C.-L., Kwon, S., & Park, S. (2016) · Applied Energy · doi:10.1016/j.apenergy.2016.11.105 · Cited by 125
Research works printed but not linked: 3
- Air quality in Europe 2017, reportEEA Report 13. doi:10.2800/358908. URL https://www.eea.europa.eu/publications/air-quality-in-europe-2017. · DOI
- EC. 692/2008, 2008, Comission Regulation (EC) No 692/2008 of 18 July 2008 implementing and amending Regulation (EC) No 715/2007 of the European Parliament and of the Council on type-approval of motor vehicles with respect to emissions from light passenger and commercial vehi, Official Journal of the European Communities
- EP, Regulation (EC) No 715/2007, 2007, 1
Cited by
Sorted by citations
Giechaskiel, B., Joshi, A., Ntziachristos, L. D., & Dilara, P. (2019) · Catalysts · doi:10.3390/catal9070586 · Cited by 114
A Self‐Powered Portable Nanowire Array Gas Sensor for Dynamic NO2 Monitoring at Room Temperature
Wei, S., Li, Z., Murugappan, K., Li, Z., Zhang, F., Gopakumar, A., Lysevych, M., Tan, H. H., Jagadish, C., Tricoli, A., et al. (2022) · Advanced Materials · doi:10.1002/adma.202207199 · Cited by 100
Mera, Z., González, N. E. F., Kindelán, J. C., & López, J.-M. (2020) · Atmospheric Environment · doi:10.1016/j.atmosenv.2020.117878 · Cited by 53
Hall, D., Anderson, D. C., Martin, C. R., Ren, X., Salawitch, R. J., He, H., Canty, T. P., Hains, J. C., & Dickerson, R. R. (2020) · Atmospheric Environment · doi:10.1016/j.atmosenv.2020.117558 · Cited by 44
Giechaskiel, B., Valverde, V., Κοντσές, Α., Suárez‐Bertoa, R., Selleri, T., Melas, A., Otura, M., Ferrarese, C., Martini, G., Balazs, A., et al. (2021) · Atmosphere · doi:10.3390/atmos12081011 · Cited by 40
Metadata
- Authors
- Weber, C., Sundvor, I., & Figenbaum, E.
- Affiliations
- Institute of Transport Economics (NO)
- Corresponding author
- Weber, Christian
- Venue
- Atmospheric Environment
- Publisher
- Elsevier BV
- Published
- 2019-06
- Volume
- 206
- Pages
- 208-217
- ISSN
- 1352-2310 (ISSN-L)
- OpenAlex
- W2920412987
- Cited by
- 67
- References
- 12
- Citations by year
- 2026: 1 · 2025: 8 · 2024: 9 · 2023: 7 · 2022: 11 · 2021: 14 · 2020: 13 · 2019: 4
- FWCI
- 4.79
- Type
- journal article
- Language
- en
- Open access
- hybrid
- doi.org
- Locations
- Atmospheric Environment (publishedVersion, cc-by)
- NORA - Norwegian Open Research Archives (submittedVersion, cc-by)
- Funders
- EMIROAD-programme
- Norwegian Public Roads Administration
- VTT in Helsinki, Finland
- Topics
- Physical Sciences › Engineering › Automotive Engineering › Vehicle emissions and performance
- Physical Sciences › Engineering › Automotive Engineering › Engine and Fuel Emissions
- Physical Sciences › Chemical Engineering › Fluid Flow and Transfer Processes › Advanced Combustion Engine Technologies
- Keywords
- vehicle emissions, cold start, cold ambient temperature, Euro 6, light-duty vehicles, gasoline direct injection, diesel direct injection, NOx emissions, particulate matter, CO2 emissions, NOx trap, winter air pollution, NO2
About these checks
Registry, retraction, Cites and statistics results are computed, not judged, with one exception: a printed reference that no index lists is read once by a model before it counts as a citation error. Claims are extracted by a model and kept only when their quote appears verbatim in the text; each cited source is then checked, with a model’s help, for whether it says what the claim relies on. Those verdicts can be wrong — read the claim’s quote and the cited source before relying on one.
Statistics and arithmetic are recomputed, not judged.
Confidence bands are shown only for fields calibrated on our annotated test set. None is calibrated yet, so no band is shown.
What counts as a claim ›How we measure confidence ›How we check this ›
Are you an author, or do you see a problem with this page? Request a review
How to cite
Cite CoChat for the checks on this page, and the paper for its own findings.
- This page
- CoChat. (2026). Citation check: Comparison of regulated emission factors of Euro 6 LDV in Nordic temperatures and cold start conditions: Diesel- and gasoline direct-injection. https://app.cochat.ai/papers/10.1016/j.atmosenv.2019.02.031
- The paper
- Weber, C., Sundvor, I., & Figenbaum, E. (2019). Comparison of regulated emission factors of Euro 6 LDV in Nordic temperatures and cold start conditions: Diesel- and gasoline direct-injection. Atmospheric Environment. https://doi.org/10.1016/j.atmosenv.2019.02.031
