

The DOI matches its Crossref record; 92 of the 93 references it cites were found in a registry or an index; none of the 32 sources its claims cite is checked for support yet.
Human MAPT knockin mouse models of frontotemporal dementia for the neurodegenerative research community
Open accessAbstract
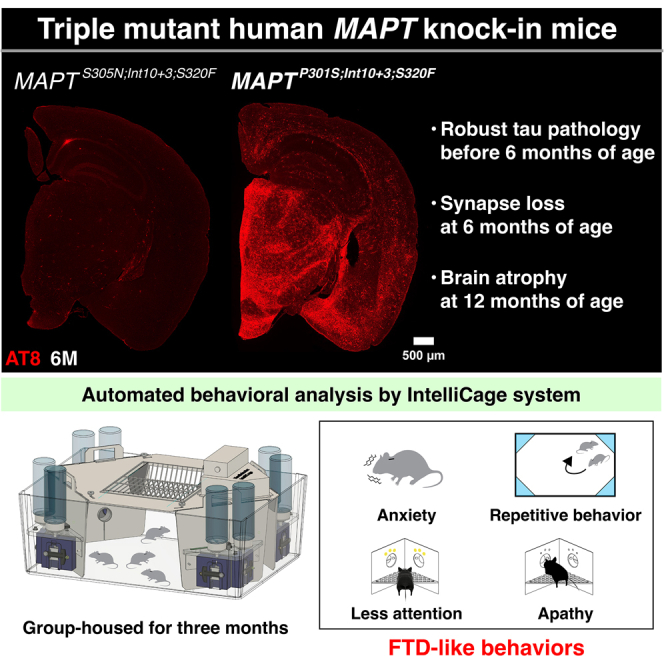
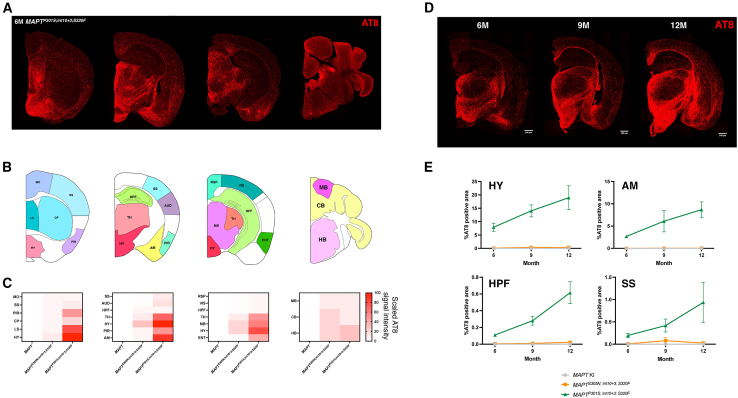
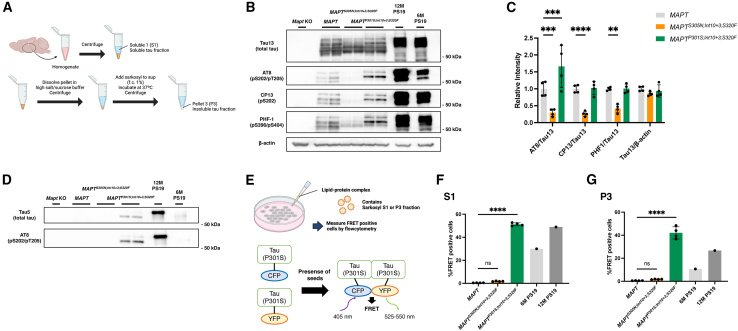
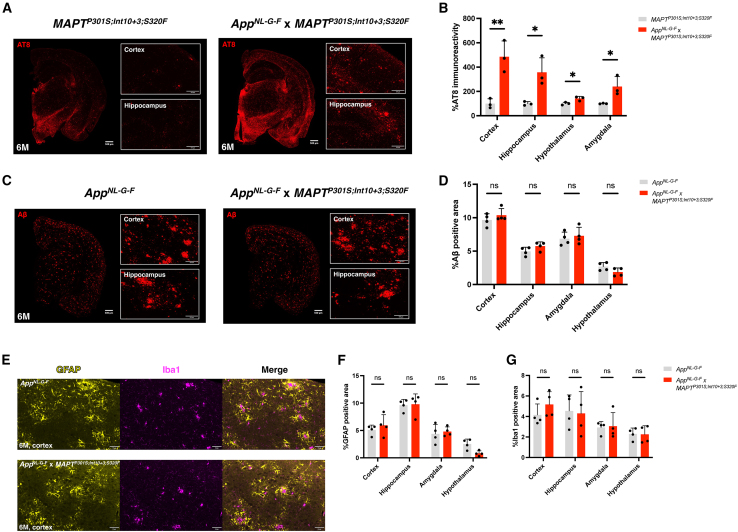
Existing models of frontotemporal dementia (FTD) may not fully recapitulate the pathophysiology of the disease. To generate more pathophysiologically relevant FTD models, we engineered MAPT knockin mouse lines carrying triple mutations, among which the MAPT P301S;Int10+3;S320F line exhibited robust tau pathology starting before 6 months of age. Severe tau accumulation was predominantly observed in the thalamus, hypothalamus, and amygdala with milder involvement of the cortex and hippocampus, leading to synaptic loss, brain atrophy, and FTD-like behavioral abnormalities. Crossbreeding MAPT P301S;Int10+3;S320F mice with App knockin, App NL-G-F , mice markedly enhanced tau pathology in the cortex and hippocampus, highlighting the interplay between β-amyloid and tau. These findings establish the mutant mice as valuable models for investigating the mechanisms underlying FTD and other tauopathies, providing a relevant platform for in vivo drug screening.
Overview
CoChat Summary
TL;DR
The authors generated triple-mutant human MAPT knockin mouse lines and identified MAPTP301S;Int10+3;S320F as a rapidly progressing FTD model with tau pathology before 6 months, synaptic loss, brain atrophy, and FTD-like behaviors. Crossbreeding with AppNL-G-F enhanced cortical and hippocampal tau pathology, supporting use of these mice for studying Aβ-tau interactions and preclinical screening.
Key findings
- MAPTP301S;Int10+3;S320F mice showed robust AT8-positive tau pathology before 6 months, strongest in hypothalamus, amygdala, and thalamus with milder cortex and hippocampus involvement; tau accumulation increased age-dependently, with extrapolation suggesting onset at 4–5 months or earlier in hypothalamus.
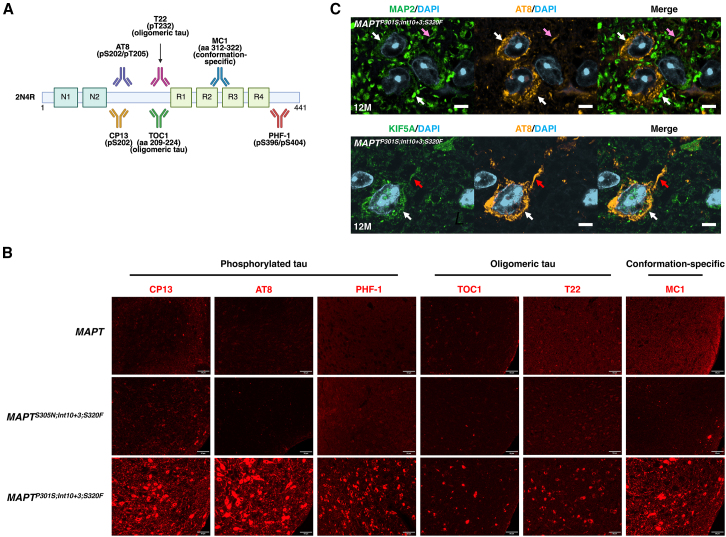
- At 6 months, sarkosyl-insoluble phosphorylated tau was detectable, and S1/P3 fractions from hypothalamus and cortex significantly increased seeding activity in tau biosensor cells, comparable to 12-month-old PS19 mice; TOC1-, T22-, and MC1-positive tau was also present.
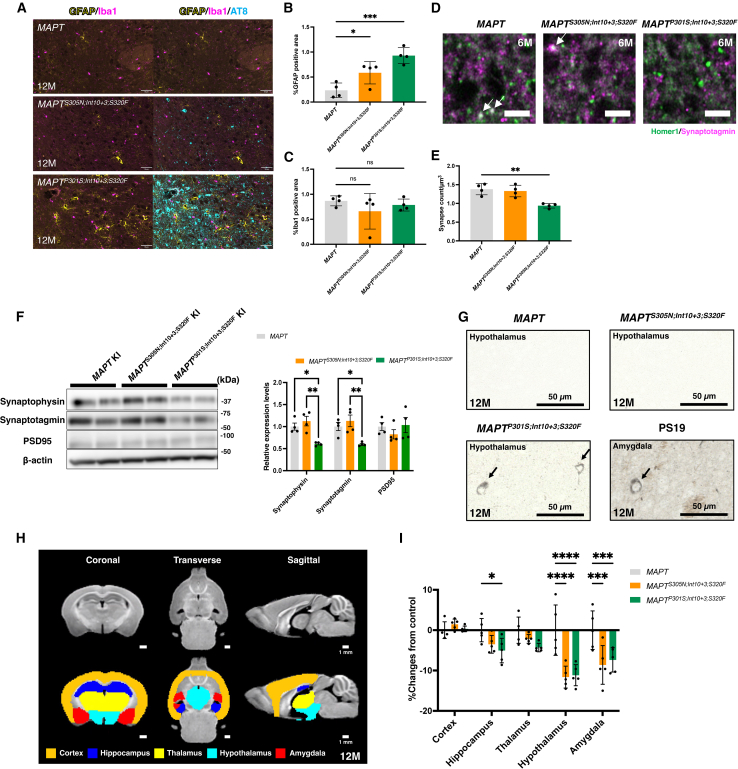
- At 12 months, GFAP was upregulated without Iba1 changes; synaptic puncta colocalization was reduced in hypothalamus at 6 months, synaptophysin and synaptotagmin were reduced at 12 months, Gallyas-positive cells appeared in hypothalamus, and MRI showed significant hypothalamus and amygdala volume loss in both mutant lines plus hippocampal volume reduction in MAPTP301S;Int10+3;S320F.
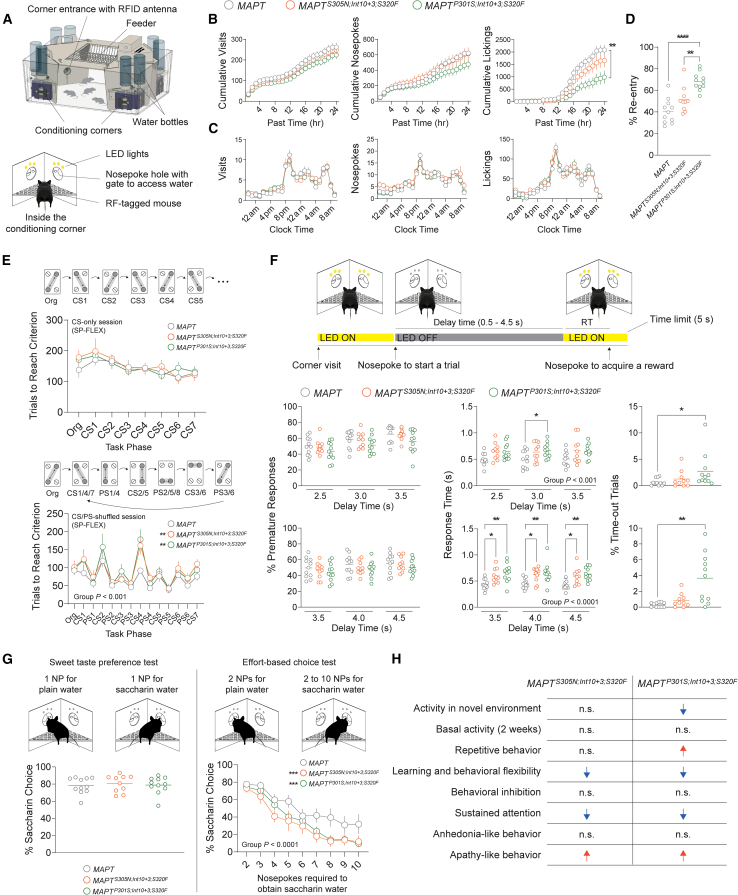
- In IntelliCage testing of 32 female mice at 9–12 months, MAPTP301S;Int10+3;S320F showed increased same-corner re-entry, more trials to criterion in the CS/PS-shuffled session (group effect F(2, 377) = 7.642, p < 0.001), impaired sustained attention, lower saccharin preference under effort (F(2, 261) = 14.50, p < 0.0001), and increased body weight; AppNL-G-F × MAPTP301S;Int10+3;S320F mice at 6 months had markedly enhanced AT8 positivity in cortex and hippocampus without changes in Aβ plaque density or GFAP/Iba1 versus AppNL-G-F.
Methods
- Triple-mutant lines were generated by a second round of cytosine base editor editing to introduce S320F into MAPTS305N;Int10+3 and MAPTP301S;Int10+3 mice; off-target candidates were checked by in silico analysis and whole-genome resequencing, and mutants were backcrossed to B6/J mice three or more times to obtain homozygotes.
- Phenotyping used immunofluorescence/immunohistochemistry with AT8, CP13, PHF-1, TOC1, T22, and MC1; sarkosyl fractionation into S1 and P3 fractions; FRET biosensor seeding assays; GFAP/Iba1 staining; synaptic marker imaging and western blot; Gallyas silver staining; T1 MRI; and IntelliCage behavioral testing.
- Samples were typically n = 4 per group (2 males and 2 females) at 6, 9, and 12 months; behavior used 32 female mice (MAPT n = 11, MAPTS305N;Int10+3;S320F n = 10, MAPTP301S;Int10+3;S320F n = 11) at 9–12 months, and MRI used n = 5 female mice per group.
Limitations
- Stated: the triple mutation combination does not occur in real-world human clinical cases, so the model is artificial; the authors also did not examine the protein structure of tau fibrils carrying P301S/S305N and S320F, leaving unknown whether accumulated tau replicates FTD patient tau structure.
- Evident from the text: pathological onset age was not directly determined and was inferred by extrapolation from AT8 time-course data; the behavioral cohort was female-only, and several biochemical/immunohistochemical analyses used small groups (n = 3–4), limiting sex- and sample-size-based generalization.
Model-written summary. Check it against the paper before relying on it.
Integrity signals
Registry
Cites
Statistics
Figures
Verification
Claims the paper makes
0 Valid · 0 Not valid · 19 Not checked · 76 Own results and interpretations
A result the paper reports from its own data — it cites no other source for it, so there is none to check. The quote shows it is in the paper.
In the paper
“the hypothalamus and amygdala brain volumes were significantly diminished in MAPTS305N;Int10+3;S320F and MAPTP301S;Int10+3;S320F mice in comparison with MAPT control mice”
§ Human MAPT knockin mouse models of frontotemporal dementia for the neurodegenerative research community > Results > Neuroinflammation, synaptic loss, and neurodegeneration
plain- Asserted: passes — The authors put it forward as true.
- Checkable: passes — It can be checked against evidence.
- Load-bearing: passes — The paper’s conclusions depend on it.
- Based: passes — The paper gives a reason why it holds.
A result the paper reports from its own data — it cites no other source for it, so there is none to check. The quote shows it is in the paper.
In the paper
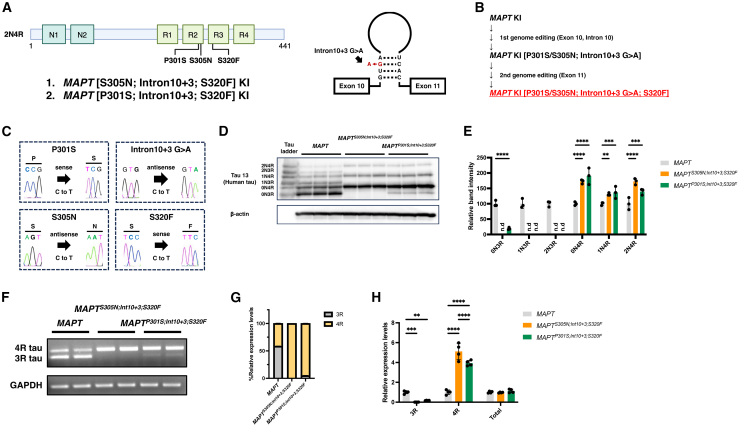
“the total tau expression levels were comparable among all groups”
§ Human MAPT knockin mouse models of frontotemporal dementia for the neurodegenerative research community > Results > Expression pattern of tau isoforms in triple-mutant MAPT KI mice
plain- Asserted: passes — The authors put it forward as true.
- Checkable: passes — It can be checked against evidence.
- Load-bearing: unclear — It is unclear whether the paper’s conclusions depend on it.
- Based: passes — The paper gives a reason why it holds.
A result the paper reports from its own data — it cites no other source for it, so there is none to check. The quote shows it is in the paper.
In the paper
“the MAPTP301S;Int10+3;S320F line exhibited robust tau pathology starting before 6 months of age”
- Also stated in: § Introduction · plain
“the MAPTP301S;Int10+3;S320F line exhibited typical FTD-like pathology accompanying hyperphosphorylated oligomeric tau formation together with synaptic loss earlier than 6 months of age”
§ Human MAPT knockin mouse models of frontotemporal dementia for the neurodegenerative research community > Abstract
plain- Asserted: passes — The authors put it forward as true.
- Checkable: passes — It can be checked against evidence.
- Load-bearing: passes — The paper’s conclusions depend on it.
- Based: passes — The paper gives a reason why it holds.
- Also stated in: § Introduction · plain
A result the paper reports from its own data — it cites no other source for it, so there is none to check. The quote shows it is in the paper.
In the paper
“In contrast, the MAPTP301S;Int10+3;S320F line produced a small but detectable quantity of 3R tau, the 0N3R isoform in particular”
§ Human MAPT knockin mouse models of frontotemporal dementia for the neurodegenerative research community > Results > Expression pattern of tau isoforms in triple-mutant MAPT KI mice
plain- Asserted: passes — The authors put it forward as true.
- Checkable: passes — It can be checked against evidence.
- Load-bearing: passes — The paper’s conclusions depend on it.
- Based: passes — The paper gives a reason why it holds.
A result the paper reports from its own data — it cites no other source for it, so there is none to check. The quote shows it is in the paper.
In the paper
“Colocalization of synaptic puncta detected by synaptotagmin, a pre-synaptic marker, and Homer1, a post-synaptic marker, was significantly decreased in the hypothalamus of MAPTP301S;Int10+3;S320F compared with those in MAPT mice”
§ Human MAPT knockin mouse models of frontotemporal dementia for the neurodegenerative research community > Results > Neuroinflammation, synaptic loss, and neurodegeneration
plain- Asserted: passes — The authors put it forward as true.
- Checkable: passes — It can be checked against evidence.
- Load-bearing: passes — The paper’s conclusions depend on it.
- Based: passes — The paper gives a reason why it holds.
52 more claims
Create a free account to see all 95 claims and to verify the 23 references still open.
- It may state two separate claims as one. 26
- Probably not a substantial claim. 16
Statistics recomputed
Every reported test result, recomputed from its test statistic and degrees of freedom. A result shows as not adding up only once an independent check has confirmed it.
- ConsistentF(2, 377) = 7.642reported p < .001 · recomputed p < .001
“F(2, 377) = 7.642, p < .001”
- ConsistentF(2, 261) = 14.5reported p < .0001 · recomputed p < .001
“F(2, 261) = 14.50, p < .0001”
Self-check
Percentages, sums and reported differences re-computed from the paper’s own numbers.
Each contradiction between two passages listed here was confirmed by an independent check.
Rated major: it would touch a result — a value a result rests on, reported and recomputed p-values on opposite sides of the significance level, two passages that conflict with no sign which is right, or a cited work retracted before this paper was published.
In the paper
§ Human MAPT knockin mouse models of frontotemporal dementia for the neurodegenerative research community > Discussion
“both MAPTP301S;Int10+3;S320F and MAPTS305N;Int10+3;S320F mice, which fail to reproduce tau hyperphosphorylation, also displayed local brain atrophy and behavior abnormalities.”
§ Human MAPT knockin mouse models of frontotemporal dementia for the neurodegenerative research community > Results > Histological studies of tau pathology using various tau antibodies
“Immunohistochemistry using CP13 (pS202), PHF-1 (pS396/S404), TOC1, T22, and MC119,20,21,22,23 antibodies clearly highlighted the presence of hyperphosphorylated and oligomeric/conformationally abnormal tau in the brain of MAPTP301S;Int10+3;S320F mice (Figures 3A and 3B).”
Rated minor: it would not touch a result — a value no result rests on, a p-value that stays on the same side of the significance level, or a conflict that is clerical, resolved elsewhere in the paper, or outside its own findings.
In the paper
“field of view = 18 × 18 × 18 mm3, matrix size = 144 × 144 × 80 mm3, voxel size = 0.125 × 0.125 × 0.125 mm3”
§ Human MAPT knockin mouse models of frontotemporal dementia for the neurodegenerative research community > STAR★Methods > Method details
Reported 18 · recomputed 10
Citations
Cites
Cingolani, P., Platts, A., Wang, L. L., Coon, M., Nguyen, T., Wang, L., Land, S. J., Lu, X., & Ruden, D. M. (2012) · Fly · doi:10.4161/fly.19695 · Cited by 11,816
Lecanemab in early Alzheimer's disease
van Dyck, C. H., Swanson, C. J., Aisen, P., Bateman, R. J., Chen, C., Gee, M., Kanekiyo, M., Li, D., Reyderman, L., Cohen, S., et al. (2023) · New England Journal of Medicine · doi:10.1056/nejmoa2212948 · Cited by 5,678
Programmable editing of a target base in genomic DNA without double-stranded DNA cleavage
Komor, A. C., Kim, Y. B., Packer, M. S., Zuris, J. A., & Liu, D. R. (2016) · Nature · doi:10.1038/nature17946 · Cited by 5,437
DNA targeting specificity of RNA-guided Cas9 nucleases
Hsu, P. D., Scott, D. A., Weinstein, J. A., Ran, F. A., Konermann, S., Agarwala, V., Li, Y., Fine, E. J., Wu, X., Shalem, O., et al. (2013) · Nature Biotechnology · doi:10.1038/nbt.2647 · Cited by 4,741
Phases of Aβ-deposition in the human brain and its relevance for the development of AD
Thal, D. R., Rüb, U., Orantes, M., & Braak, H. (2002) · Neurology · doi:10.1212/wnl.58.12.1791 · Cited by 3,490
Braak, H., Alafuzoff, I., Arzberger, T., Kretzschmar, H., & Del Tredici, K. (2006) · Acta Neuropathologica · doi:10.1007/s00401-006-0127-z · Cited by 3,172
Donanemab in Early Symptomatic Alzheimer Disease: The TRAILBLAZER-ALZ 2 Randomized Clinical Trial
Sims, J. R., Zimmer, J. A., Evans, C. D., Lu, M., Ardayfio, P., Sparks, J., Wessels, A. M., Shcherbinin, S., Wang, H., Monkul Nery, E. S., et al. (2023) · JAMA · doi:10.1001/jama.2023.13239 · Cited by 2,932
Tau in physiology and pathology
Wang, Y., & Mandelkow, E. (2016) · Nature Reviews Neuroscience · doi:10.1038/nrn.2015.1 · Cited by 2,251
Synapse Loss and Microglial Activation Precede Tangles in a P301S Tauopathy Mouse Model
Yoshiyama, Y., Higuchi, M., Zhang, B., Huang, S.-M., Iwata, N., Saido, T. C., Maeda, J., Suhara, T., Trojanowski, J. Q., & Lee, V. M.-Y. (2007) · Neuron · doi:10.1016/j.neuron.2007.01.010 · Cited by 2,208
Self-citationStages of the Pathologic Process in Alzheimer Disease: Age Categories From 1 to 100 Years
Braak, H., Thal, D. R., Ghebremedhin, E., & Del Tredici, K. (2011) · Journal of Neuropathology & Experimental Neurology · doi:10.1097/nen.0b013e318232a379 · Cited by 2,194
Cited by
Shiravi, S., Yufa, A., Papavasileiou, P., Lotz, S., Murphy, D., Bertucci, T. B., Temple, S., & Finan, J. D. (2025) · Journal of Neurotrauma · doi:10.1177/08977151251374286 · Cited by 9
Axonal tau reduction ameliorates tau and amyloid pathology in a mouse model of Alzheimer’s disease
Zare, A., Salehi, S., Bader, J. M., Wiessler, A.-L., Prokesch, M., Albrecht, V., Villmann, C., Mann, M., Briese, M., & Sendtner, M. (2025) · Translational Neurodegeneration · doi:10.1186/s40035-025-00499-0 · Cited by 6
Advancing Alzheimer’s research by improving disease modeling of secondary tauopathy
Roy, E. R., & Cao, W. (2025) · npj Dementia · doi:10.1038/s44400-025-00044-w · Cited by 4
Emerging directions in tauopathy research
Buée, L., Wildsmith, K. R., Alladi, S., Bertucci, T. B., Boche, D., Bowles, K. R., Boxer, A. L., Brummet, J., DeVos, S. L., Diaz, K., et al. (2026) · Alzheimer s & Dementia · doi:10.1002/alz.71431 · Cited by 3
Self-citationRodriguez, G. A., Aoun, A., Rothenberg, E. F., Shetler, O., Posani, L., Vajram, S. V., Tedesco, T. G., Sharma, A., Fusi, S., & Hussaini, S. A. (2026) · Cell Reports · doi:10.1016/j.celrep.2026.117505 · Cited by 3
Metadata
- Authors
- Morito, T., Qi, M., Kamano, N., Sasaguri, H., Bez, S., Foiani, M., Duff, K., Benner, S., Endo, T., Hama, H., Kurokawa, H., Miyawaki, A., Mizuma, H., Sahara, N., Shimojo, M., Higuchi, M., Saido, T. C., & Watamura, N.
- Affiliations
- RIKEN Center for Brain Science (JP)
- UK Dementia Research Institute (GB)
- National Institute for Environmental Studies (JP)
- Japan Chemical Analysis Center (JP)
- National Institutes for Quantum Science and Technology (JP)
- Corresponding author
- Saido, Takaomi C.
- Watamura, Naoto
- ORCID
- Venue
- Cell Reports Methods
- Publisher
- Elsevier BV
- Published
- 2025-04
- Volume
- 5
- Issue
- 4
- Pages
- 101024
- ISSN
- 2667-2375 (ISSN-L)
- PMC
- PMC12256944
- OpenAlex
- W4409348394
- Cited by
- 18
- References
- 93
- Citations by year
- 2026: 11 · 2025: 6
- FWCI
- 4.71
- Type
- journal article
- Language
- en
- Open access
- gold
- doi.org
- Licence
- Locations
- Cell Reports Methods (publishedVersion, cc-by-nc)
- bioRxiv (Cold Spring Harbor Laboratory) (submittedVersion, cc-by-nc-nd)
- PubMed Central (publishedVersion, cc-by-nc)
- Europe PMC (PubMed Central) (publishedVersion, cc-by-nc)
- PubMed (publishedVersion)
- DOAJ (DOAJ: Directory of Open Access Journals) (submittedVersion, cc-by-sa)
- UCL Discovery (University College London) (submittedVersion)
- Institutional Repositories DataBase (IRDB) (submittedVersion, cc-by-nc-nd)
- QST-Repository (National Institutes for Quantum and Radiological Science and Technology) (submittedVersion)
- Funders
- JSPS (24K18633)
- Japan Agency for Medical Research and Development (JP20dm0207001)
- Japan Society for the Promotion of Science (23K26790, 21K15378)
- UK Dementia Research Institute
- Uehara Memorial Foundation
- RIKEN
- Cell Science Research Foundation
- Alzheimer's Association
- Medical Research Council
- Topics
- Life Sciences › Neuroscience › Cellular and Molecular Neuroscience › Alzheimer's disease research and treatments
- Health Sciences › Medicine › Clinical Neurology › Amyotrophic Lateral Sclerosis Research
- Health Sciences › Medicine › Psychiatry and Mental health › Dementia and Cognitive Impairment Research
- Keywords
- frontotemporal dementia, tauopathy, tau pathology, amyloid-beta, thalamus, hypothalamus, amygdala, synaptic loss, brain atrophy, behavioral abnormalities, in vivo drug screening
- MeSH terms
- Animals, Brain, Disease Models, Animal, Humans, Mice, Transgenic, Mutation, tau Proteins, Mice, Gene Knock-In Techniques, Frontotemporal Dementia
About these checks
Registry, retraction, Cites and statistics results are computed, not judged, with one exception: a printed reference that no index lists is read once by a model before it counts as a citation error. Claims are extracted by a model and kept only when their quote appears verbatim in the text; each cited source is then checked, with a model’s help, for whether it says what the claim relies on. Those verdicts can be wrong — read the claim’s quote and the cited source before relying on one.
A language model drew the claims from the paper on 2026-11-13, under version 3 of the claim definition (model deepseek-v4.1-flash, prompt extract-v3).
A second model labelled each claim on 2026-11-13 (model jev-1.13-20260917, definition revision gold-guideline-v0.2).
Statistics and arithmetic are recomputed, not judged.
Confidence bands are shown only for fields calibrated on our annotated test set. None is calibrated yet, so no band is shown.
What counts as a claim ›How we measure confidence ›How we check this ›
Are you an author, or do you see a problem with this page? Request a review
How to cite
Cite CoChat for the checks on this page, and the paper for its own findings.
- This page
- CoChat. (2026). Citation check: Human MAPT knockin mouse models of frontotemporal dementia for the neurodegenerative research community. https://app.cochat.ai/papers/10.1016/j.crmeth.2025.101024
- The paper
- Morito, T., Qi, M., Kamano, N., Sasaguri, H., Bez, S., Foiani, M., Duff, K., Benner, S., Endo, T., Hama, H., Kurokawa, H., Miyawaki, A., Mizuma, H., Sahara, N., Shimojo, M., Higuchi, M., Saido, T. C., & Watamura, N. (2025). Human MAPT knockin mouse models of frontotemporal dementia for the neurodegenerative research community. Cell Reports Methods. https://doi.org/10.1016/j.crmeth.2025.101024
Data sources
Bibliographic data: Semantic Scholar, OpenAlex, Crossref.
Contains information from the Semantic Scholar Academic Graph Datasets, made available under the ODC Attribution License (ODC-BY 1.0).
Semantic Scholar’s data is described in: Kinney, R., et al. (2023). The Semantic Scholar Open Data Platform. arXiv:2301.10140.
