

The DOI matches its Crossref record; the references it cites are not checked yet.
Single-cell 5′ RNA sequencing of camelid peripheral B cells provides insights into cellular basis of heavy-chain antibody production
Open accessPublished version of a preprint
Abstract
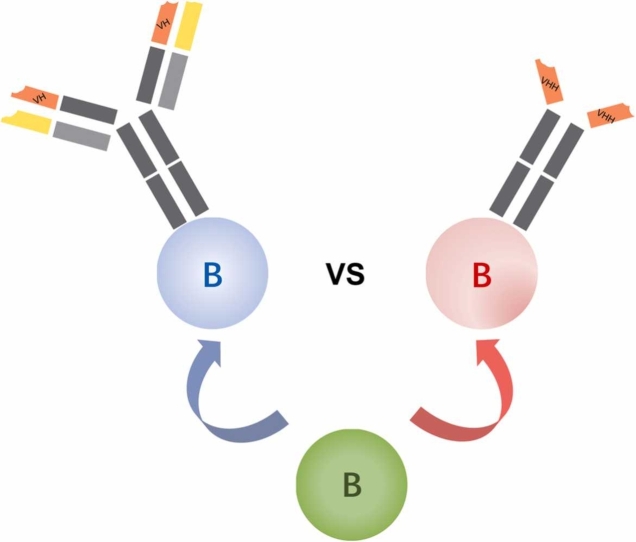
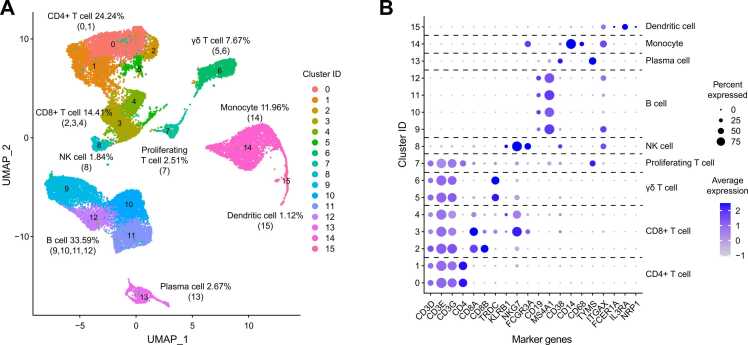
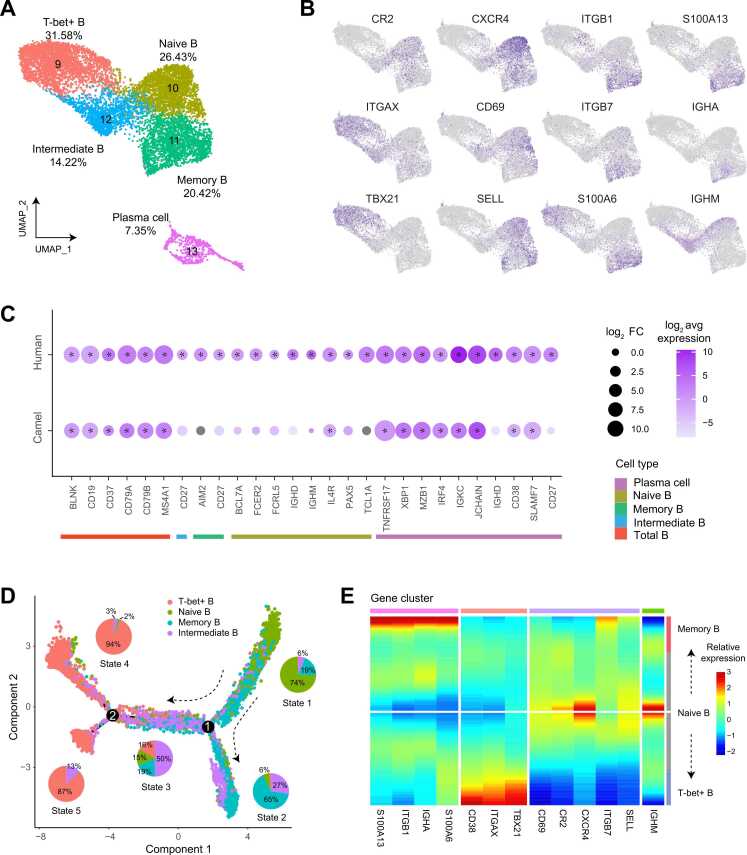
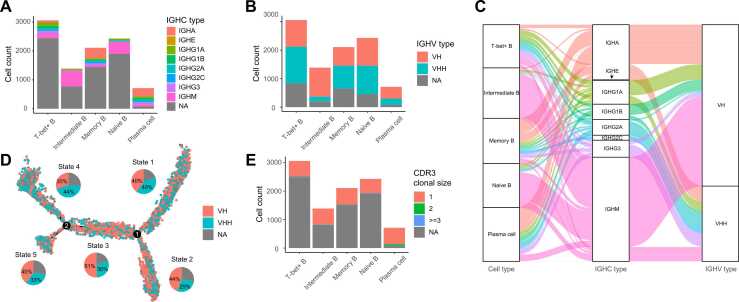
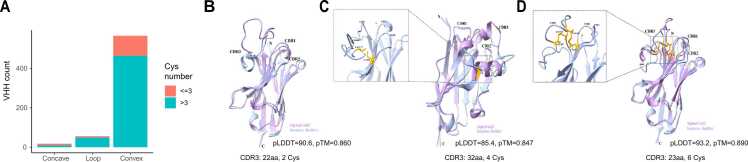
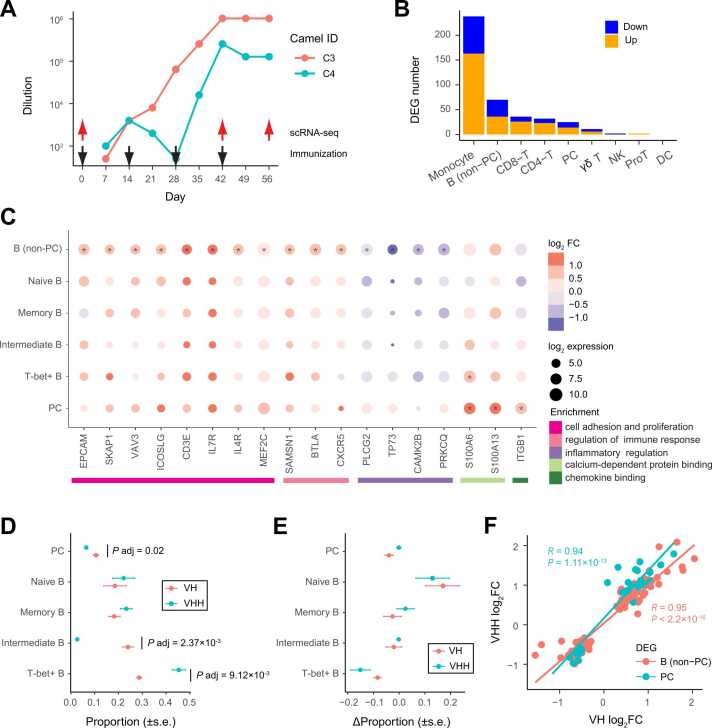
Camelids produce both conventional tetrameric antibodies (Abs) and dimeric heavy-chain antibodies (HCAbs). Although B cells that generate these two types of Abs exhibit distinct B cell receptors (BCRs), whether these two B cell populations differ in their phenotypes and developmental processes remains unclear. Here, we performed single-cell 5′ RNA profiling of peripheral blood mononuclear cell samples from Bactrian camels before and after immunization. We characterized the functional subtypes and differentiation trajectories of circulating B cells in camels, and reconstructed single-cell BCR sequences. We found that in contrast to humans, the proportion of T-bet+ B cells was high among camelid peripheral B cells. Several marker genes of human B cell subtypes, including CD27 and IGHD , were expressed at low levels in the corresponding camel B cell subtypes. Camelid B cells expressing variable genes of HACbs ( VHH ) were widely present in various functional subtypes and showed highly overlapping differentiation trajectories with B cells expressing variable genes of conventional Abs ( VH ). After immunization, the transcriptional changes in VHH + and VH + B cells were largely consistent. Through structure modeling, we identified a variety of scaffold types among the reconstructed VHH sequences. Our study provides insights into the cellular context of HCAb production in camels and lays the foundation for developing single-B cell-based camelid single-domain Ab screening.
Overview
The claims and statistics of this paper haven’t been checked yet.
Run the check — free, no account needed. It reads the open-access text and checks the sources it cites.
Integrity signals
Registry
Cites
Statistics
Figures
Verification
Claims the paper makes
The claims and statistics of this paper haven’t been checked yet.
Run the check — free, no account needed. It reads the open-access text and checks the sources it cites.
Self-check
Percentages, sums and reported differences re-computed from the paper’s own numbers.
The self-check needs the paper’s full text.
Citations
The citation lists haven’t been fetched yet
References 66 · Cited by 5
Research works printed but not linked: 60
- Schroeder H.W. Jr. Cavacini L. Structure and function of immunoglobulins J Allergy Clin Immunol 125 2 Suppl 2 2010 S41-52 · DOI
- Hamers-CastermanC.AtarhouchT.MuyldermansS.RobinsonG.HamersC.Naturally occurring antibodies devoid of light chainsNature363642819934464488502296 · DOI · Paper page
- 10.1146/annurev-biochem-063011-092449 · DOI · Paper page
- 10.1146/annurev-animal-021419-083831 · DOI
- PeyvandiF.ScullyM.Kremer HovingaJ.A.CatalandS.KnoblP.Caplacizumab for acquired thrombotic thrombocytopenic purpuraN Engl J Med3746201651152226863353 · DOI
- NguyenV.K.HamersR.WynsL.MuyldermansS.Loss of splice consensus signal is responsible for the removal of the entire C(H)1 domain of the functional camel IGG2A heavy-chain antibodiesMol Immunol368199951552410475606 · DOI
- WoolvenB.P.FrenkenL.G.van der LogtP.NichollsP.J.The structure of the llama heavy chain constant genes reveals a mechanism for heavy-chain antibody formationImmunogenetics501-219999810110541815 · DOI
- Liang Z. Wang T. Sun Y. Yang W. Liu Z. A comprehensive analysis of immunoglobulin heavy chain genes in the Bactrian camel (Camelus bactrianus) Front Agr Sci Eng 2 3 2015 249 259 · DOI
- MuyldermansS.AtarhouchT.SaldanhaJ.BarbosaJ.A.HamersR.Sequence and structure of VH domain from naturally occurring camel heavy chain immunoglobulins lacking light chainsProtein Eng791994112911357831284 · DOI
- VuK.B.GhahroudiM.A.WynsL.MuyldermansS.Comparison of llama VH sequences from conventional and heavy chain antibodiesMol Immunol3416-171997112111319566760
- HarmsenM.M.RuulsR.C.NijmanI.J.NiewoldT.A.FrenkenL.G.Llama heavy-chain V regions consist of at least four distinct subfamilies revealing novel sequence featuresMol Immunol3710200057959011163394 · DOI
- AchourI.CavelierP.TichitM.BouchierC.LafayeP.Tetrameric and homodimeric camelid IgGs originate from the same IgH locusJ Immunol181320082001200918641337 · DOI
- 10.1111/1755-0998.13141 · DOI
- 10.1093/emboj/19.5.921 · DOI
- Liu Y. Yi L. Li Y. Wang Z. Jirimutu Characterization of heavy-chain antibody gene repertoires in Bactrian camels J Genet Genom 50 1 2023 38 45 · DOI
- 10.1182/blood-2008-02-078071 · DOI
- KaminskiD.A.WeiC.QianY.RosenbergA.F.SanzI.Advances in human B cell phenotypic profilingFront Immunol3201230223087687 · DOI
- 10.1016/j.it.2022.01.003 · DOI
- 10.1016/j.it.2019.09.004 · DOI
- Hilton H.G. Rubinstein N.D. Janki P. Ireland A.T. Bernstein N. Single-cell transcriptomics of the naked mole-rat reveals unexpected features of mammalian immunity PLoS Biol 17 11 2019 e3000528 · DOI
- PatelR.S.TomlinsonJ.E.DiversT.J.Van de WalleG.R.RosenbergB.R.Single-cell resolution landscape of equine peripheral blood mononuclear cells reveals diverse cell types including T-bet(+) B cellsBMC Biol19120211333482825 · DOI
- Koiwai K. Koyama T. Tsuda S. Toyoda A. Kikuchi K. Single-cell RNA-seq analysis reveals penaeid shrimp hemocyte subpopulations and cell differentiation process Elife 10 2021 e66954 · DOI
- 10.3390/biom13010060 · DOI
- 10.1016/j.cell.2021.04.048 · DOI · Paper page
- Hussen J. Schuberth H.J. Recent Advances in Camel Immunology Front Immunol 11 2020 614150
- PizzolatoG.KaminskiH.TosoliniM.FranchiniD.M.PontF.Single-cell RNA sequencing unveils the shared and the distinct cytotoxic hallmarks of human TCRVdelta1 and TCRVdelta2 gammadelta T lymphocytesProc Natl Acad Sci USA116242019119061191531118283 · DOI
- KarnellJ.L.KumarV.WangJ.WangS.VoynovaE.Role of CD11c(+) T-bet(+) B cells in human health and diseaseCell Immunol3212017404528756897 · DOI
- Holla P. Dizon B. Ambegaonkar A.A. Rogel N. Goldschmidt E. Shared transcriptional profiles of atypical B cells suggest common drivers of expansion and function in malaria, HIV, and autoimmunity Sci Adv 7 22 2021 eabg8384 · DOI
- 10.3389/fimmu.2019.02458 · DOI · Paper page
- ZaniniF.RobinsonM.L.CrooteD.SahooM.K.SanzA.M.Virus-inclusive single-cell RNA sequencing reveals the molecular signature of progression to severe dengueProc Natl Acad Sci U S A115522018E12363E1236930530648 · DOI
- 10.1093/nar/gkac947 · DOI
- 10.1038/nmeth.4402 · DOI · Paper page
- Sutton H.J. Aye R. Idris A.H. Vistein R. Nduati E. Atypical B cells are part of an alternative lineage of B cells that participates in responses to vaccination and infection in humans Cell Rep 34 6 2021 108684 · DOI
- ShiZ.ZhangQ.YanH.YangY.WangP.More than one antibody of individual B cells revealed by single-cell immune profilingCell Discov520196431839985 · DOI
- Tillib S.V. Vyatchanin A.S. Muyldermans S. Molecular analysis of heavy chain-only antibodies of Camelus bactrianus Biochem (Mosc) 79 12 2014 1382 1390 · DOI
- 10.1038/s41592-021-01142-2 · DOI
- YeJ.MaN.MaddenT.L.OstellJ.M.IgBLAST: an immunoglobulin variable domain sequence analysis toolNucleic Acids Res41Web Server issue2013W34W4023671333 · DOI
- DeszynskiP.MlokosiewiczJ.VolanakisA.JaszczyszynI.CastellanaN.INDI-integrated nanobody database for immunoinformaticsNucleic Acids Res50D12022D1273D128134747487 · DOI
- DeschachtN.De GroeveK.VinckeC.RaesG.De BaetselierP.A novel promiscuous class of camelid single-domain antibody contributes to the antigen-binding repertoireJ Immunol1841020105696570420404276 · DOI
- 10.1038/s41594-018-0028-6 · DOI
- Melarkode Vattekatte A. Shinada N.K. Narwani T.J. Noel F. Bertrand O. Discrete analysis of camelid variable domains: sequences, structures, and in-silico structure prediction PeerJ 8 2020 e8408 · DOI
- Zimmermann I. Egloff P. Hutter C.A. Arnold F.M. Stohler P. Synthetic single domain antibodies for the conformational trapping of membrane proteins Elife 7 2018 e34317 · DOI
- SchneiderC.RaybouldM.I.J.DeaneC.M.SAbDab in the age of biotherapeutics: updates including SAbDab-nano, the nanobody structure trackerNucleic Acids Res50D12022D1368D137234986602 · DOI
- AbanadesB.WongW.K.BoylesF.GeorgesG.BujotzekA.ImmuneBuilder: deep-learning models for predicting the structures of immune proteinsCommun Biol61202357537248282 · DOI
- SircarA.SanniK.A.ShiJ.GrayJ.J.Analysis and modeling of the variable region of camelid single-domain antibodiesJ Immunol1861120116357636721525384 · DOI · Paper page
- 10.1074/jbc.M111.242818 · DOI
- Blanchard-RohnerG.PulickalA.S.Jol-van der ZijdeC.M.SnapeM.D.PollardA.J.Appearance of peripheral blood plasma cells and memory B cells in a primary and secondary immune response in humansBlood1142420094998500219843885 · DOI
- 10.4049/jimmunol.172.12.7432 · DOI
- 10.1126/science.1067308 · DOI
- SunA.NovobrantsevaT.I.CoffreM.HewittS.L.JensenK.VH replacement in primary immunoglobulin repertoire diversificationProc Natl Acad Sci U S A11252015E458E46625609670
- 10.1016/j.cell.2020.05.025 · DOI · Paper page
- GoldsteinL.D.ChenY.J.WuJ.ChaudhuriS.HsiaoY.C.Massively parallel single-cell B-cell receptor sequencing enables rapid discovery of diverse antigen-reactive antibodiesCommun Biol2201930431428692 · DOI
- LefrancM.P.PommieC.RuizM.GiudicelliV.FoulquierE.IMGT unique numbering for immunoglobulin and T cell receptor variable domains and Ig superfamily V-like domainsDev Comp Immunol2712003557712477501 · DOI
- DunbarJ.DeaneC.M.ANARCI: antigen receptor numbering and receptor classificationBioinformatics322201629830026424857 · DOI
- 10.1038/s41592-022-01488-1 · DOI · Paper page
- 10.1093/nar/gkab1061 · DOI · Paper page
- 10.1002/prot.20264 · DOI · Paper page
- LoveM.I.HuberW.AndersS.Moderated estimation of fold change and dispersion for RNA-seq data with DESeq2Genome Biol1512201455025516281 · DOI · Paper page
- YuG.WangL.G.HanY.HeQ.Y.clusterProfiler: an R package for comparing biological themes among gene clustersOMICS165201228428722455463 · DOI · Paper page
- AshburnerM.BallC.A.BlakeJ.A.BotsteinD.ButlerH.Gene ontology: tool for the unification of biology. The Gene Ontology ConsortiumNat Genet2512000252910802651 · DOI · Paper page
Metadata
- Authors
- Yi, L., Guo, X., Liu, Y., Jirimutu, & Wang, Z.
- Affiliations
- Key Laboratory of Dairy Biotechnology and Engineering, Ministry of Education, College of Food Science and Engineering, Inner Mongolia Agricultural University, Huhhot 010018, China
- Shanghai Institute of Nutrition and Health (CN)
- Guangzhou Laboratory (CN)
- Inner Mongolia Agricultural University (CN)
- Corresponding author
- Jirimutu
- Wang, Zhen
- Venue
- Computational and Structural Biotechnology Journal
- Published
- 2024-04-16
- Volume
- 23
- Pages
- 1705-1714
- ISSN
- 2001-0370 (ISSN-L)
- PMC
- PMC11059136
- OpenAlex
- W4394893321
- Cited by
- 5
- References
- 66
- Citations by year
- 2026: 2 · 2025: 3
- FWCI
- 1.27
- Type
- journal article
- Language
- en
- Open access
- gold
- doi.org
- Licence
- Locations
- Computational and Structural Biotechnology Journal (publishedVersion, cc-by-nc-nd)
- bioRxiv (Cold Spring Harbor Laboratory) (acceptedVersion, cc-by)
- PubMed Central (publishedVersion, cc-by-nc-nd)
- PubMed (publishedVersion)
- DOAJ (DOAJ: Directory of Open Access Journals) (submittedVersion)
- Funders
- National Natural Science Foundation of China
- Topics
- Life Sciences › Immunology and Microbiology › Immunology › Monoclonal and Polyclonal Antibodies Research
- Life Sciences › Immunology and Microbiology › Immunology › T-cell and B-cell Immunology
- Life Sciences › Biochemistry, Genetics and Molecular Biology › Molecular Biology › Single-cell and spatial transcriptomics
- Keywords
- heavy-chain antibodies, B cell receptor repertoire, VHH, Bactrian camel, immunization, B cell subsets
About these checks
Registry, retraction, Cites and statistics results are computed, not judged, with one exception: a printed reference that no index lists is read once by a model before it counts as a citation error. Claims are extracted by a model and kept only when their quote appears verbatim in the text; each cited source is then checked, with a model’s help, for whether it says what the claim relies on. Those verdicts can be wrong — read the claim’s quote and the cited source before relying on one.
Statistics and arithmetic are recomputed, not judged.
Confidence bands are shown only for fields calibrated on our annotated test set. None is calibrated yet, so no band is shown.
What counts as a claim ›How we measure confidence ›How we check this ›
Are you an author, or do you see a problem with this page? Request a review
How to cite
Cite CoChat for the checks on this page, and the paper for its own findings.
- This page
- CoChat. (2026). Citation check: Single-cell 5′ RNA sequencing of camelid peripheral B cells provides insights into cellular basis of heavy-chain antibody production. https://app.cochat.ai/papers/10.1016/j.csbj.2024.04.041
- The paper
- Yi, L., Guo, X., Liu, Y., Jirimutu, & Wang, Z. (2024). Single-cell 5′ RNA sequencing of camelid peripheral B cells provides insights into cellular basis of heavy-chain antibody production. Computational and Structural Biotechnology Journal. https://doi.org/10.1016/j.csbj.2024.04.041
