

The DOI matches its Crossref record.
Likelihood ratio data to report the validation of a forensic fingerprint evaluation method
Overview
The claims and statistics of this paper haven’t been checked yet.
Run the check — free, no account needed. It reads the open-access text and checks the sources it cites.
Integrity signals
Registry
Cites
Statistics
Figures
Verification
Claims the paper makes
The claims and statistics of this paper haven’t been checked yet.
Run the check — free, no account needed. It reads the open-access text and checks the sources it cites.
Claims other papers make about this one
Each is checked against this paper’s own text: does it say what the citing paper says it does?
The source backs part of the claim, not all of it — or backs it for a different population, condition or comparison.
In the citing paper
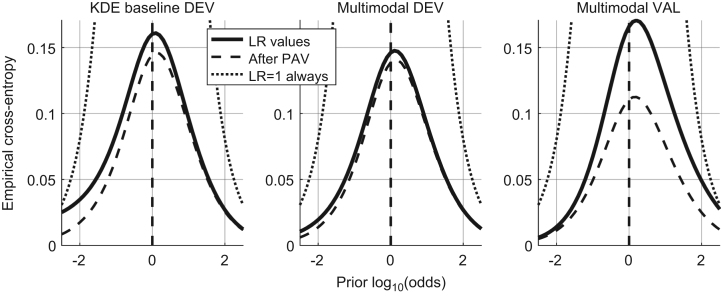
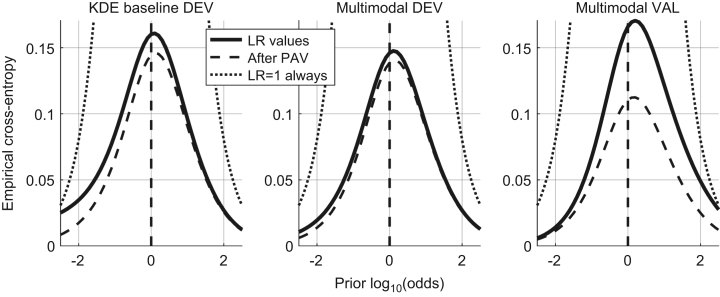
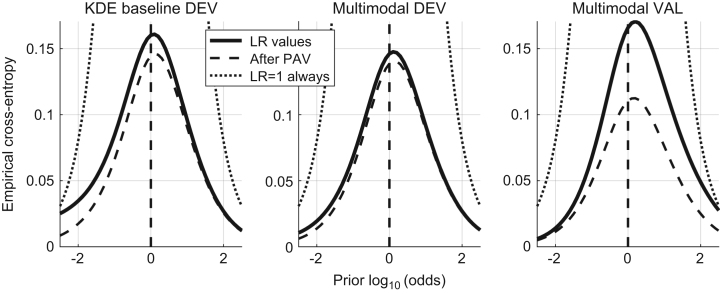
“In conclusion, for this work and according to the studied literature, the best indicators of both discrimination and calibration performances are Cllr and the ECE plots (explained in 3.3.1)[36,38] which give a good view of both the calibration and discrimination power of the forensic experts and the automated systems.”
From Calibration of score based likelihood ratio estimation in automated forensic facial image comparison (2022) · cites this paper as [38]
Experimental — accuracy not yet measured
Self-check
Percentages, sums and reported differences re-computed from the paper’s own numbers.
The self-check needs the paper’s full text.
Citations
Cites
No references could be resolved yet.
Research works printed but not linked: 12
- Meuwly, 2016, A guideline for the validation of likelihood ratio methods used for forensic evidence evaluation, Forensic Sci. Int.
- R.Haraksim, D.Ramos, D.Meuwly, C.E.H.Berger, Measuring coherence of computer-assisted likelihood ratio methods, Forensic Sci International, In press, 〈http://dx.doi.org/10.1016/j.forsciint.2015.01.033〉 · DOI
- D. Meuwly, R.G.F. Veldhuis. Forensic biometrics: from two communities to one discipline, in: Proceedings of the BIOSIG International Conference of the Biometrics Special Interest Group, 2012, pp. 207–218.
- T.Ali, L.J.Spreeuwers, R.N.J.Veldhuis, A review of calibration methods for biometric systems in forensic applications, in: Proceedings of the 33rd WIC Symposium on Information Theory in Benelux, Boekelo, Netherlands, pp. 126–133, WIC. ISBN 978-90-365-3383-6, May, 2012.
- Egli Anthonioz, 2014, Evidence evaluation in fingerprint comparison and automated fingerprint identification systems—Modeling between finger variability, Forensic Sci. Int., 235, 86, 10.1016/j.forsciint.2013.12.003 · DOI
- Alberink, Ivo, Arent Jongh, and Crystal Rodriguez. Fingermark evidence evaluation based on automated fingerprint identification system matching scores: the effect of different types of conditioning on likelihood ratios. Journal of forensic sciences 59.1 (2014): 70-81 · DOI
- Brümmer N, Swart A. Bayesian calibration for forensic evidence reporting. arXiv preprint arXiv:1403.5997. 2014 Mar 24 · DOI
- Rodriguez, 2012, Introducing a semi-automated method to simulate a large number of forensic fingermarks for research on fingerprint identification, J. Forensic Sci., 57, 334, 10.1111/j.1556-4029.2011.01950.x · DOI
- Hepler, 2012, Score-based likelihood ratios for handwriting evidence, Forensic Sci. Int., 219, 129, 10.1016/j.forsciint.2011.12.009 · DOI
- D.Meuwly, Reconnaissance de Locuteurs en Sciences Forensiques: L’apport d’une Approche Automatique, (Ph.D. thesis), 2001.
- Meuwly, 2006, Forensic individualization from biometric data, Sci. Justice, 46, 205, 10.1016/S1355-0306(06)71600-8 · DOI
- Haraksim, 2016, Validation of likelihood ratio methods for forensic evidence evaluation handling multimodal score distributions, IET Biom.
Cited by
Sorted by citations
Calibration of score based likelihood ratio estimation in automated forensic facial image comparison
Rodriguez, A. M., Geradts, Z., & Worring, M. (2022) · Forensic Science International · doi:10.1016/j.forsciint.2022.111239 · Cited by 19
Metadata
- Authors
- Ramos, D., Haraksim, R., & Meuwly, D.
- Venue
- Data in Brief
- Publisher
- Elsevier BV
- Published
- 2017-02
- Volume
- 10
- Pages
- 75-92
- ISSN
- 2352-3409
- PMC
- PMC5144651
- Cited by
- 34
- References
- 0
- Language
- en
- Funders
- BBfor2 – European Commission Marie Curie Initial Training Network (FP7-PEOPLE-ITN-2008, 238803)
About these checks
Registry, retraction, Cites and statistics results are computed, not judged, with one exception: a printed reference that no index lists is read once by a model before it counts as a citation error. Claims are extracted by a model and kept only when their quote appears verbatim in the text; each cited source is then checked, with a model’s help, for whether it says what the claim relies on. Those verdicts can be wrong — read the claim’s quote and the cited source before relying on one.
Statistics and arithmetic are recomputed, not judged.
Confidence bands are shown only for fields calibrated on our annotated test set. None is calibrated yet, so no band is shown.
What counts as a claim ›How we measure confidence ›How we check this ›
Are you an author, or do you see a problem with this page? Request a review
