

The DOI matches its Crossref record; 16 of the 16 references it cites were found in a registry or an index.
Increasing accessibility to a large brain–computer interface dataset: Curation of physionet EEG motor movement/imagery dataset for decoding and classification
Open accessAbstract
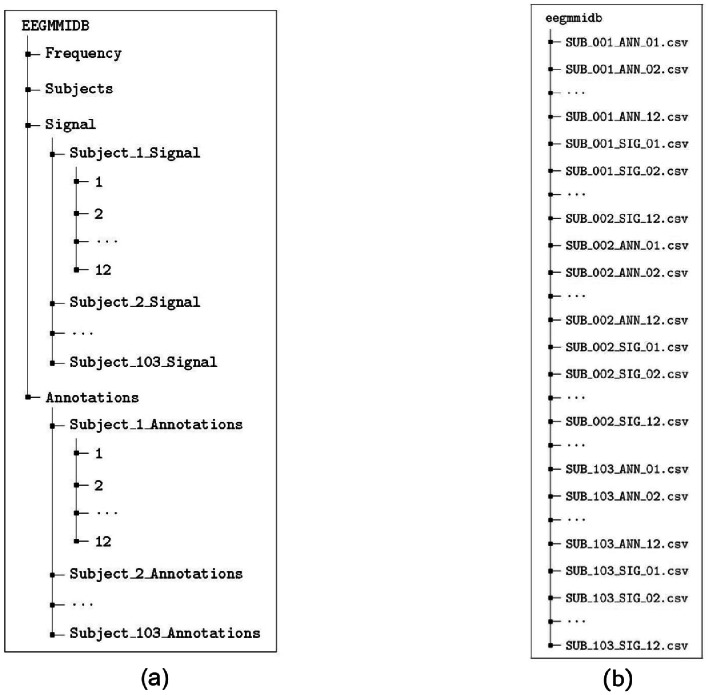
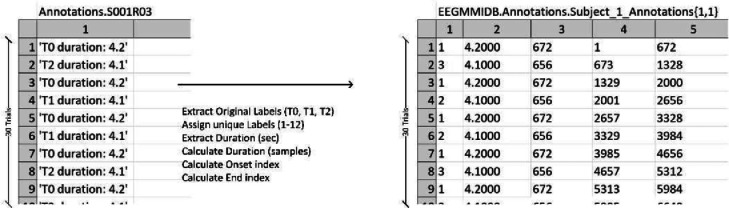
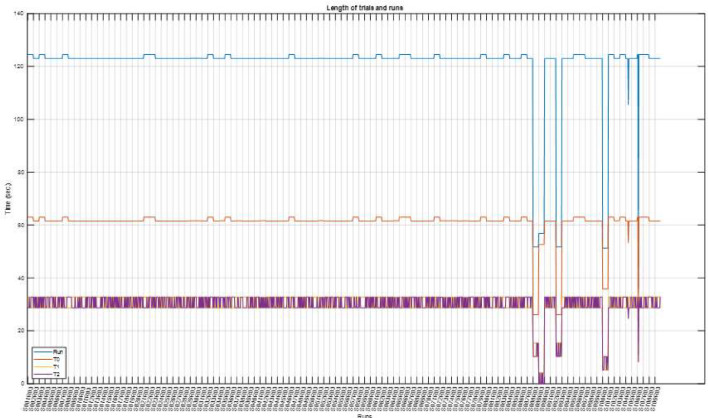
A reliable motor imagery (MI) brain-computer interface (BCI) requires accurate decoding, which in turn requires model calibration using electroencephalography (EEG) signals from subjects executing or imagining the execution of movements. Although the PhysioNet EEG Motor Movement/Imagery Dataset is currently the largest EEG dataset in the literature, relatively few studies have used it to decode MI trials. In the present study, we curated and cleaned this dataset to store it in an accessible format that is convenient for quick exploitation, decoding, and classification using recent integrated development environments. We dropped six subjects owing to anomalies in EEG recordings and pre-possessed the rest, resulting in 103 subjects spanning four MI and four motor execution tasks. The annotations were coded to correspond to different tasks using numerical values. The resulting dataset is stored in both MATLAB structure and CSV files to ensure ease of access and organization. We believe that improving the accessibility of this dataset will help EEG-based MI-BCI decoding and classification, enabling more reliable real-life applications. The convenience and ease of access of this dataset may therefore lead to improvements in cross-subject classification and transfer learning.
Overview
The claims and statistics of this paper haven’t been checked yet.
Run the check — free, no account needed. It reads the open-access text and checks the sources it cites.
Integrity signals
Registry
Cites
Statistics
Figures
Verification
Claims the paper makes
The claims and statistics of this paper haven’t been checked yet.
Run the check — free, no account needed. It reads the open-access text and checks the sources it cites.
Claims other papers make about this one
Each is checked against this paper’s own text: does it say what the citing paper says it does?
The cited source says what the claim attributes to it.
In the citing paper
“Consequently, exclusion of this subject’s data is methodologically justified.”
From Motor imagery EEG classification via wavelet-packet synthetic augmentation and entropy-based channel selection (2025) · cites this paper as Shuqfa et al., 2024
Self-check
Percentages, sums and reported differences re-computed from the paper’s own numbers.
The self-check needs the paper’s full text.
Citations
Cites
Goldberger, A. L., Amaral, L. A. N., Glass, L., Hausdorff, J. M., Ivanov, P. C., Mark, R. G., Mietus, J. E., Moody, G. B., Peng, C.-K., & Stanley, H. E. (2000) · Circulation · doi:10.1161/01.cir.101.23.e215 · Cited by 14,809
BCI2000: A General-Purpose Brain-Computer Interface (BCI) System
Schalk, G., McFarland, D. J., Hinterberger, T., Birbaumer, N., & Wolpaw, J. R. (2004) · IEEE Transactions on Biomedical Engineering · doi:10.1109/tbme.2004.827072 · Cited by 3,129
Altaheri, H., Muhammad, G., Alsulaiman, M., Amin, S. U., Altuwaijri, G. A., Abdul, W., Bencherif, M. A., & Faisal, M. (2021) · Neural Computing and Applications · doi:10.1007/s00521-021-06352-5 · Cited by 634
Rashid, M., Sulaiman, N., Majeed, A. P. P. A., Musa, R. M., Nasir, A. F. A., Bari, B. S., & Khatun, S. (2020) · Frontiers in Neurorobotics · doi:10.3389/fnbot.2020.00025 · Cited by 545
A review on transfer learning in EEG signal analysis
Wan, Z., Yang, R., Huang, M., Zeng, N., & Liu, X. (2020) · Neurocomputing · doi:10.1016/j.neucom.2020.09.017 · Cited by 468
Brain-Computer Interfaces Based on Visual Evoked Potentials
Wang, Y., Gao, X., Hong, B., Jia, C., & Gao, S. (2008) · IEEE Engineering in Medicine and Biology Magazine · doi:10.1109/memb.2008.923958 · Cited by 423
Neural Decoding of EEG Signals with Machine Learning: A Systematic Review
Saeidi, M., Karwowski, W., Farahani, F. V., Fiok, K., Taïar, R., Hancock, P. A., & Aljuaid, A. M. (2021) · Brain Sciences · doi:10.3390/brainsci11111525 · Cited by 295
Kemp, B., & Olivan, J. (2003) · Clinical Neurophysiology · doi:10.1016/s1388-2457(03)00123-8 · Cited by 278
Signal processing techniques for motor imagery brain computer interface: A review
Aggarwal, S., & Chugh, N. (2019) · Array · doi:10.1016/j.array.2019.100003 · Cited by 224
An Open-source Toolbox for Analysing and Processing PhysioNet Databases in MATLAB and Octave
Silva, I., & Moody, G. B. (2014) · Journal of Open Research Software · doi:10.5334/jors.bi · Cited by 221
Cited by
Sorted by citations
Murtaza, H., Ahmed, M., Murtaza, G., Zafar, S. N., & Nazir, T. (2025) · Biomedical Signal Processing and Control · doi:10.1016/j.bspc.2025.107552 · Cited by 9
Huang, J., Huang, L., Li, Y., & Fang, F. (2025) · Journal of Multidisciplinary Healthcare · doi:10.2147/jmdh.s509747 · Cited by 7
A multi-paradigm EEG dataset for studying upper limb rehabilitation exercises
Chang, W., Kong, W., Yan, G., Lv, R., Du, K., Sadiq, M. T., Guo, B., Yin, R., & Liu, X. (2025) · Scientific Data · doi:10.1038/s41597-025-06147-6 · Cited by 7
Shuqfa, Z., & Lakas, A. (2024) · IEEE/ACM International Conference on Big Data Computing, Applications and Technologies (BDCAT) · doi:10.1109/bdcat63179.2024.00050 · Cited by 4
Self-citationWang, S., Lee, C.-H., Jung, T., Cui, S., Duan, D., Wan, X., Xie, X., Song, H., Dong, X., & Wen, D. (2026) · Advanced Engineering Informatics · doi:10.1016/j.aei.2026.104517 · Cited by 2
Metadata
- Authors
- Shuqfa, Z., Lakas, A., & Belkacem, A. N.
- Affiliations
- United Arab Emirates University (AE)
- Corresponding author
- Shuqfa, Zaid
- Lakas, Abderrahmane
- Venue
- Data in Brief
- Publisher
- Elsevier BV
- Published
- 2024-06
- Volume
- 54
- Pages
- 110181
- ISSN
- 2352-3409 (ISSN-L)
- PMC
- PMC10998040
- OpenAlex
- W4391755881
- Cited by
- 16
- References
- 16
- Citations by year
- 2026: 5 · 2025: 10 · 2024: 1
- Type
- data paper
- Language
- en
- Open access
- gold
- doi.org
- Licence
- Locations
- Data in Brief (publishedVersion, cc-by)
- PubMed Central (publishedVersion, cc-by)
- PubMed (publishedVersion)
- DOAJ (DOAJ: Directory of Open Access Journals) (submittedVersion)
- Rabdan Academy Digital Repository (Rabdan Academy) (submittedVersion, cc-by)
- Topics
- Life Sciences › Neuroscience › Cognitive Neuroscience › EEG and Brain-Computer Interfaces
- Physical Sciences › Engineering › Biomedical Engineering › Muscle activation and electromyography studies
- Physical Sciences › Computer Science › Human-Computer Interaction › Gaze Tracking and Assistive Technology
- Keywords
- brain-computer interface, motor imagery, EEG, data curation, EEG preprocessing, motor execution, cross-subject classification, transfer learning, data annotation
About these checks
Registry, retraction, Cites and statistics results are computed, not judged, with one exception: a printed reference that no index lists is read once by a model before it counts as a citation error. Claims are extracted by a model and kept only when their quote appears verbatim in the text; each cited source is then checked, with a model’s help, for whether it says what the claim relies on. Those verdicts can be wrong — read the claim’s quote and the cited source before relying on one.
Statistics and arithmetic are recomputed, not judged.
Confidence bands are shown only for fields calibrated on our annotated test set. None is calibrated yet, so no band is shown.
What counts as a claim ›How we measure confidence ›How we check this ›
Are you an author, or do you see a problem with this page? Request a review
How to cite
Cite CoChat for the checks on this page, and the paper for its own findings.
- This page
- CoChat. (2026). Citation check: Increasing accessibility to a large brain–computer interface dataset: Curation of physionet EEG motor movement/imagery dataset for decoding and classification. https://app.cochat.ai/papers/10.1016/j.dib.2024.110181
- The paper
- Shuqfa, Z., Lakas, A., & Belkacem, A. N. (2024). Increasing accessibility to a large brain–computer interface dataset: Curation of physionet EEG motor movement/imagery dataset for decoding and classification. Data in Brief. https://doi.org/10.1016/j.dib.2024.110181
