

The DOI matches its Crossref record; 31 of the 31 references it cites were found in a registry or an index.
Apolipoprotein E (APOE) genotype-associated disease risks: a phenome-wide, registry-based, case-control study utilising the UK Biobank
Open accessAbstract
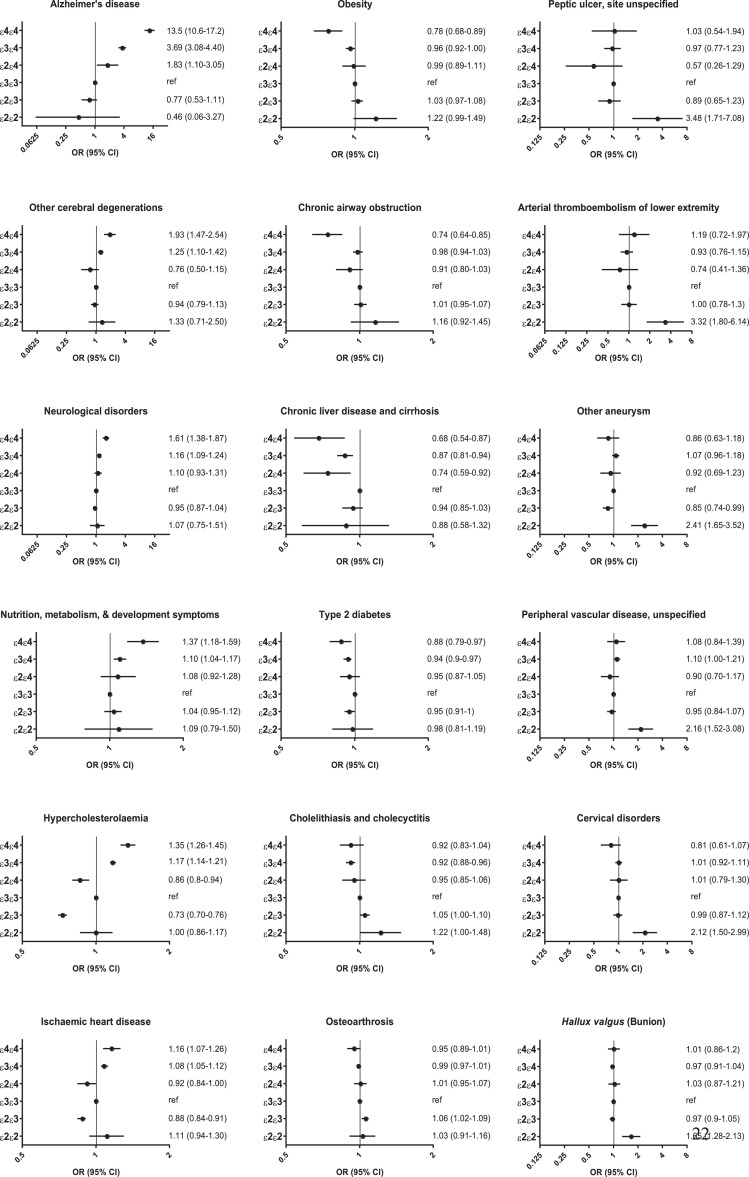
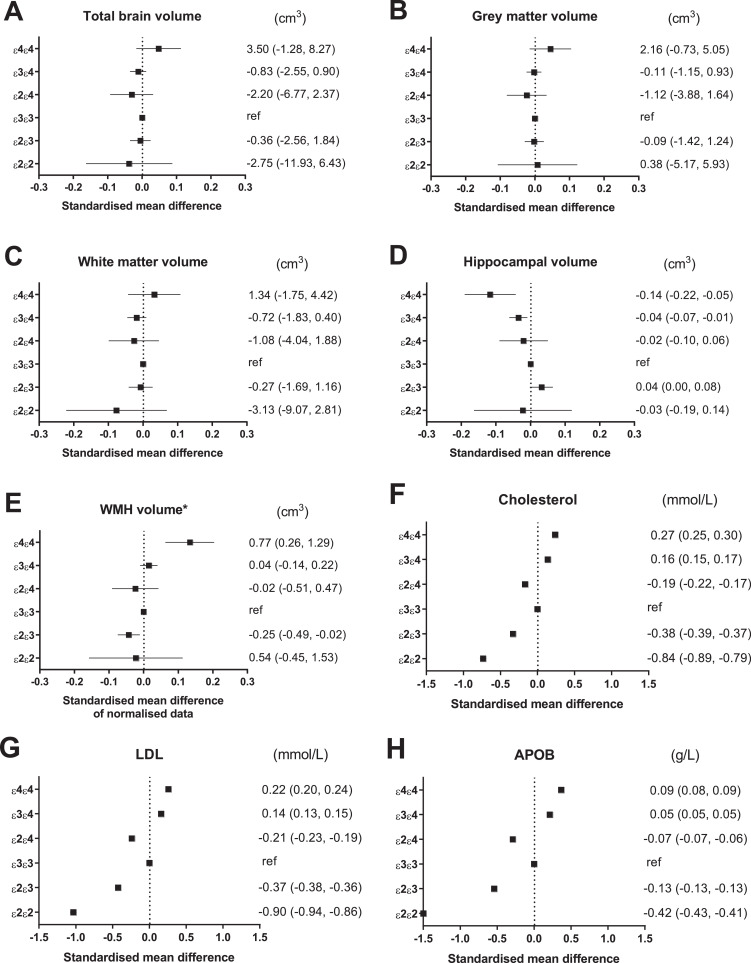
Background The three main alleles of the APOE gene (ε4, ε3 and ε2) carry differential risks for conditions including Alzheimer's disease (AD) and cardiovascular disease. Due to their clinical significance, we explored disease associations of the APOE genotypes using a hypothesis-free, data-driven, phenome-wide association study (PheWAS) approach. Methods We used data from the UK Biobank to screen for associations between APOE genotypes and over 950 disease outcomes using genotype ε3ε3 as a reference. Data was restricted to 337,484 white British participants (aged 37–73 years). Findings After correction for multiple testing, PheWAS analyses identified associations with 37 outcomes, representing 18 distinct diseases. As expected, ε3ε4 and ε4ε4 genotypes associated with increased odds of AD (p ≤ 7.6 × 10 −46 ), hypercholesterolaemia (p ≤ 7.1 × 10 −17 ) and ischaemic heart disease (p ≤ 2.3 × 10 −4 ), while ε2ε3 provided protection for the latter two conditions (p ≤ 3.7 × 10 −10 ) compared to ε3ε3. In contrast, ε4-associated disease protection was seen against obesity, chronic airway obstruction, type 2 diabetes, gallbladder disease, and liver disease (all p ≤ 5.2 × 10 −4 ) while ε2ε2 homozygosity increased risks of peripheral vascular disease, thromboembolism, arterial aneurysm, peptic ulcer, cervical disorders, and hallux valgus (all p ≤ 6.1 × 10 −4 ). Sensitivity analyses using brain neuroimaging, blood biochemistry, anthropometric, and spirometric biomarkers supported the PheWAS findings on APOE associations with respective disease outcomes. Interpretation PheWAS confirms strong associations between APOE and AD, hypercholesterolaemia, and ischaemic heart disease, and suggests potential ε4-associated disease protection and harmful effects of the ε2ε2 genotype, for several conditions. Funding National Health and Medical Research Council of Australia.
Overview
The claims and statistics of this paper haven’t been checked yet.
Run the check — free, no account needed. It reads the open-access text and checks the sources it cites.
Integrity signals
Registry
Cites
Statistics
Figures
Verification
Claims the paper makes
The claims and statistics of this paper haven’t been checked yet.
Run the check — free, no account needed. It reads the open-access text and checks the sources it cites.
Claims other papers make about this one
Each is checked against this paper’s own text: does it say what the citing paper says it does?
The source backs part of the claim, not all of it — or backs it for a different population, condition or comparison.
In the citing paper
“By contrast, in the same registries, APOEε2 has been associated with lower LDL cholesterol levels, increased triglyceride levels and increased risk of peripheral vascular disease87,88.”
From Multifaceted roles of APOE in Alzheimer disease (2024) · cites this paper as [88]
Experimental — accuracy not yet measuredThe source backs part of the claim, not all of it — or backs it for a different population, condition or comparison.
In the citing paper
“Besides AD43, APOE has been associated with at least eighteen other diseases, including heart disease and high cholesterol44.”
From Proteogenomic analysis of human cerebrospinal fluid identifies neurologically relevant regulation and implicates causal proteins for Alzheimer’s disease (2024) · cites this paper as [44]
Experimental — accuracy not yet measuredThe cited source says what the claim attributes to it.
In the citing paper
“APOE genotype was determined using SNP data at rs429358 and rs7412, which define the three major APOE isoforms (ε2, ε3, and ε4) based on established haplotypes. Genotypes were assigned according to allele combinations, consistent with prior UK Biobank studies,79”
From TET2-mutant myeloid cells mitigate Alzheimer’s disease progression via CNS infiltration and enhanced phagocytosis in mice (2025) · cites this paper as [79]
The cited source says what the claim attributes to it.
In the citing paper
“a risk increase also recently reported cross-sectionally in the UK Biobank [42]”
From APOE and vascular disease: Sequencing and genotyping in general population cohorts (2023) · cites this paper as [42]
The cited source says what the claim attributes to it.
In the citing paper
“In large health registries such as the UK BioBank, the APOEε4 allele has been associated with higher LDL cholesterol and triglycerides levels, lower HDL cholesterol levels and an increased risk of coronary artery disease.”
From Multifaceted roles of APOE in Alzheimer disease (2024) · cites this paper as [88]
Self-check
Percentages, sums and reported differences re-computed from the paper’s own numbers.
The self-check needs the paper’s full text.
Citations
Cites
Controlling the False Discovery Rate: A Practical and Powerful Approach to Multiple Testing
Benjamini, Y., & Hochberg, Y. (1995) · Journal of the Royal Statistical Society Series B: Statistical Methodology · doi:10.1111/j.2517-6161.1995.tb02031.x · Cited by 109,482 · cited 1×
“1 £ 10 4 to control for multiple testing [10], accounting for all comparisons across the five PheWASs.”
BackgroundSudlow, C., Gallacher, J., Allen, N., Beral, V., Burton, P., Danesh, J., Downey, P., Elliott, P., Green, J., Landray, M., et al. (2015) · PLOS Medicine · doi:10.1371/journal.pmed.1001779 · Cited by 12,728 · cited 2×
“Participants provided electronic consent to use their anonymised data and samples for healthrelated research, to be re-contacted for further sub-studies, and for the UK Biobank to access their health-related records [5].”
BackgroundMethodThe UK Biobank resource with deep phenotyping and genomic data
Bycroft, C., Freeman, C., Petkova, D., Band, G., Elliott, L. T., Sharp, K., Motyer, A., Vukcevic, D., Delaneau, O., O’Connell, J., et al. (2018) · Nature · doi:10.1038/s41586-018-0579-z · Cited by 8,876 · cited 3×
“Our analyses were restricted to 337,484 unrelated white British individuals (established by self-report and genetic data) [6] who had consistent information between self-reported and genetic sex (appendix p 35 figure S2).”
MethodInfluentialDenny, J. C., Bastarache, L. A., Ritchie, M. D., Carroll, R. J., Zink, R., Mosley, J. D., Field, J. R., Pulley, J. M., Ramirez, A. H., Bowton, E., et al. (2013) · Nature Biotechnology · doi:10.1038/nbt.2749 · Cited by 987 · cited 1×
“For each phecode, we coded individuals with the phecode-ofinterest as cases, whilst participants without a phecode within the same category were considered the control group [8].”
MethodWeisgraber, K. H., Innerarity, T. L., & Mahley, R. W. (1982) · Journal of Biological Chemistry · doi:10.1016/s0021-9258(18)34954-8 · Cited by 673 · cited 1×
“The homozygous e2e2 genotype increased the odds for a distinct set of disease outcomes not associated with other genotypes, suggesting that these conditions stem from a homozygous loss of APOE function specific to the e2 variant, such as its inability to bind the LDL receptor [22].”
BackgroundR PheWAS: data analysis and plotting tools for phenome-wide association studies in the R environment
Carroll, R. J., Bastarache, L. A., & Denny, J. C. (2014) · Bioinformatics · doi:10.1093/bioinformatics/btu197 · Cited by 435
Wei, W., Bastarache, L. A., Carroll, R. J., Marlo, J. E., Osterman, T. J., Gamazon, E. R., Cox, N. J., Roden, D. M., & Denny, J. C. (2017) · PLoS ONE · doi:10.1371/journal.pone.0175508 · Cited by 364
Huebbe, P., & Rimbach, G. H. (2017) · Ageing Research Reviews · doi:10.1016/j.arr.2017.06.002 · Cited by 202 · cited 1×
“Chronologically, e4 is believed to be the ancestral allele from which the e3 and e2 variants sequentially evolved over 200,000 years ago [1].”
BackgroundOxidized LDL triggers changes in oxidative stress and inflammatory biomarkers in human macrophages
Lara-Guzmán, O. J., Gil-Izquierdo, Á., Medina, S., Osorio, E., Álvarez-Quintero, R., Zuluaga, N., Oger, C., Galano, J.-M., Durand, T., & Muñoz-Durango, K. (2018) · Redox Biology · doi:10.1016/j.redox.2017.11.017 · Cited by 194 · cited 7×
“As is typically reported, e2e3 and e2e4 were protective for hypercholesterolaemia compared to e3e3 (with lower levels of “bad” cholesterol indicators; total cholesterol, LDL and APOB). e2e3 also had increased levels of “good” cholesterol indicators (HDL-cholesterol and APOA) and was associated with reduced risk of IHD…”
BackgroundInfluentialTudorache, I. F., Trusca, V. G., & Gafencu, A. V. (2017) · Computational and Structural Biotechnology Journal · doi:10.1016/j.csbj.2017.05.003 · Cited by 186 · cited 1×
“The polymorphisms affect the binding affinities of APOE for lipid and the LDLR (appendix p 34 figure S1), resulting in various effects on biomarkers of lipid and cholesterol health, and differential risks of a variety of health outcomes [2].”
Background
Cited by
Sorted by citations
Apolipoprotein E in lipid metabolism and neurodegenerative disease
Yang, L. G., March, Z. M., Stephenson, R. A., & Narayan, P. S. (2023) · Trends in Endocrinology & Metabolism · doi:10.1016/j.tem.2023.05.002 · Cited by 286
“In fact, a recent study of samples from the UK Biobank discovered that the commonAPOE alleles were associated with the risk of a multitude of conditions including obesity, liver disease, chronic airway obstruction, and type 2 diabetes [29,59,60].”
Fernández-Calle, R., Konings, S. C., Frontiñán-Rubio, J., García-Revilla, J., Camprubí-Ferrer, L., Svensson, M., Martinson, I., Boza-Serrano, A., Venero, J. L., Nielsen, H. M., et al. (2022) · Molecular Neurodegeneration · doi:10.1186/s13024-022-00566-4 · Cited by 278
Identifying individuals with high risk of Alzheimer’s disease using polygenic risk scores
Leonenko, G., Baker, E. A., Stevenson‐Hoare, J. O., Sierksma, A. S. R., Fiers, M. W. E. J., Williams, J. H., Strooper, B. D., & Escott‐Price, V. (2021) · Nature Communications · doi:10.1038/s41467-021-24082-z · Cited by 233
Multifaceted roles of APOE in Alzheimer disease
Jackson, R. J., Hyman, B. T., & Serrano-Pozo, A. (2024) · Nature Reviews Neurology · doi:10.1038/s41582-024-00988-2 · Cited by 193
“By contrast, in the same registries, APOE ε2 has been associated with lower LDL cholesterol levels, increased triglyceride levels and increased risk of peripheral vascular disease 87,88 .”
The duality of amyloid-β: its role in normal and Alzheimer’s disease states
Azargoonjahromi, A. (2024) · Molecular Brain · doi:10.1186/s13041-024-01118-1 · Cited by 214
“Of note, homozygosity for the APOE ε4 allele further increases the risk of developing AD [268].”
Background
Metadata
- Authors
- Lumsden, A. L., Mulugeta, A., Zhou, A., & Hyppönen, E.
- Affiliations
- University of South Australia (AU)
- Corresponding author
- Hyppönen, Elina
- Venue
- eBioMedicine
- Publisher
- Elsevier BV
- Published
- 2020-09
- Volume
- 59
- Pages
- 102954
- ISSN
- 2352-3964 (ISSN-L)
- PMC
- PMC7452404
- OpenAlex
- W3069395596
- Cited by
- 317
- References
- 31
- Citations by year
- 2026: 54 · 2025: 72 · 2024: 82 · 2023: 59 · 2022: 33 · 2021: 17
- FWCI
- 3.88
- Type
- journal article
- Language
- en
- Open access
- gold
- doi.org
- Licence
- Locations
- EBioMedicine (publishedVersion, cc-by-nc-nd)
- PubMed Central (publishedVersion, cc-by-nc-nd)
- PubMed (publishedVersion)
- UniSA Research Outputs Repository (University of South Australia) (submittedVersion, other-oa)
- Adelaide Research & Scholarship (AR&S) (University of Adelaide) (submittedVersion, cc-by-nc-nd)
- DOAJ (DOAJ: Directory of Open Access Journals) (submittedVersion, cc-by-sa)
- Funders
- UK Biobank (GNT1123603)
- National Health and Medical Research Council (GNT1157281)
- Topics
- Life Sciences › Biochemistry, Genetics and Molecular Biology › Genetics › Genetic Associations and Epidemiology
- Health Sciences › Medicine › Cardiology and Cardiovascular Medicine › Lipoproteins and Cardiovascular Health
- Life Sciences › Neuroscience › Cellular and Molecular Neuroscience › Alzheimer's disease research and treatments
- Keywords
- apolipoprotein E, APOE genotype, APOE ε4, APOE ε2, Alzheimer's disease, hypercholesterolemia, ischemic heart disease, phenome-wide association study, disease risk, obesity, type 2 diabetes, peripheral vascular disease, thromboembolism, arterial aneurysm, peptic ulcer, hallux valgus, cardiovascular disease, genetic risk factors
- MeSH terms
- Adult, Aged, Alleles, Apolipoproteins E, Female, Genotype, United Kingdom, Humans, Male, Middle Aged, Phenotype, Population Surveillance, Registries, Risk Factors, Case-Control Studies, Biological Specimen Banks, Risk Assessment, Genetic Predisposition to Disease, Genetic Association Studies
About these checks
Registry, retraction, Cites and statistics results are computed, not judged, with one exception: a printed reference that no index lists is read once by a model before it counts as a citation error. Claims are extracted by a model and kept only when their quote appears verbatim in the text; each cited source is then checked, with a model’s help, for whether it says what the claim relies on. Those verdicts can be wrong — read the claim’s quote and the cited source before relying on one.
Statistics and arithmetic are recomputed, not judged.
Confidence bands are shown only for fields calibrated on our annotated test set. None is calibrated yet, so no band is shown.
What counts as a claim ›How we measure confidence ›How we check this ›
Are you an author, or do you see a problem with this page? Request a review
