

The DOI matches its Crossref record; 47 of the 47 references it cites were found in a registry or an index.
Prediction of two-phase flow patterns in upward inclined pipes via deep learning
Open accessAbstract
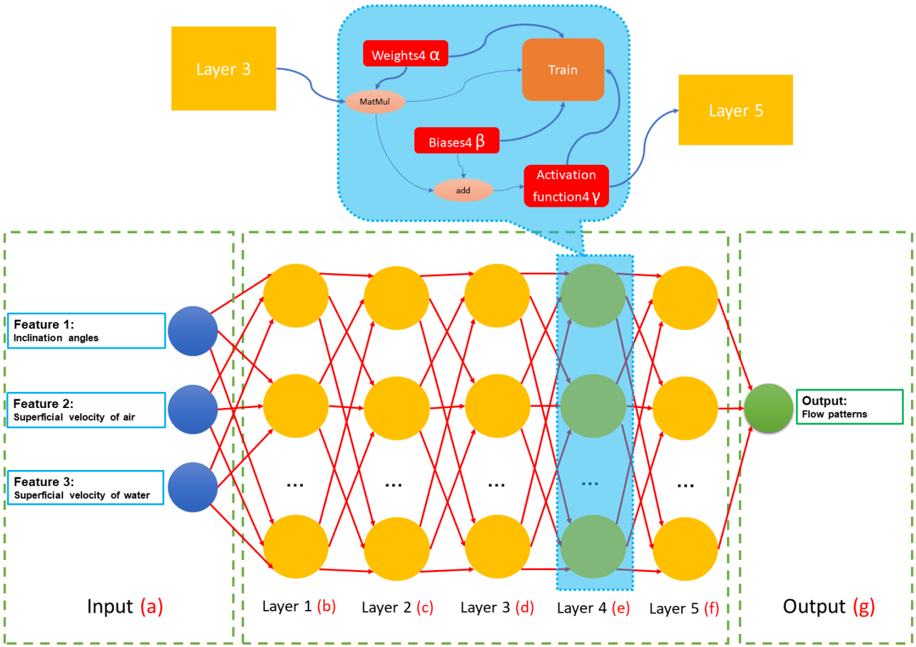
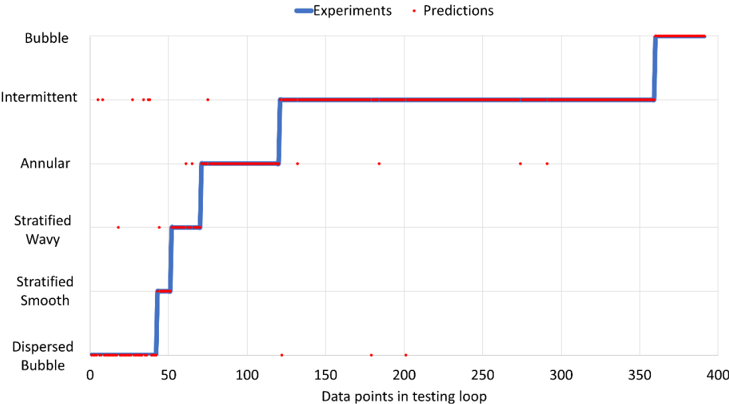
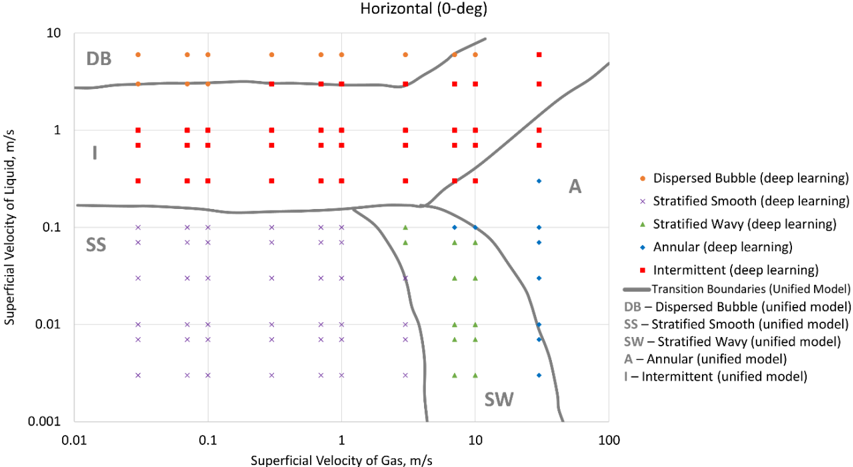
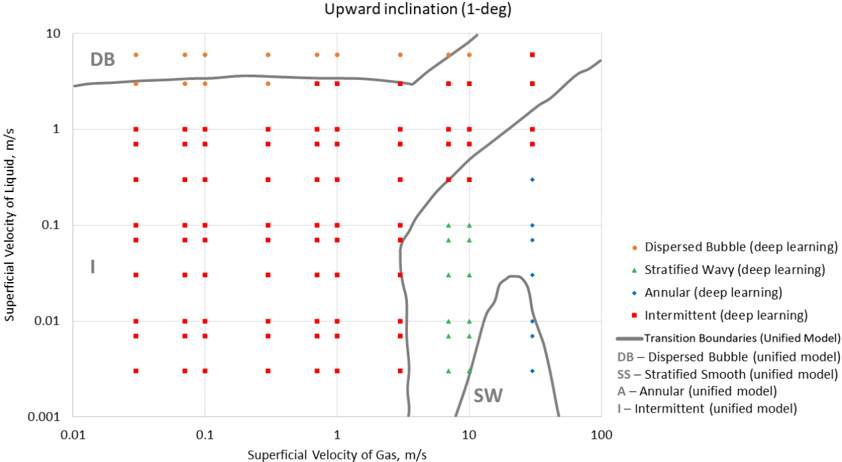
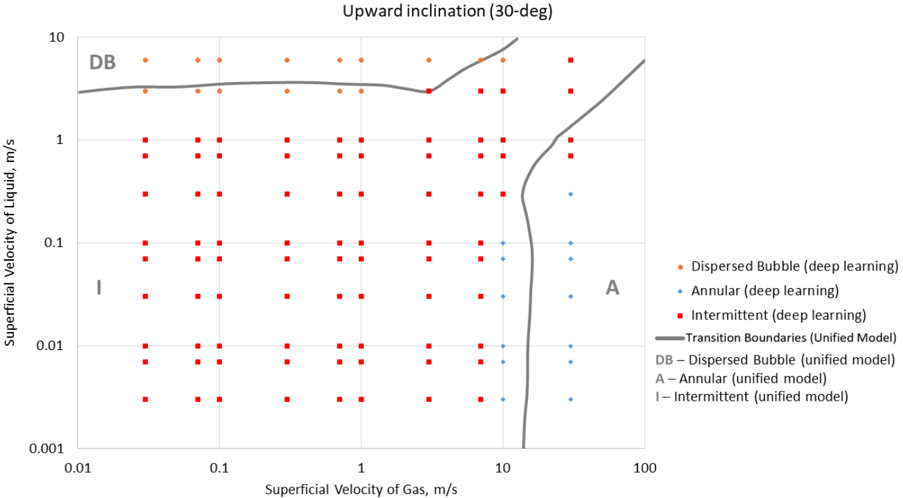
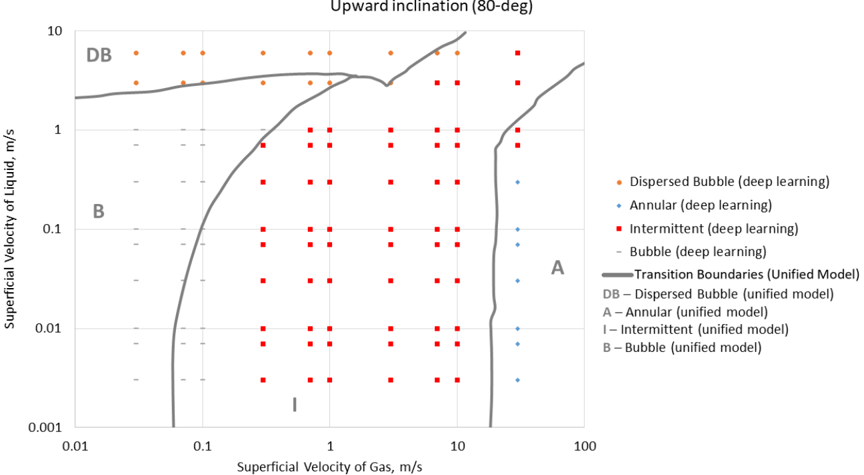
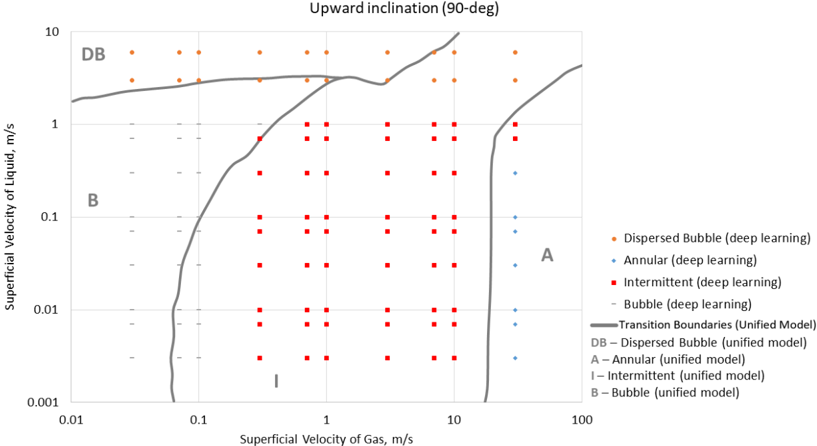
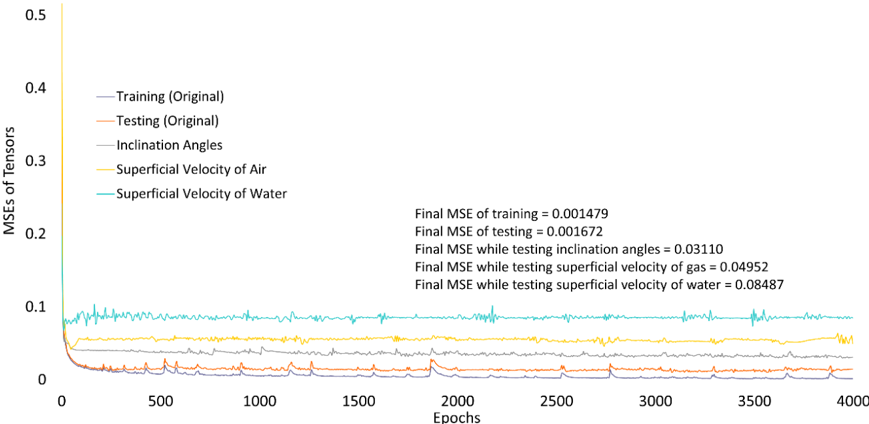
The industrial process involving gas liquid flows is one of the most frequently encountered phenomena in the energy sectors. However, traditional methods are practically unable to reliably identify flow patterns if additional independent variables/parameters are to be considered rather than gas and liquid superficial velocities. In this paper, we reported an approach to predict flow pattern along upward inclined pipes (0–90°) via deep learning neural networks, using accessible parameters as inputs, namely, superficial velocities of individual phase and inclination angles. The developed approach is equipped with deep learning neural network for flow pattern identification by experimental datasets that were reported in the literature. The predictive model was further validated by comparing its performance with well-established flow regime forecasting methods based on conventional flow regime maps. Besides, the intensity of key features in flow pattern prediction was identified by the deep learning algorithm, which is difficult to be captured by commonly used correlation approaches.
Overview
The claims and statistics of this paper haven’t been checked yet.
Run the check — free, no account needed. It reads the open-access text and checks the sources it cites.
Integrity signals
Registry
Cites
Statistics
Figures
Verification
Claims the paper makes
The claims and statistics of this paper haven’t been checked yet.
Run the check — free, no account needed. It reads the open-access text and checks the sources it cites.
Claims other papers make about this one
Each is checked against this paper’s own text: does it say what the citing paper says it does?
In the citing paper
“However, since Hinton proposed the deep belief networks (DBN) in 2006 [90], the deep network-based method has accomplished significant achievements in various sectors [91,92,93,94].”
From Semantic Terrain Segmentation in the Navigation Vision of Planetary Rovers—A Systematic Literature Review (2022) · cites this paper as [91]
Self-check
Percentages, sums and reported differences re-computed from the paper’s own numbers.
The self-check needs the paper’s full text.
Citations
Cites
A fast learning algorithm for deep belief nets
Hinton, G. E., Osindero, S., & Teh, Y.-W. (2006) · Neural Computation · doi:10.1162/neco.2006.18.7.1527 · Cited by 16,336
Modelling flow pattern transitions for steady upward gas‐liquid flow in vertical tubes
Taitel, ., Barnea, D., & Dukler, A. E. (1980) · AIChE Journal · doi:10.1002/aic.690260304 · Cited by 1,795
The correlation coefficient: its values range between +1/-1, or do they?
Ratner, B. (2009) · Journal of Targeting, Measurement and Analysis for Marketing · doi:10.1057/jt.2009.5 · Cited by 1,612
A unified model for predicting flow-pattern transitions for the whole range of pipe inclinations
Barnea, D. (1987) · International Journal of Multiphase Flow · doi:10.1016/0301-9322(87)90002-4 · Cited by 775
Hewitt, G. F., & HALL-TAYLOR, N. S. (1970) · Cited by 596
Wen, L., Zhou, K., Yang, S., & Lu, X. (2019) · Energy · doi:10.1016/j.energy.2019.01.075 · Cited by 419
Chang, Z., Zhang, Y., & Chen, W. (2019) · Energy · doi:10.1016/j.energy.2019.07.134 · Cited by 383
Unified Model for Gas-Liquid Pipe Flow via Slug Dynamics—Part 1: Model Development
Zhang, H., Wang, Q., Sarica, C., & Brill, J. P. (2003) · Journal of Energy Resources Technology · doi:10.1115/1.1615246 · Cited by 377
A Pearson’s correlation coefficient based decision tree and its parallel implementation
Mu, Y., Liu, X., & Wang, L. (2018) · Information Sciences · doi:10.1016/j.ins.2017.12.059 · Cited by 336
Self-citationLin, Z., & Liu, X. (2020) · Energy · doi:10.1016/j.energy.2020.117693 · Cited by 272
Self-citation
Cited by
Short-term offshore wind speed forecast by seasonal ARIMA - A comparison against GRU and LSTM
Liu, X., Lin, Z., & Feng, Z. (2021) · Energy · doi:10.1016/j.energy.2021.120492 · Cited by 461
Self-citationWind power forecasting – A data-driven method along with gated recurrent neural network
Kisvari, A., Lin, Z., & Liu, X. (2021) · Renewable Energy · doi:10.1016/j.renene.2020.10.119 · Cited by 405
Self-citationZhu, L.-T., Chen, X.-Z., Ouyang, B., Yan, W.-C., Lei, H., Chen, Z., & Luo, Z.-H. (2022) · Industrial & Engineering Chemistry Research · doi:10.1021/acs.iecr.2c01036 · Cited by 294
Prediction of coalbed methane production based on deep learning
Guo, Z., Zhao, J., You, Z., Li, Y., Zhang, S., & Chen, Y. (2021) · Energy · doi:10.1016/j.energy.2021.120847 · Cited by 97
Advances in the modeling of multiphase flows and their application in nuclear engineering—A review
Wu, M., Zhang, J., Gui, N., Zou, Q., Yang, X., Tu, J. Y., Jiang, S., & Liu, Z. (2024) · Experimental and Computational Multiphase Flow · doi:10.1007/s42757-024-0202-5 · Cited by 86
Metadata
- Authors
- Lin, Z., Liu, X., Lao, L., & Liu, H.
- Affiliations
- Northumbria University (GB)
- University of Glasgow (GB)
- Cranfield University (GB)
- Harbin Engineering University (CN)
- Corresponding author
- Liu, Xiaolei
- Venue
- Energy
- Publisher
- Elsevier BV
- Published
- 2020-11
- Volume
- 210
- Pages
- 118541
- ISSN
- 0360-5442 (ISSN-L)
- OpenAlex
- W3049349475
- Cited by
- 142
- References
- 47
- Citations by year
- 2026: 21 · 2025: 24 · 2024: 30 · 2023: 22 · 2022: 23 · 2021: 17 · 2020: 5
- FWCI
- 8.05
- Type
- journal article
- Language
- en
- Open access
- green
- eprints.gla.ac.uk
- Licence
- cc-by-sa
- www.elsevier.com/tdm/userlicense/1.0/ (tdm)
- www.elsevier.com/legal/tdmrep-license (tdm)
- Locations
- Energy (publishedVersion)
- ENLIGHTEN (Jurnal Bimbingan dan Konseling Islam) (acceptedVersion, cc-by-sa)
- Northumbria Research Link (Northumbria University) (submittedVersion)
- RePEc: Research Papers in Economics (submittedVersion)
- CERES (Cranfield University) (submittedVersion, cc-by-nc-nd)
- Topics
- Physical Sciences › Engineering › Mechanical Engineering › Heat Transfer and Boiling Studies
- Physical Sciences › Physics and Astronomy › Instrumentation › Flow Measurement and Analysis
- Physical Sciences › Engineering › Ocean Engineering › Offshore Engineering and Technologies
- Keywords
- two-phase flow, flow regime prediction, gas-liquid two-phase flow, superficial gas velocity, inclination angle, artificial neural networks, flow regime map, feature importance
About these checks
Registry, retraction, Cites and statistics results are computed, not judged, with one exception: a printed reference that no index lists is read once by a model before it counts as a citation error. Claims are extracted by a model and kept only when their quote appears verbatim in the text; each cited source is then checked, with a model’s help, for whether it says what the claim relies on. Those verdicts can be wrong — read the claim’s quote and the cited source before relying on one.
Statistics and arithmetic are recomputed, not judged.
Confidence bands are shown only for fields calibrated on our annotated test set. None is calibrated yet, so no band is shown.
What counts as a claim ›How we measure confidence ›How we check this ›
Are you an author, or do you see a problem with this page? Request a review
Data sources
Bibliographic data: Semantic Scholar, OpenAlex, Crossref.
Contains information from the Semantic Scholar Academic Graph Datasets, made available under the ODC Attribution License (ODC-BY 1.0).
Semantic Scholar’s data is described in: Kinney, R., et al. (2023). The Semantic Scholar Open Data Platform. arXiv:2301.10140.
