

The DOI matches its Crossref record; 28 of the 28 references it cites were found in a registry or an index.
The function of Piezo1 in hepatoblastoma metastasis and its potential transduction mechanism
Open accessAbstract
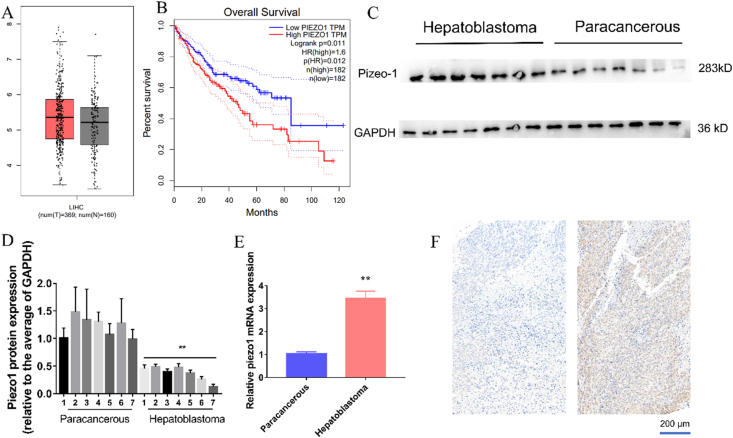
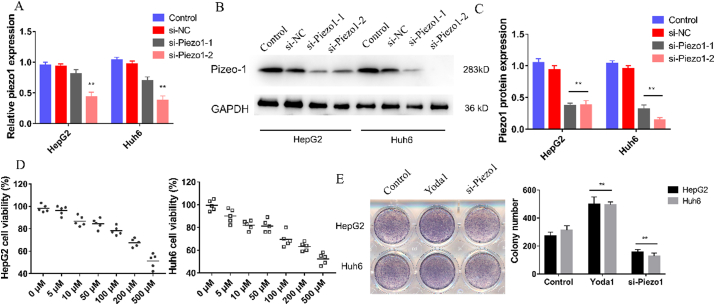
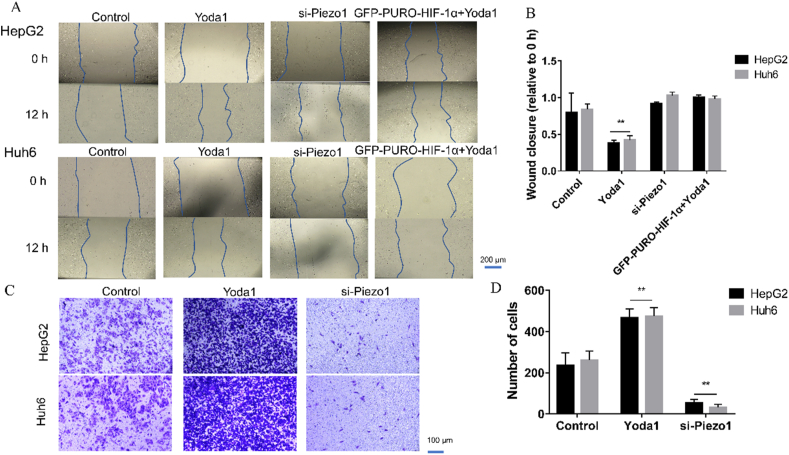
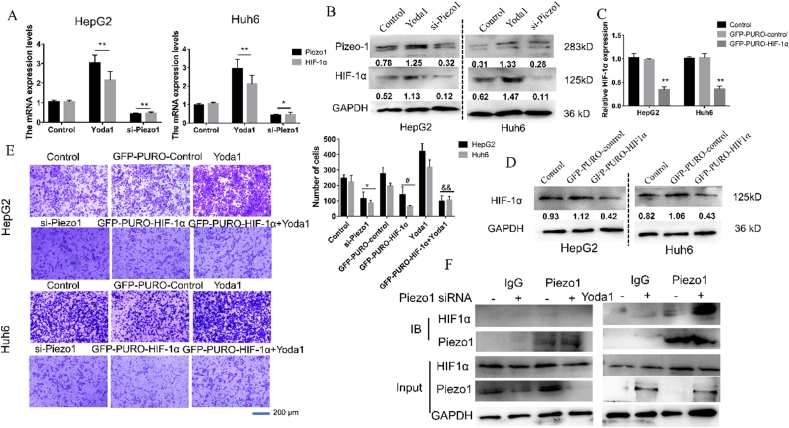
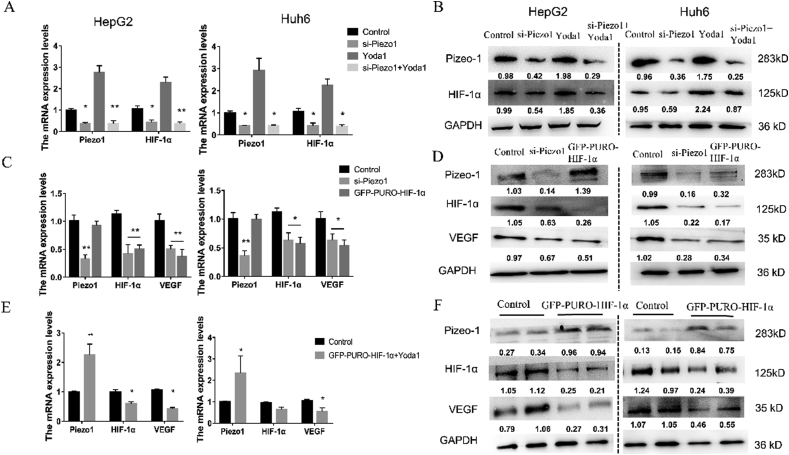
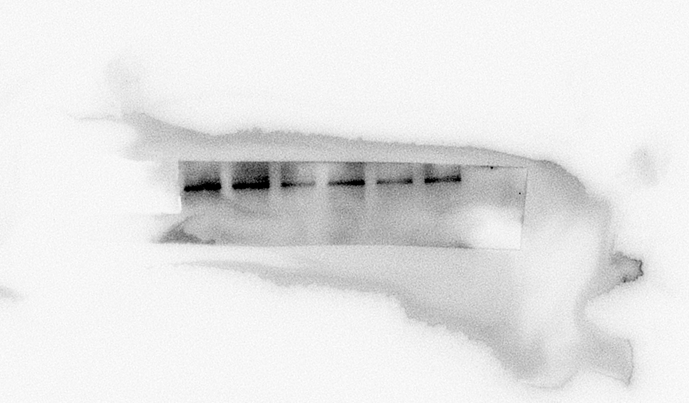
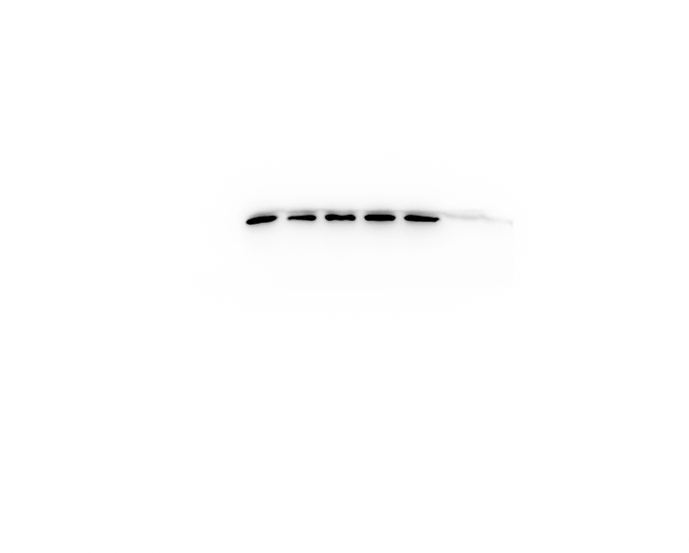
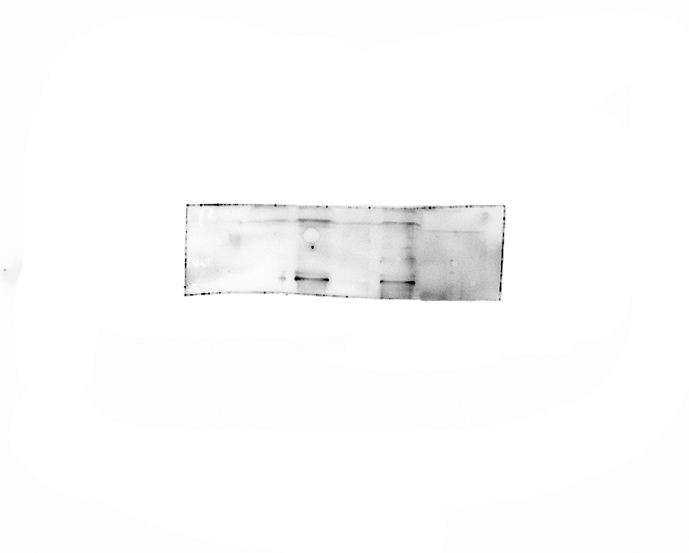
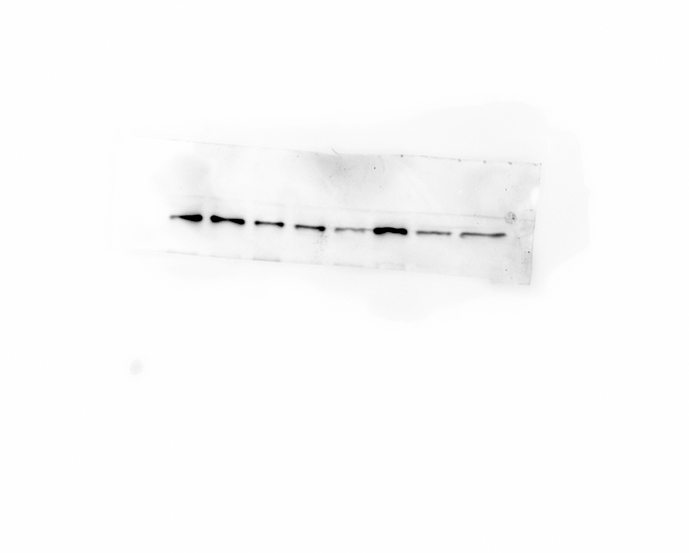
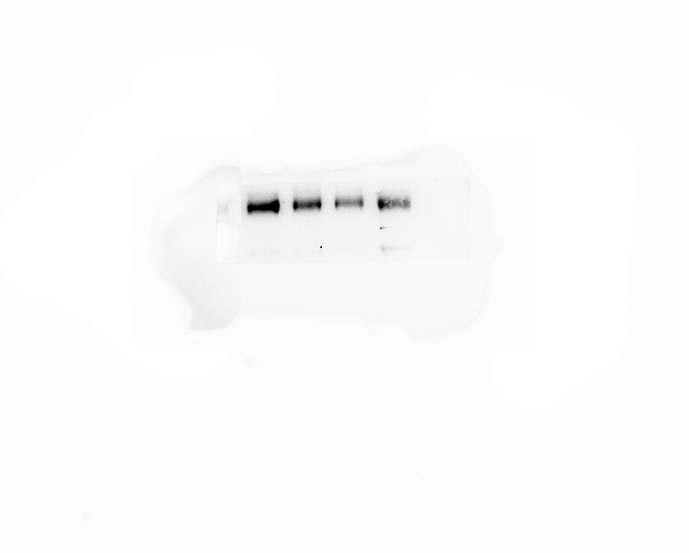
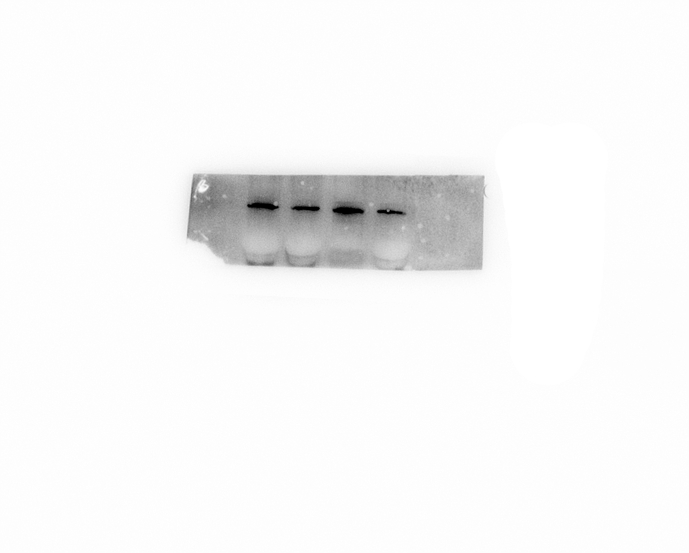
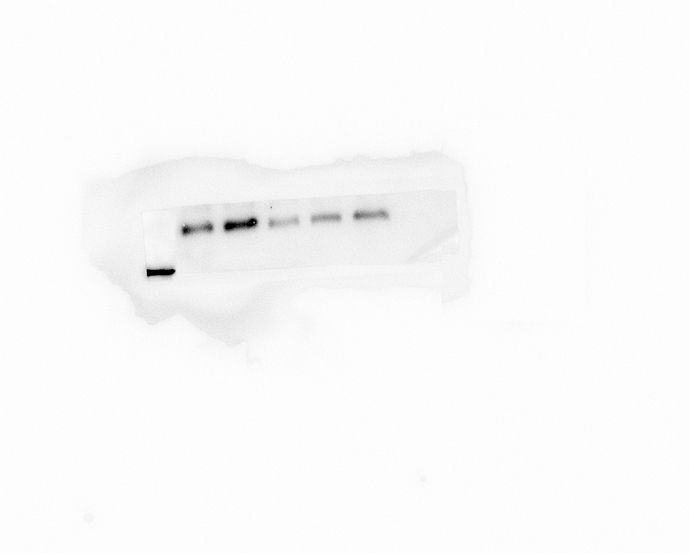
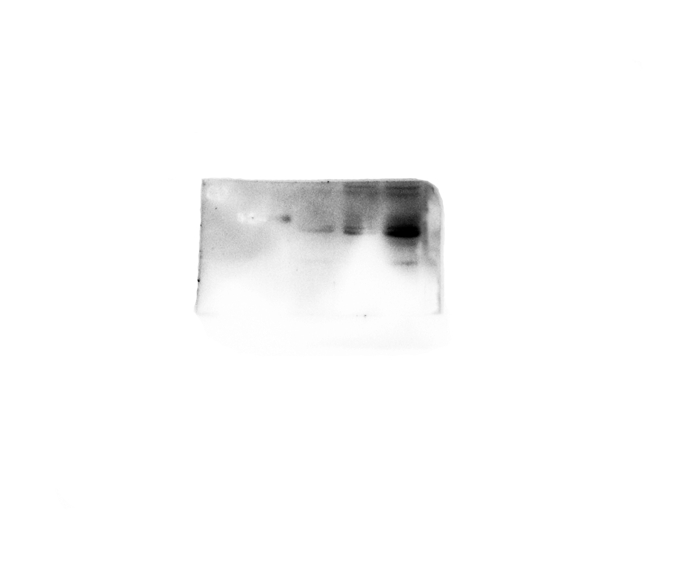
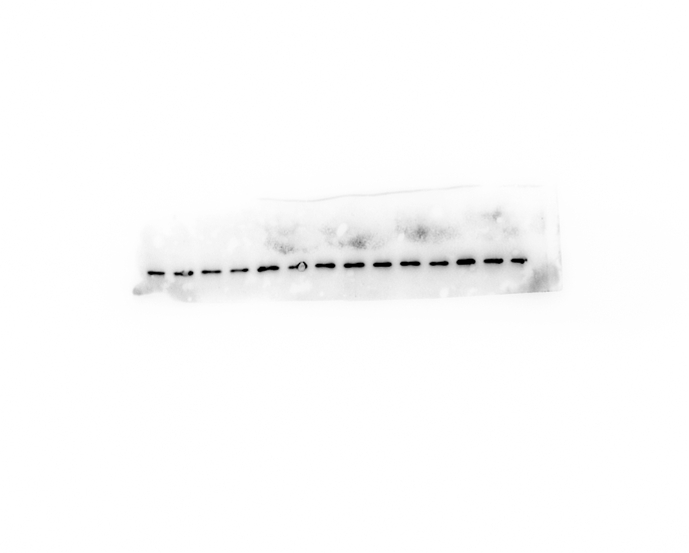
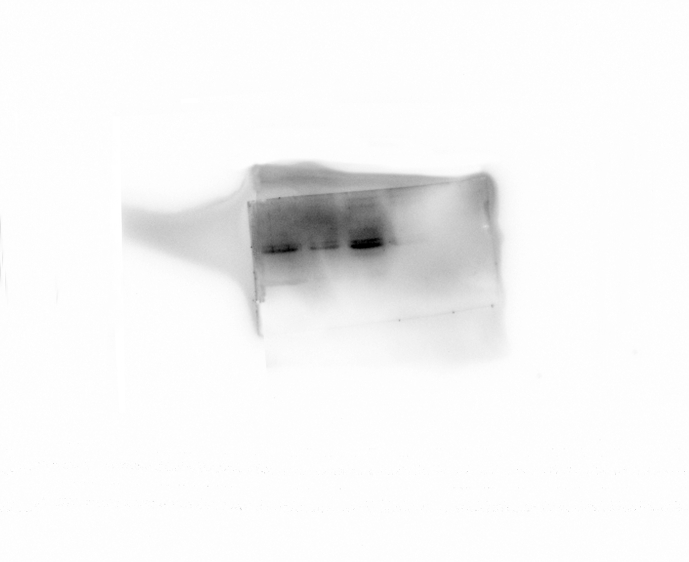
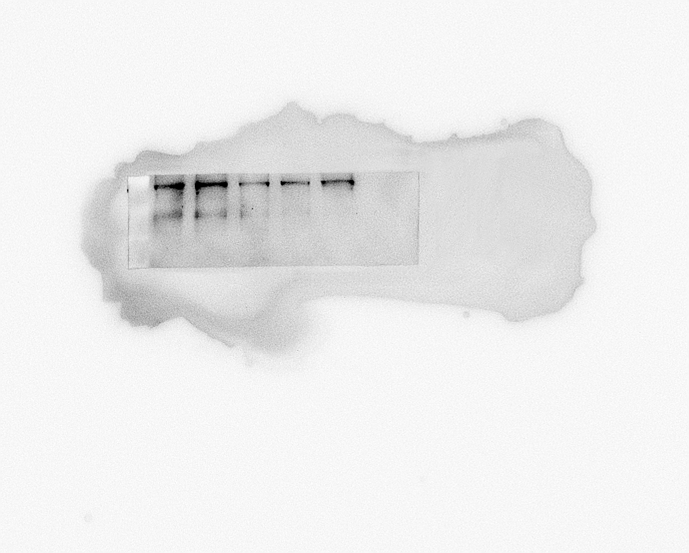
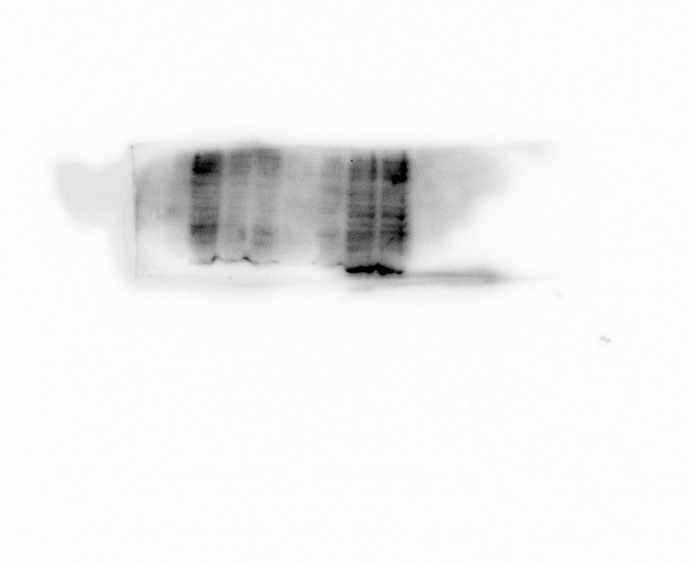
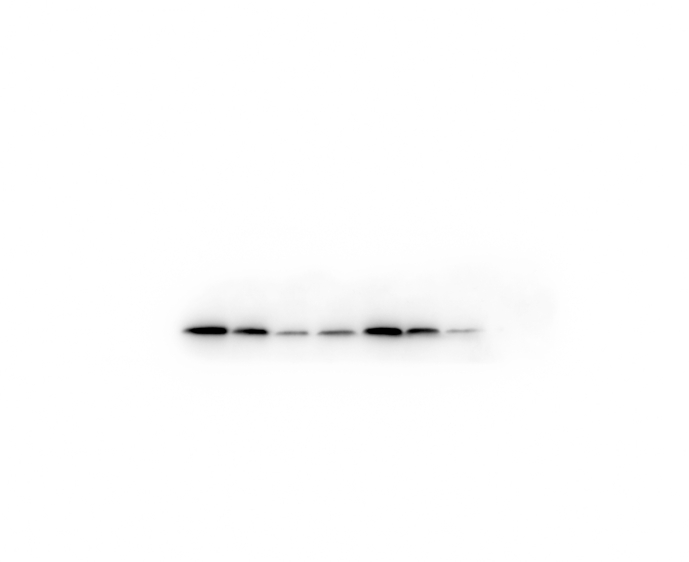
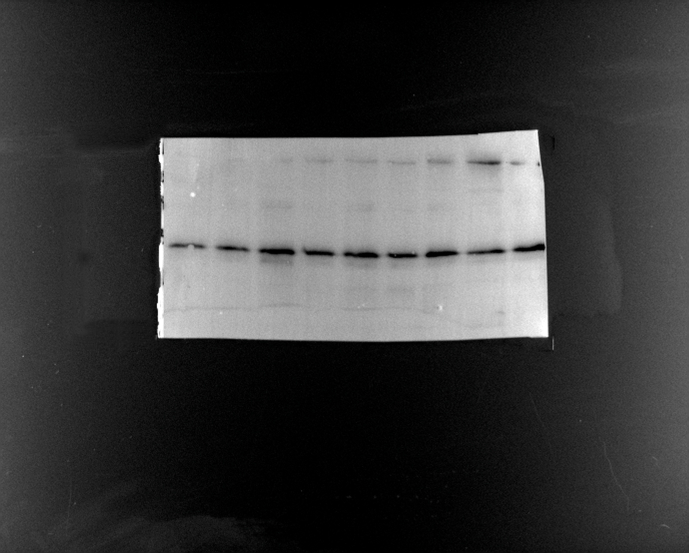
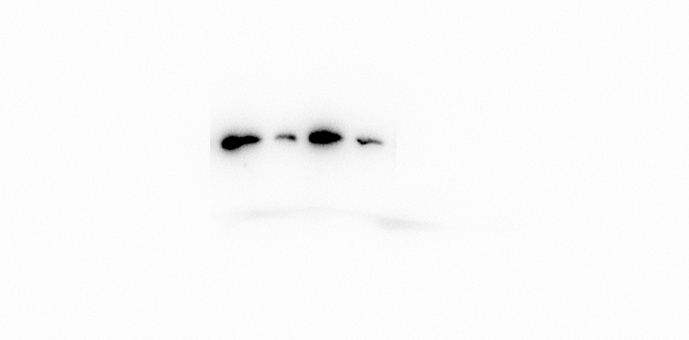
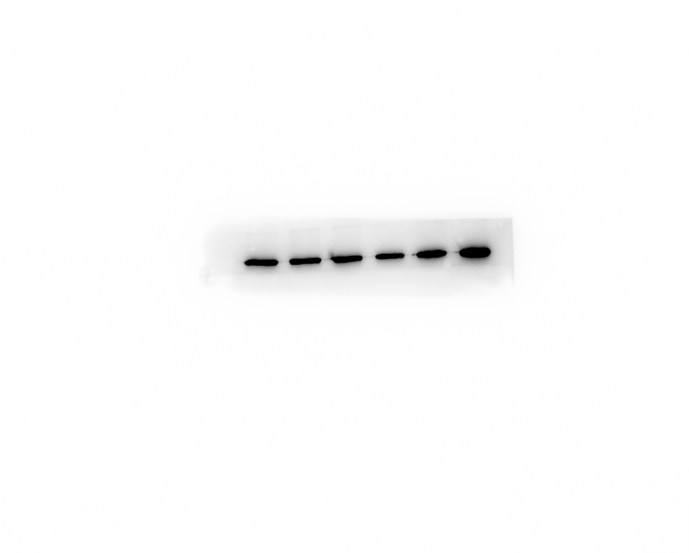
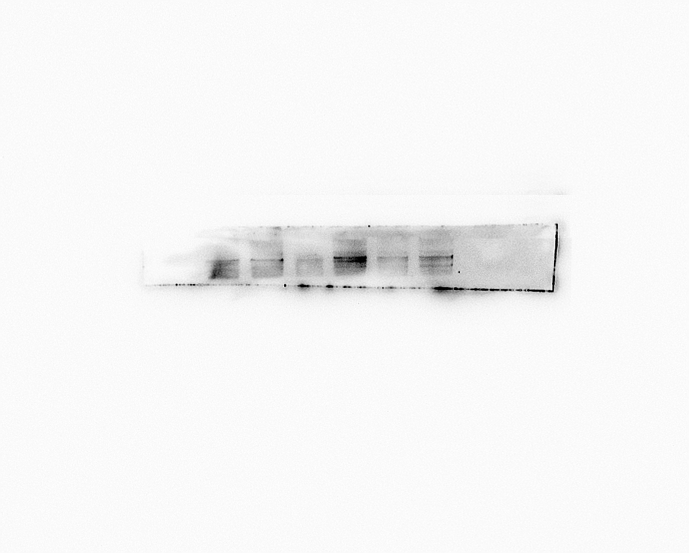
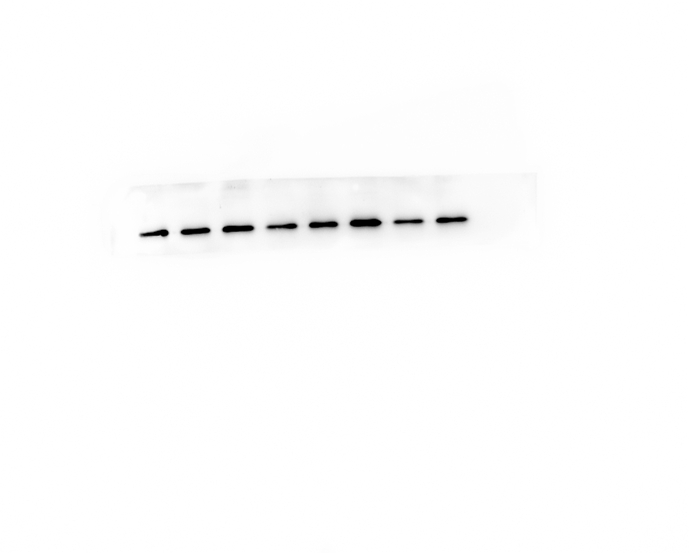
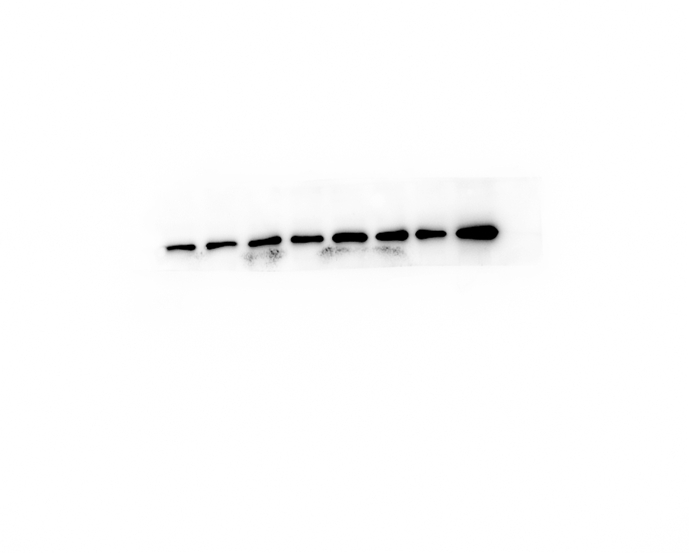
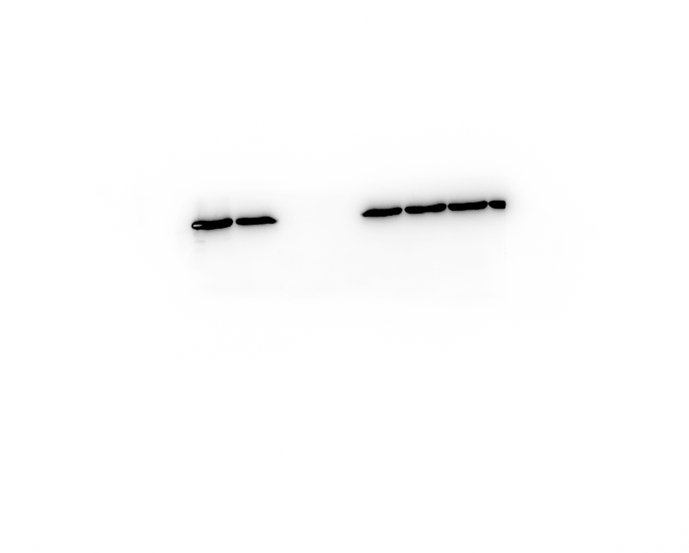
Background: Hepatoblastoma (HB) is the most common primary malignant liver tumor in children. The prognosis of HB metastasis is poor, despite the increasing diversity of treatment. Piezo, a ubiquitously expressed membrane mechano-transduction protein, is involved in the process of tumor cell migration. Under the gene expression profiling interactive analysis (GEPIA) database, Piezo1 was highly expressed in HB and negatively correlated with the overall survival time. Methods: Firstly, the expression of Piezo1 in both paracancerous and HB tissues (n = 7) was detected, and the prognostic value of Piezo1 was assessed in HB (n = 160) patients. Secondly, the inhibition and overexpression of Piezo1were executed in two HB cell lines, HepG2 and Huh 6. Methyl thiazolyl tetrazolium (MTT), wound healing and trans-well assays were performed to identify the effect of Piezo1 on the proliferation and metastasis of HB cells, respectively. In addition, a co-immunoprecipitation assay was performed to determine whether Piezo1 has an interaction with HIF-1α. Finally, the expressions level of Piezo1, HIF-1α, and VEGF by overexpression/inhibition each other were detected by RT-qPCR and western blots to find a possible signaling channel in HB metastasis. Results: We found that Piezo1 was highly expressed in HB tissues and associated with poor prognosis of patients. Piezo1 was related to cell proliferation in HepG2 and Huh 6 cells. We also found that Piezo1 stimulated HIF-1α expression. Meanwhile, overexpression of Piezo1 promoted the migration and invasion of HB cells, while the promotion was not detected when HIF-1α was suppressed. Additionally, the silencing of HIF-1α inhibited the expression of VEGF, but showed no effect on Piezo1 expression. Conclusion: In this study, we identified that Piezo1 was involved in HB metastasis, and the Piezo1-HIF-1α-VEGF axis could be a possible signaling pathway in HB metastasis.
Overview
The claims and statistics of this paper haven’t been checked yet.
Run the check — free, no account needed. It reads the open-access text and checks the sources it cites.
Integrity signals
Registry
Cites
Statistics
Figures


Verification
Claims the paper makes
The claims and statistics of this paper haven’t been checked yet.
Run the check — free, no account needed. It reads the open-access text and checks the sources it cites.
Claims other papers make about this one
Each is checked against this paper’s own text: does it say what the citing paper says it does?
The cited source says what the claim attributes to it.
In the citing paper
“Additionally, increased Piezo1 levels may promote HB cell movement and infiltration through the Piezo1/HIF-1α/VEGF axis.104”
From Mechanosensitive calcium ion channels Piezo1: A therapeutic target in liver disease (2025) · cites this paper as [104]
Self-check
Percentages, sums and reported differences re-computed from the paper’s own numbers.
The self-check needs the paper’s full text.
Citations
Cites
1 retracted
Chen, Z., Zhu, Y., Dong, Y., Zhang, P., Han, X., Jin, J., & Ma, X. (2017) · Clinical Science · doi:10.1042/cs20171069 · Cited by 57
Self-citationRetractedPrimary liver cancer: Worldwide incidence and trends
Bosch, F. X., Ribes, J., Díaz, M., & Clèries, R. (2004) · Gastroenterology · doi:10.1053/j.gastro.2004.09.011 · Cited by 2,491
Piezo1 integration of vascular architecture with physiological force
Li, J., Hou, B., Tumova, S., Muraki, K., Bruns, A. F., Ludlow, M. J., Sedó, A., Hyman, A. J., McKeown, L., Young, R. S., et al. (2014) · Nature · doi:10.1038/nature13701 · Cited by 1,262
Meyers, R. L., Maibach, R., Hiyama, E., Häberle, B., Krailo, M., Rangaswami, A. A., Aronson, D. C., Malogolowkin, M. H., Perilongo, G., von Schweinitz, D., et al. (2016) · The Lancet Oncology · doi:10.1016/s1470-2045(16)30598-8 · Cited by 443
Chen, X., Wanggou, S., Bodalia, A., Zhu, M. S., Dong, W., Fan, J. J., Yin, W. C., Min, H.-K., Hu, M., Draghici, D., et al. (2018) · Neuron · doi:10.1016/j.neuron.2018.09.046 · Cited by 401
Structure and mechanogating of the mammalian tactile channel PIEZO2
Wang, L., Zhou, H., Zhang, M., Liu, W., Deng, T., Zhao, Q., Li, Y., Lei, J., Li, X., & Xiao, B. (2019) · Nature · doi:10.1038/s41586-019-1505-8 · Cited by 381
TWIST activation by hypoxia inducible factor-1 (HIF-1): Implications in metastasis and development
Yang, M., & Wu, K.-J. (2008) · Cell Cycle · doi:10.4161/cc.7.14.6324 · Cited by 306
Cell surface flip-flop of phosphatidylserine is critical for PIEZO1-mediated myotube formation
Tsuchiya, M., Hara, Y., Okuda, M., Itoh, K., Nishioka, R., Shiomi, A., Nagao, K., Mori, M., Mori, Y., Ikenouchi, J., et al. (2018) · Nature Communications · doi:10.1038/s41467-018-04436-w · Cited by 178
Piezo1 forms mechanosensitive ion channels in the human MCF-7 breast cancer cell line
Li, C., Rezania, S., Kammerer, S., Sokolowski, A., DeVaney, T. T. J., Gorischek, A., Jahn, S. W., Hackl, H., Groschner, K., Windpassinger, C., et al. (2015) · Scientific Reports · doi:10.1038/srep08364 · Cited by 169
McHugh, B. J., Murdoch, A., Haslett, C., & Sethi, T. (2012) · PLoS ONE · doi:10.1371/journal.pone.0040346 · Cited by 169
Cited by
Liu, Y., Xu, Y., Long, Y.-Y., Xiao, H., Ma, Y., & Li, Y.-W. (2025) · Frontiers in Molecular Biosciences · doi:10.3389/fmolb.2025.1693456 · Cited by 43
Entangled cellular and molecular relationships at the sensory neuron-cancer interface
Sur, D., Zeng, Y., Kobayashi, H. H., Zhi, X., Goetz, M. R., Müller, C., Zavitsanou, A., Picoli, C. C., Matos, A. A. M., Pareja, J. R., et al. (2025) · Neuron · doi:10.1016/j.neuron.2025.07.017 · Cited by 32
Piezo1 in Digestive System Function and Dysfunction
He, J., Xie, X., Xiao, Z., Qian, W., Zhang, L., & Hou, X. (2023) · International Journal of Molecular Sciences · doi:10.3390/ijms241612953 · Cited by 21
Fluid shear stress-mediated Piezo1 alleviates osteocyte apoptosis by activating the PI3K/Akt pathway
Zhan, H., Xie, D., Yan, Z., Yi, Z., Xiang, D., Niu, Y., Liang, X., Geng, B., Wu, M., Xia, Y., et al. (2024) · Biochemical and Biophysical Research Communications · doi:10.1016/j.bbrc.2024.150391 · Cited by 13
Self-citationPiezo Family: From Structure to Therapeutic Agents in Cancer
Xu, K., Liu, M., Wang, L., Zhan, G., & He, G. (2026) · Journal of Medicinal Chemistry · doi:10.1021/acs.jmedchem.5c03200 · Cited by 12
Mechanosensitive calcium ion channels Piezo1: A therapeutic target in liver disease
Liu, J., Wang, X., He, F., Chen, X., & Yi, X. (2025) · Molecular Therapy Nucleic Acids · doi:10.1016/j.omtn.2025.102695 · Cited by 10
Insights into the mechanisms of angiogenesis in hepatoblastoma
Kong, M., Zhai, Y., Liu, H., Zhang, S., Chen, D., Li, W., Ma, X., & Ji, Y. (2025) · Frontiers in Cell and Developmental Biology · doi:10.3389/fcell.2025.1535339 · Cited by 11
PIEZO1 channel mechanosensing in hepatobiliary physiology and disease
Konstantinou, C., Patel, S. D., Lalor, P. F., Moore, J. B., Roberts, L. D., Endesh, N., Wah, T. M., Samson, A., Hakeem, A. R., Prasad, K. R., et al. (2025) · American Journal of Physiology-Cell Physiology · doi:10.1152/ajpcell.00782.2025 · Cited by 4
Prognosis and Clinical Significance of Piezo2 in Tumor: A Meta-analysis and Database Validation
Liang, T., Wang, J., Zhu, C., Hu, Y., Gao, Z., & Da, M. (2024) · Combinatorial Chemistry & High Throughput Screening · doi:10.2174/0113862073251440231025111358 · Cited by 4
Ali, M. M., Awan, F., Jamil, M. U., Ijaz, M. U., Ullah, A., & Shehzad, W. (2025) · Journal of Trace Elements in Medicine and Biology · doi:10.1016/j.jtemb.2025.127790 · Cited by 4
Kogami, M., Kato, Y., Ito, S., Uchida, K., Inoue, H., Hidaka, Y., Tanifuji, S., Yokotsuka, M., Yamamoto, Y., Nagao, T., et al. (2026) · Circulation Research · doi:10.1161/circresaha.125.327869 · Cited by 3
Yan, X., Zeng, W., Ma, P., Yao, J., Ma, T., & Li, Y. (2025) · Genes & Diseases · doi:10.1016/j.gendis.2025.101925 · Cited by 2
Beyranvand, P. (2026) · Journal of Cancer Biomoleculars and Therapeutics · doi:10.62382/jcbt.v3i1.83 · Cited by 2
Analysis and verification of ferroptosis-related genes in pediatric hepatoblastomaPreprint
Ye, X., Chen, W., Xia, Y., Chen, Z., Zheng, Y., & Wang, B. (2024) · Research Square · doi:10.21203/rs.3.rs-3862584/v1
Self-citationPIEZO Channels in Breast Cancer: Emerging Roles and Therapeutic Potential
Adams, E., Reddock, M., Gillen, B., Wang, X., Wang, Q., Opyrchal, M., & Yu, T. (2026) · Receptors · doi:10.3390/receptors5020019
Bu, Y.-Y., Li, X., Zhou, T.-Y., Gu, J.-H., Zhu, J.-N., Li, J.-L., Zeng, B.-B., Zu, W.-B., & Tang, D. (2026) · World Journal of Gastroenterology · doi:10.3748/wjg.121284
Metadata
- Authors
- Ye, X., Xia, Y., Zheng, Y., Chen, W., Chen, Z., Cheng, Z., & Wang, B.
- Affiliations
- Shenzhen Children's Hospital (CN)
- Corresponding author
- Wang, Bin
- Venue
- Heliyon
- Publisher
- Elsevier BV
- Published
- 2022-09
- Volume
- 8
- Issue
- 9
- Pages
- e10301
- ISSN
- 2405-8440 (ISSN-L)
- PMC
- PMC9463386
- OpenAlex
- W4294361000
- Cited by
- 15
- References
- 28
- Citations by year
- 2026: 3 · 2025: 8 · 2024: 3 · 2023: 1
- FWCI
- 1.79
- Type
- journal article
- Language
- en
- Open access
- gold
- doi.org
- Licence
- Locations
- Heliyon (publishedVersion, cc-by-nc-nd)
- PubMed Central (publishedVersion, cc-by-nc-nd)
- PubMed (publishedVersion)
- DOAJ (DOAJ: Directory of Open Access Journals) (submittedVersion, cc-by-sa)
- Funders
- National Natural Science Foundation of China (81770512, SZSM201812055)
- Topics
- Health Sciences › Medicine › Hepatology › Hepatocellular Carcinoma Treatment and Prognosis
- Life Sciences › Biochemistry, Genetics and Molecular Biology › Cell Biology › Hippo pathway signaling and YAP/TAZ
- Health Sciences › Medicine › Oncology › Cancer Cells and Metastasis
- Keywords
- Piezo1, hepatoblastoma, metastasis, HIF-1α, vascular endothelial growth factor, mechanotransduction, cell migration and invasion, cell proliferation, prognostic factors
About these checks
Registry, retraction, Cites and statistics results are computed, not judged, with one exception: a printed reference that no index lists is read once by a model before it counts as a citation error. Claims are extracted by a model and kept only when their quote appears verbatim in the text; each cited source is then checked, with a model’s help, for whether it says what the claim relies on. Those verdicts can be wrong — read the claim’s quote and the cited source before relying on one.
Statistics and arithmetic are recomputed, not judged.
Confidence bands are shown only for fields calibrated on our annotated test set. None is calibrated yet, so no band is shown.
What counts as a claim ›How we measure confidence ›How we check this ›
Are you an author, or do you see a problem with this page? Request a review
Data sources
Bibliographic data: Semantic Scholar, OpenAlex, Crossref.
Contains information from the Semantic Scholar Academic Graph Datasets, made available under the ODC Attribution License (ODC-BY 1.0).
Semantic Scholar’s data is described in: Kinney, R., et al. (2023). The Semantic Scholar Open Data Platform. arXiv:2301.10140.
