Cited by 20Bacterial Genetics and BiotechnologyGenomics and Chromatin DynamicsDiffusion and Search Dynamics

The DOI matches its Crossref record; 2 of the 2 references it cites were found in a registry or an index.

Bacterial H-NS contacts DNA at the same irregularly spaced sites in both bridged and hemi-sequestered linear filaments

Open access

Published version of a preprint

Abstract

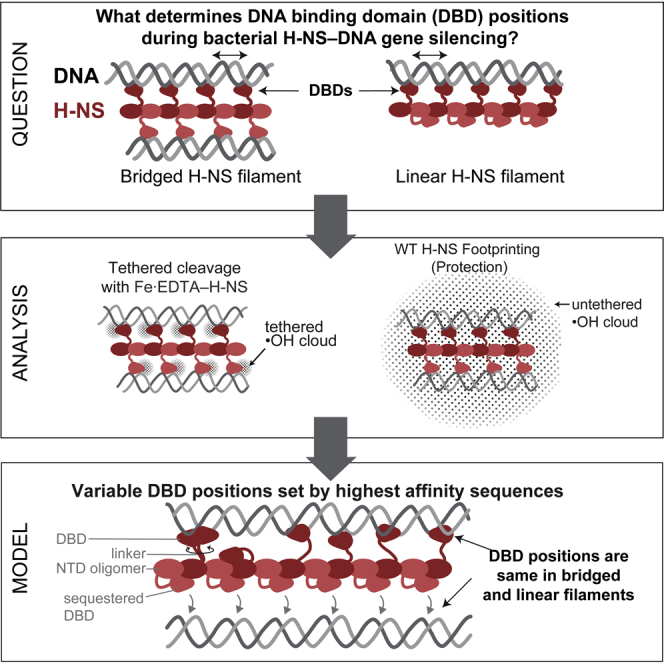
Gene silencing in bacteria is mediated by chromatin proteins, of which Escherichia coli H-NS is a paradigmatic example. H-NS forms nucleoprotein filaments with either one or two DNA duplexes. However, the structures, arrangements of DNA-binding domains (DBDs), and positions of DBD–DNA contacts in linear and bridged filaments are uncertain. To characterize the H-NS DBD contacts that silence transcription by RNA polymerase, we combined ·OH footprinting, molecular dynamics, statistical modeling, and DBD mapping using a chemical nuclease (Fe 2+ -EDTA) tethered to the DBDs (TEN-map). We find that H-NS DBDs contact DNA at indistinguishable locations in bridged or linear filaments and that the DBDs vary in orientation and position with ∼10-bp average spacing. Our results support a hemi-sequestration model of linear-to-bridged H-NS switching. Linear filaments able to inhibit only transcription initiation switch to bridged filaments able to inhibit both initiation and elongation using the same irregularly spaced DNA contacts.

Overview

The claims and statistics of this paper haven’t been checked yet.

Run the check — free, no account needed. It reads the open-access text and checks the sources it cites.

A few free checks a day · papers already verified open instantly · results are public

Integrity signals

Registry

Crossref · 10.1016/j.isci.2022.104429

Cites

2 of 2 references verified0 citation errors · 0 not checkable

Statistics

Figures

Graphical abstract
Graphical abstract CC BY-NC-ND · PubMed Central
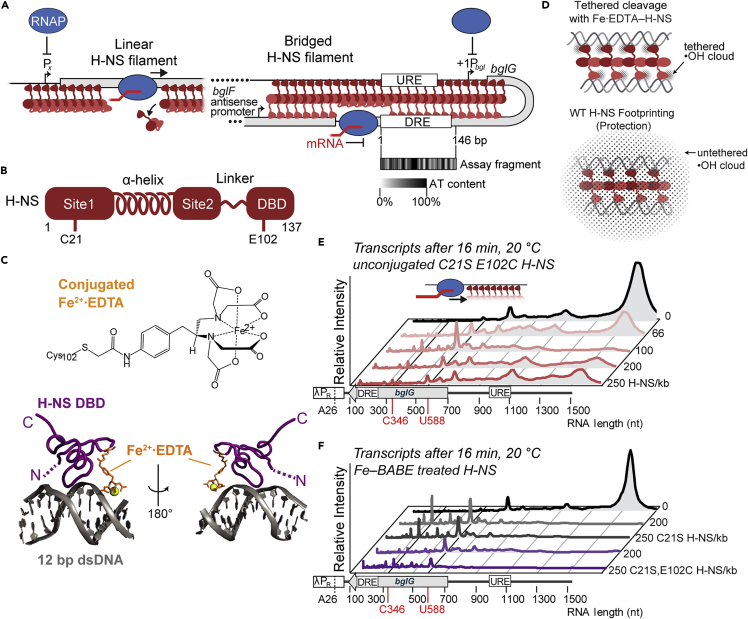
Figure 1 H-NS tethered to Fe2+·EDTA forms bridged filaments that stimulate pausing by RNA polymerase (A) Mechanisms of gene silencing by H-NS illustrated for the E. coli bgl operon. Linear and bridged H-NS filaments (dark and light red monomers) can block RNAP (blue) from binding to promoters whereas only bridged H-NS can inhibit elongation of RNAP by stimulating pausing (Dame et al., 2002; Kotlajich et al., 2015; Shin et al., 2005; Singh and Grainger, 2013). AT-rich, high-affinity-binding sites nucleate filament formation at the bgl upstream and downstream regulatory elements (URE and DRE) (Dole et al., 2004). The AT-content of the 146-bp DRE DNA fragment used in the TEN-map assay is shown using a gray-scale heat map. (B) Structure of the H-NS monomer. Sites 1 and 2 in the N-terminal oligomerization domain, connected by a flexible α-helix, make head-head, tail-tail contacts in H-NS-DNA filaments (Shahul Hameed et al., 2018; van der Valk et al., 2017). A 15-aa flexible linker connects the C-terminal DBDs to the tail-tail junction (Gao et al., 2017). Substitutions (C21S, E102C) enabling Fe2+·EDTA conjugation are indicated. (C) Model of the H-NS DBD (PDB 2L93) bound to 12-bp duplex DNA (Riccardi et al., 2019) with Fe2+·EDTA tethered to position 102. (D) Comparison of ·OH generated in TEN-map (top) vs. ·OH footprinting (bottom) assays. (E) Pseudo-densitometry traces of RNA transcripts formed by RNAP at 20°C and 30 μM NTP on a 1.5 kb bgl DNA 16 min after release from a λPR promoter–A26 halt site with no H-NS (top) or 66–250 C21S, E102C H-NS monomer/kb DNA. Peaks represent paused RNAP (e.g., at positions 346 and 588) or run-off transcript (1538 nt) (Kotlajich et al., 2015). At ∼50 to ∼150 monomer/kb, H-NS forms bridged filaments that stimulate pausing whereas higher concentrations of H-NS saturate DBD binding sites in linear filaments (Boudreau et al., 2018; Kotlajich et al., 2015). Bridged and linear filament formation was verified by EMSA (Figure S2). See also Figure S1 for transcription results using wild-type H-NS and Figure S3 for sequence of bgl DRE. (F) RNA transcripts formed in the same assay as (E) but using control C21S H-NS and C21S, E102C H-NS treated with FeBABE. Fe2+·EDTA-H-NS formed by C21S, E102C H-NS-contained Fe2+·EDTA conjugated to ∼50% of the E102C thiols (see STAR Methods).
Figure 1 H-NS tethered to Fe2+·EDTA forms bridged filaments that stimulate pausing by RNA polymerase (A) Mechanisms of gene silencing by H-NS illustrated for the E. coli bgl operon. Linear and bridged H-NS filaments (dark and light red monomers) can block RNAP (blue) from binding to promoters whereas only bridged H-NS can inhibit elongation of RNAP by stimulating pausing (Dame et al., 2002; Kotlajich et al., 2015; Shin et al., 2005; Singh and Grainger, 2013). AT-rich, high-affinity-binding sites nucleate filament formation at the bgl upstream and downstream regulatory elements (URE and DRE) (Dole et al., 2004). The AT-content of the 146-bp DRE DNA fragment used in the TEN-map assay is shown using a gray-scale heat map. (B) Structure of the H-NS monomer. Sites 1 and 2 in the N-terminal oligomerization domain, connected by a flexible α-helix, make head-head, tail-tail contacts in H-NS-DNA filaments (Shahul Hameed et al., 2018; van der Valk et al., 2017). A 15-aa flexible linker connects the C-terminal DBDs to the tail-tail junction (Gao et al., 2017). Substitutions (C21S, E102C) enabling Fe2+·EDTA conjugation are indicated. (C) Model of the H-NS DBD (PDB 2L93) bound to 12-bp duplex DNA (Riccardi et al., 2019) with Fe2+·EDTA tethered to position 102. (D) Comparison of ·OH generated in TEN-map (top) vs. ·OH footprinting (bottom) assays. (E) Pseudo-densitometry traces of RNA transcripts formed by RNAP at 20°C and 30 μM NTP on a 1.5 kb bgl DNA 16 min after release from a λPR promoter–A26 halt site with no H-NS (top) or 66–250 C21S, E102C H-NS monomer/kb DNA. Peaks represent paused RNAP (e.g., at positions 346 and 588) or run-off transcript (1538 nt) (Kotlajich et al., 2015). At ∼50 to ∼150 monomer/kb, H-NS forms bridged filaments that stimulate pausing whereas higher concentrations of H-NS saturate DBD binding sites in linear filaments (Boudreau et al., 2018; Kotlajich et al., 2015). Bridged and linear filament formation was verified by EMSA (Figure S2). See also Figure S1 for transcription results using wild-type H-NS and Figure S3 for sequence of bgl DRE. (F) RNA transcripts formed in the same assay as (E) but using control C21S H-NS and C21S, E102C H-NS treated with FeBABE. Fe2+·EDTA-H-NS formed by C21S, E102C H-NS-contained Fe2+·EDTA conjugated to ∼50% of the E102C thiols (see STAR Methods).CC BY-NC-ND · PubMed Central
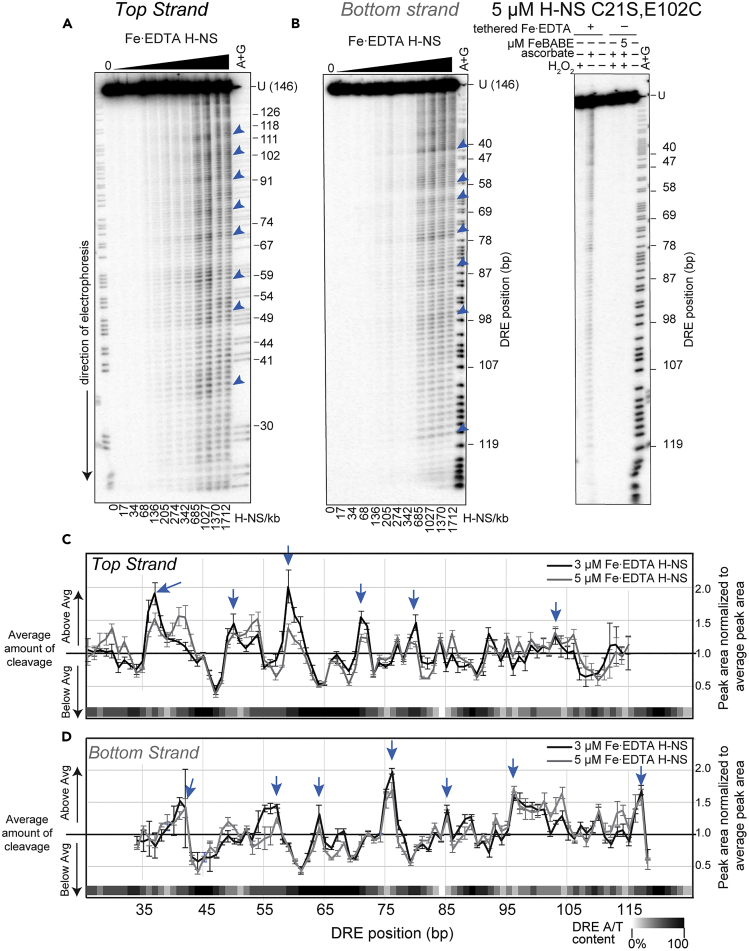
Figure 2 TEN-map locates H-NS DBDs at irregularly spaced sites in the bgl DRE (A) Denaturing 7% PAG showing Fe2+·EDTA-H-NS cleavage pattern of the 146-bp DRE DNA labeled on the top strand. Increasing concentrations of Fe2+·EDTA-H-NS (50 nM to 5 μM or 17–1712 H-NS/kb) were added to ∼20 nM DNA to form filaments. Cleavage was initiated with addition of H2O2 and ascorbic acid to 2 mM each. Sites of intense cleavage are indicated with blue arrows. A + G, Maxam–Gilbert cleavages after A and G. (B) (Left) Same as (A), but for the bottom strand. (Right) Control reactions on bottom strand electrophoresed next to cleaved DNA. Little to no cleavage was observed unless all components of the TEN-map assay were present. (C and D) Peak areas calculated by densitometric semi-automated footprinting analysis (SAFA (Das et al., 2005)) and normalized to average signal in each lane for the top (C) and bottom (D) strands (see STAR Methods), shown here for the 3 and 5 μM Fe2+·EDTA-H-NS samples. Peak areas above 1 indicate cleavage hot spots (arrows). Data are represented as the mean and standard deviation of at least three replicates. The AT content of the DRE fragment (5-bp windows) is indicated by the white-black gradient along the X axis. See Figure S4 for additional TEN-map controls.
Figure 2 TEN-map locates H-NS DBDs at irregularly spaced sites in the bgl DRE (A) Denaturing 7% PAG showing Fe2+·EDTA-H-NS cleavage pattern of the 146-bp DRE DNA labeled on the top strand. Increasing concentrations of Fe2+·EDTA-H-NS (50 nM to 5 μM or 17–1712 H-NS/kb) were added to ∼20 nM DNA to form filaments. Cleavage was initiated with addition of H2O2 and ascorbic acid to 2 mM each. Sites of intense cleavage are indicated with blue arrows. A + G, Maxam–Gilbert cleavages after A and G. (B) (Left) Same as (A), but for the bottom strand. (Right) Control reactions on bottom strand electrophoresed next to cleaved DNA. Little to no cleavage was observed unless all components of the TEN-map assay were present. (C and D) Peak areas calculated by densitometric semi-automated footprinting analysis (SAFA (Das et al., 2005)) and normalized to average signal in each lane for the top (C) and bottom (D) strands (see STAR Methods), shown here for the 3 and 5 μM Fe2+·EDTA-H-NS samples. Peak areas above 1 indicate cleavage hot spots (arrows). Data are represented as the mean and standard deviation of at least three replicates. The AT content of the DRE fragment (5-bp windows) is indicated by the white-black gradient along the X axis. See Figure S4 for additional TEN-map controls.CC BY-NC-ND · PubMed Central
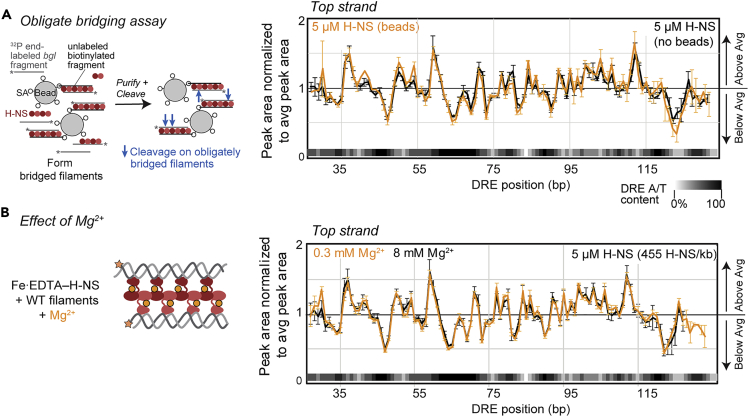
Figure 3 TEN-map reports DBD positions in obligately bridged H-NS filaments (A) TEN-map cleavage of DRE DNA is unaffected by obligate bridging. Bridged filaments were formed by mixing unlabeled 685-bp DNA fragment bound to paramagnetic beads, 549-bp DRE-containing DNA labeled on the top strand, and H-NS (60% wild-type H-NS + 40% Fe2+·EDTA-H-NS) at the indicated concentrations. Obligately bridged filaments were recovered by magnetic separation and resuspended in solution containing H2O2 to initiate cleavage of DNA (see also Figure S5 and STAR Methods). TEN-map cleavage of the top strand of the DRE region by 5 μM total H-NS (orange) is shown normalized to average peak area in each condition (see STAR Methods). The cleavage pattern is identical to that of the same DNA not tethered to beads (black). (B) TEN-map cleavage of DRE DNA is unaffected by Mg2+ concentration. TEN-map cleavage of DRE top strand by Fe2+·EDTA-H-NS at 5 μM total H-NS (455 H-NS/kb) in the presence of 8 mM (black) or 0.3 mM (orange) Mg2+ and analyzed as described for (A). Data are represented as the mean and standard deviation of at least three replicates. See also Figures S6–S8.
Figure 3 TEN-map reports DBD positions in obligately bridged H-NS filaments (A) TEN-map cleavage of DRE DNA is unaffected by obligate bridging. Bridged filaments were formed by mixing unlabeled 685-bp DNA fragment bound to paramagnetic beads, 549-bp DRE-containing DNA labeled on the top strand, and H-NS (60% wild-type H-NS + 40% Fe2+·EDTA-H-NS) at the indicated concentrations. Obligately bridged filaments were recovered by magnetic separation and resuspended in solution containing H2O2 to initiate cleavage of DNA (see also Figure S5 and STAR Methods). TEN-map cleavage of the top strand of the DRE region by 5 μM total H-NS (orange) is shown normalized to average peak area in each condition (see STAR Methods). The cleavage pattern is identical to that of the same DNA not tethered to beads (black). (B) TEN-map cleavage of DRE DNA is unaffected by Mg2+ concentration. TEN-map cleavage of DRE top strand by Fe2+·EDTA-H-NS at 5 μM total H-NS (455 H-NS/kb) in the presence of 8 mM (black) or 0.3 mM (orange) Mg2+ and analyzed as described for (A). Data are represented as the mean and standard deviation of at least three replicates. See also Figures S6–S8.CC BY-NC-ND · PubMed Central
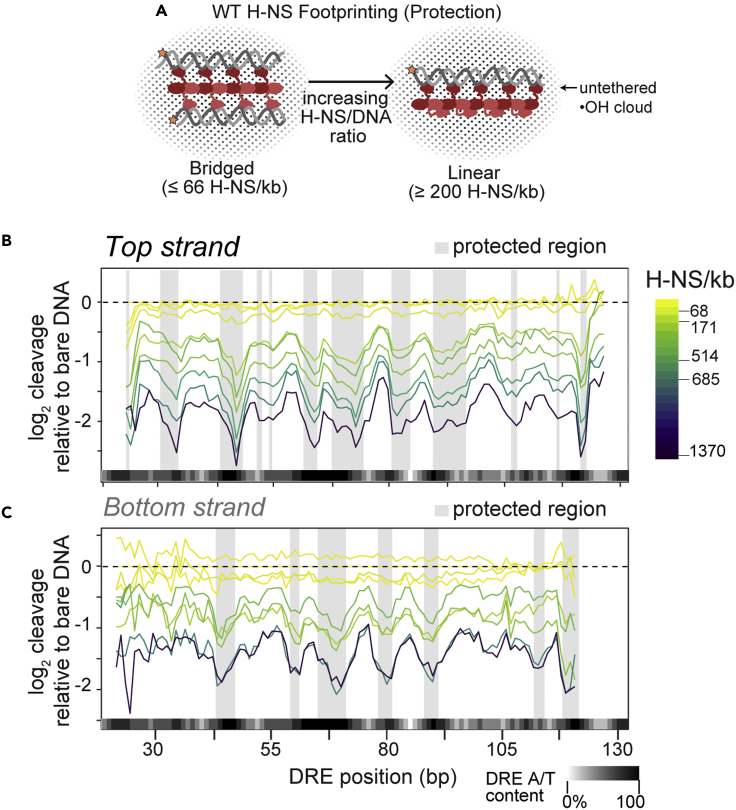
Figure 4 H-NS ·OH footprinting reveals identical protection of the DRE DNA in bridged and linear filaments (A) Schematic showing footprinting bridged and linear H-NS filaments generated by increasing H-NS/DNA ratio using ·OH generated in solution (black dots) (see also Figure 1D). WT H-NS switches from bridged to linear filament conformation when H-NS/kb DNA ≥ ∼200 (Kotlajich et al., 2015) (see Figure S2). (B) Protection patterns on DRE (top strand) at increasing H-NS concentrations (17, 34, 68, 171, 251, 342, 514, 685, and 1370 H-NS/kb DNA) are plotted as log2 ratios relative to intrinsic cleavage of unbound DNA. Strongly protected regions are highlighted by shaded boxes (see also Figure S12). (C) Same as B, but for the bottom strand. In (B and C), lines represent the median of 4 experiments, but error bars are removed for clarity.
Figure 4 H-NS ·OH footprinting reveals identical protection of the DRE DNA in bridged and linear filaments (A) Schematic showing footprinting bridged and linear H-NS filaments generated by increasing H-NS/DNA ratio using ·OH generated in solution (black dots) (see also Figure 1D). WT H-NS switches from bridged to linear filament conformation when H-NS/kb DNA ≥ ∼200 (Kotlajich et al., 2015) (see Figure S2). (B) Protection patterns on DRE (top strand) at increasing H-NS concentrations (17, 34, 68, 171, 251, 342, 514, 685, and 1370 H-NS/kb DNA) are plotted as log2 ratios relative to intrinsic cleavage of unbound DNA. Strongly protected regions are highlighted by shaded boxes (see also Figure S12). (C) Same as B, but for the bottom strand. In (B and C), lines represent the median of 4 experiments, but error bars are removed for clarity.CC BY-NC-ND · PubMed Central
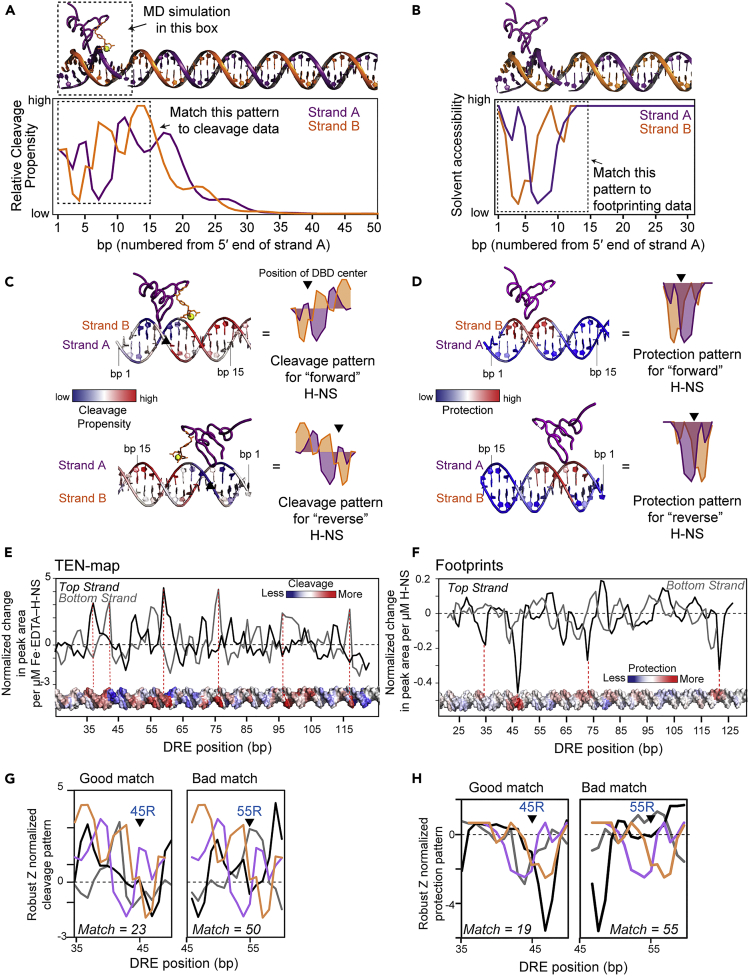
Figure 5 Comparison of predictions from molecular modeling to TEN-map and ·OH footprinting data to place H-NS DBDs on the DRE DNA (A) MD simulation of Fe2+·EDTA (orange) conjugated to the H-NS DBD (purple) bound to a 12-bp DNA duplex (strand A, purple; strand B, orange). The distance between the Fe2+ and each bp during the simulation was used to estimate the relative cleavage propensity at each position. Additional DNA (bp 13–50) was included after the MD simulations to estimate cleavage propensities at bp further from the binding site. The cleavage propensity pattern in the dashed box was used in the comparison to experimental TEN-map data. See Figure S10 for detailed results from the MD simulations used to calculate distances. (B) Solvent accessibility of DNA bound by one H-NS DBD calculated from the structure shown at the top of the panel. A 15-bp portion (dashed box) of this pattern was compared to the experimentally determined ·OH footprinting pattern. (C) Overlay of the TEN-map cleavage propensity on B-form DNA with H-NS bound in a forward orientation (PDB 2L93) (Gordon et al., 2011). Cleavage propensity is on a blue-white-red spectrum where blue is low cleavage propensity and red is high cleavage propensity. Cleavage pattern of H-NS bound in the reverse orientation is shown below. The black triangle indicates the center of the H-NS binding site used to align predictions and the cleavage data (see G). (D) Same as (C), but displaying the predicted solvent accessibility, or protection, of B-form DNA bound by a single H-NS DBD. Bases more or less protected by H-NS are shown in red or blue, respectively. Slight asymmetry in the protection pattern distinguishes the forward (top) or reverse (bottom) binding directions. (E) Change in TEN-map signal as a function of H-NS concentration (see STAR Methods and Figure S11). More positive slope corresponds to greater H-NS-dependent cleavage. Error in the calculated slopes is in Figure S11. The slope changes are displayed on B-form DNA with red and blue corresponding to greater or lesser extents of cleavage. (F) Change in ·OH footprint signal as a function of H-NS concentration (see STAR Methods and Figure S12). More negative slope corresponds to greater H-NS-dependent protection. Error in the calculated slopes is shown in Figure S12. The slope changes are displayed on B-form DNA with red and blue corresponding to greater or lesser protection. (G) Examples of alignment of the predicted reverse TEN-map cleavage pattern (C) with the TEN-map slope values (E) at positions 45 (good match score, 23) or 55 (poor match score, 50). Predicted strand-A cleavage (purple) should match the top strand cleavage pattern (black); predicted strand-B cleavage (orange) should match the bottom strand cleavage pattern (gray). Match scores for the entire DRE fragment are shown in Figure S13. (H) Same as for (G) but showing alignment of the predicted protection pattern (D) with ·OH footprint slopes (F).
Figure 5 Comparison of predictions from molecular modeling to TEN-map and ·OH footprinting data to place H-NS DBDs on the DRE DNA (A) MD simulation of Fe2+·EDTA (orange) conjugated to the H-NS DBD (purple) bound to a 12-bp DNA duplex (strand A, purple; strand B, orange). The distance between the Fe2+ and each bp during the simulation was used to estimate the relative cleavage propensity at each position. Additional DNA (bp 13–50) was included after the MD simulations to estimate cleavage propensities at bp further from the binding site. The cleavage propensity pattern in the dashed box was used in the comparison to experimental TEN-map data. See Figure S10 for detailed results from the MD simulations used to calculate distances. (B) Solvent accessibility of DNA bound by one H-NS DBD calculated from the structure shown at the top of the panel. A 15-bp portion (dashed box) of this pattern was compared to the experimentally determined ·OH footprinting pattern. (C) Overlay of the TEN-map cleavage propensity on B-form DNA with H-NS bound in a forward orientation (PDB 2L93) (Gordon et al., 2011). Cleavage propensity is on a blue-white-red spectrum where blue is low cleavage propensity and red is high cleavage propensity. Cleavage pattern of H-NS bound in the reverse orientation is shown below. The black triangle indicates the center of the H-NS binding site used to align predictions and the cleavage data (see G). (D) Same as (C), but displaying the predicted solvent accessibility, or protection, of B-form DNA bound by a single H-NS DBD. Bases more or less protected by H-NS are shown in red or blue, respectively. Slight asymmetry in the protection pattern distinguishes the forward (top) or reverse (bottom) binding directions. (E) Change in TEN-map signal as a function of H-NS concentration (see STAR Methods and Figure S11). More positive slope corresponds to greater H-NS-dependent cleavage. Error in the calculated slopes is in Figure S11. The slope changes are displayed on B-form DNA with red and blue corresponding to greater or lesser extents of cleavage. (F) Change in ·OH footprint signal as a function of H-NS concentration (see STAR Methods and Figure S12). More negative slope corresponds to greater H-NS-dependent protection. Error in the calculated slopes is shown in Figure S12. The slope changes are displayed on B-form DNA with red and blue corresponding to greater or lesser protection. (G) Examples of alignment of the predicted reverse TEN-map cleavage pattern (C) with the TEN-map slope values (E) at positions 45 (good match score, 23) or 55 (poor match score, 50). Predicted strand-A cleavage (purple) should match the top strand cleavage pattern (black); predicted strand-B cleavage (orange) should match the bottom strand cleavage pattern (gray). Match scores for the entire DRE fragment are shown in Figure S13. (H) Same as for (G) but showing alignment of the predicted protection pattern (D) with ·OH footprint slopes (F).CC BY-NC-ND · PubMed Central
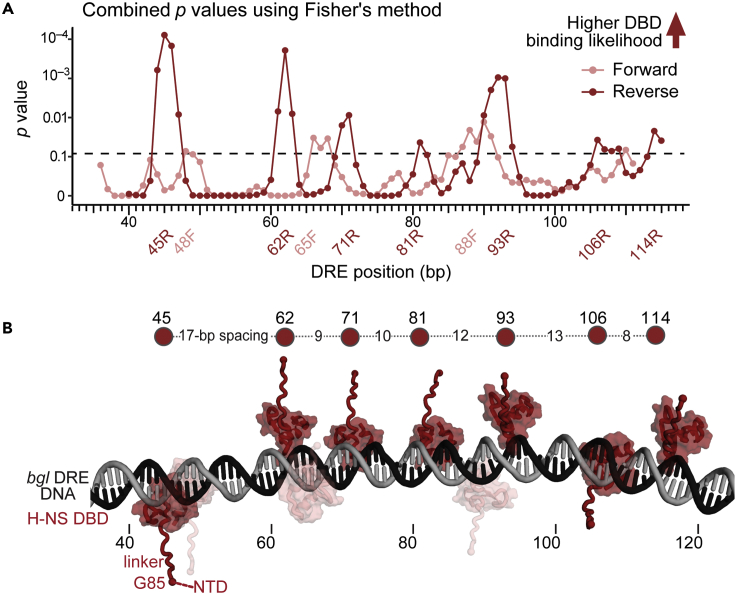
Figure 6 Agreement of MD simulations with TEN-map and footprinting data reveals irregularly spaced binding of H-NS DBDs to the bgl DRE (A) Localization and orientation of the H-NS DBD domain on the DRE DNA were determined by combining evidence for congruency between the MD simulations and the TEN-map data with evidence for congruency between the MD simulations and the footprinting data (see Figure S13; dashed line, p = 0.05 Fisher’s combined probability test). Evidence is shown as a combined p value at each base pair in the DRE DNA in the forward (light red) or reverse (dark red) orientations (see STAR Methods for details). (B) Molecular model of H-NS DBD locations in an H-NS bridged or linear filament on the bgl DRE. The DNA model was generated using Nucgen-plus (Bansal et al., 1995). H-NS DBDs were centered at the positions of greatest probability (A) in forward (light red) or reverse (dark red) orientations. The reverse orientations are most probable (see text). H-NS DBD model is from PDB 2L93 (Gordon et al., 2011), and the flexible linker was modeled using AlphaFold2 (Jumper et al., 2021). The spacing between DBDs in the reverse orientation is indicated on the line above the model. The H-NS NTD is not included in the model but would be attached to the DBDs via the flexible linkers.
Figure 6 Agreement of MD simulations with TEN-map and footprinting data reveals irregularly spaced binding of H-NS DBDs to the bgl DRE (A) Localization and orientation of the H-NS DBD domain on the DRE DNA were determined by combining evidence for congruency between the MD simulations and the TEN-map data with evidence for congruency between the MD simulations and the footprinting data (see Figure S13; dashed line, p = 0.05 Fisher’s combined probability test). Evidence is shown as a combined p value at each base pair in the DRE DNA in the forward (light red) or reverse (dark red) orientations (see STAR Methods for details). (B) Molecular model of H-NS DBD locations in an H-NS bridged or linear filament on the bgl DRE. The DNA model was generated using Nucgen-plus (Bansal et al., 1995). H-NS DBDs were centered at the positions of greatest probability (A) in forward (light red) or reverse (dark red) orientations. The reverse orientations are most probable (see text). H-NS DBD model is from PDB 2L93 (Gordon et al., 2011), and the flexible linker was modeled using AlphaFold2 (Jumper et al., 2021). The spacing between DBDs in the reverse orientation is indicated on the line above the model. The H-NS NTD is not included in the model but would be attached to the DBDs via the flexible linkers.CC BY-NC-ND · PubMed Central
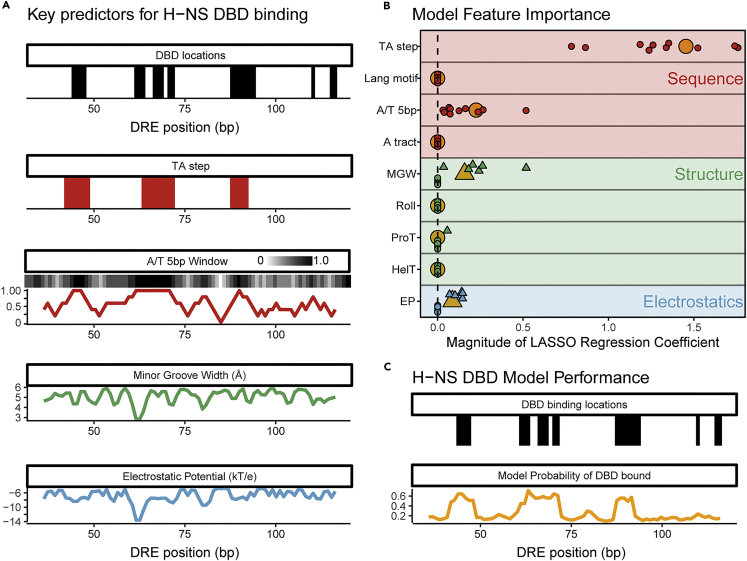
Figure 7 TA steps, A/T content, minor groove width, and electrostatic potential best predict DBD locations (A) Relationship between possible H-NS DBD binding locations and the sequence, structural, and electrostatic features of bgl DRE DNA. Base pairs with high agreement between the TEN-map and predicted patterns for footprinting and MD simulation in either DBD orientation are represented as black bars (p ≤ 0.05; Monte Carlo permutation test; see STAR Methods and Figures 5C and 5D and S12). TA-steps are represented as a red bar for every bp within a TA-step 4mer. A/T content averaged over a 5-bp window is shown as a white–black gradient and in the plot (red). Minor groove width (green) and electrostatic potential (blue) of the DRE DNA were calculated using DNAshapeR (Chiu et al., 2016). (B) Relative importance of sequence, structure, and electrostatic features in predicting H-NS DBD binding locations. The (+) or (−) valued regression coefficients from a LASSO logistic regression model fitted to the DBD binding locations (Friedman et al., 2010) are represented as circles or triangles, respectively. Points correspond to coefficients from ten models fit independently by partitioning the data into ten subsets using stratified sampling and then fitting each model to a unique set of nine subsets. Large orange symbols indicate the coefficients for a model fit to the entire dataset. (C) Predictive performance of sequence and structure-based regression model using TA step, A/T content, minor groove width, and electrostatic potential parameters (B). H-NS DBD binding locations (same as in A) are shown in black. The probability of DBD binding based on a LASSO regression model fit to the full dataset is shown in orange.
Figure 7 TA steps, A/T content, minor groove width, and electrostatic potential best predict DBD locations (A) Relationship between possible H-NS DBD binding locations and the sequence, structural, and electrostatic features of bgl DRE DNA. Base pairs with high agreement between the TEN-map and predicted patterns for footprinting and MD simulation in either DBD orientation are represented as black bars (p ≤ 0.05; Monte Carlo permutation test; see STAR Methods and Figures 5C and 5D and S12). TA-steps are represented as a red bar for every bp within a TA-step 4mer. A/T content averaged over a 5-bp window is shown as a white–black gradient and in the plot (red). Minor groove width (green) and electrostatic potential (blue) of the DRE DNA were calculated using DNAshapeR (Chiu et al., 2016). (B) Relative importance of sequence, structure, and electrostatic features in predicting H-NS DBD binding locations. The (+) or (−) valued regression coefficients from a LASSO logistic regression model fitted to the DBD binding locations (Friedman et al., 2010) are represented as circles or triangles, respectively. Points correspond to coefficients from ten models fit independently by partitioning the data into ten subsets using stratified sampling and then fitting each model to a unique set of nine subsets. Large orange symbols indicate the coefficients for a model fit to the entire dataset. (C) Predictive performance of sequence and structure-based regression model using TA step, A/T content, minor groove width, and electrostatic potential parameters (B). H-NS DBD binding locations (same as in A) are shown in black. The probability of DBD binding based on a LASSO regression model fit to the full dataset is shown in orange.CC BY-NC-ND · PubMed Central
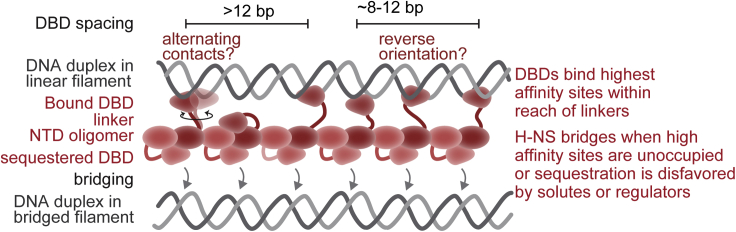
Figure 8 Hemi-sequestration model of H-NS DBD interactions with DNA in bridged and linear nucleoprotein filaments In conditions favoring linear filaments, one set of DBDs is sequestered via interaction with the NTD (Shahul Hameed et al., 2018; van der Valk et al., 2017). In conditions that favor bridging, which in vivo could include altered solute composition (Qin et al., 2020), interactions of H-NS modifiers like Hha (Boudreau et al., 2018; van der Valk et al., 2017), or changes in H-NS levels (Kotlajich et al., 2015), the hemi-sequestered DBDs preferentially associate with the same set of irregularly spaced sites used in linear filaments. Variable spacing between DBDs and possible changes in DBD orientation are accommodated within the H-NS nucleoprotein filament by the flexible linkers between the DBDs and the NTD oligomer.
Figure 8 Hemi-sequestration model of H-NS DBD interactions with DNA in bridged and linear nucleoprotein filaments In conditions favoring linear filaments, one set of DBDs is sequestered via interaction with the NTD (Shahul Hameed et al., 2018; van der Valk et al., 2017). In conditions that favor bridging, which in vivo could include altered solute composition (Qin et al., 2020), interactions of H-NS modifiers like Hha (Boudreau et al., 2018; van der Valk et al., 2017), or changes in H-NS levels (Kotlajich et al., 2015), the hemi-sequestered DBDs preferentially associate with the same set of irregularly spaced sites used in linear filaments. Variable spacing between DBDs and possible changes in DBD orientation are accommodated within the H-NS nucleoprotein filament by the flexible linkers between the DBDs and the NTD oligomer.CC BY-NC-ND · PubMed Central

Verification

Claims the paper makes

The claims and statistics of this paper haven’t been checked yet.

Run the check — free, no account needed. It reads the open-access text and checks the sources it cites.

A few free checks a day · papers already verified open instantly · results are public

Self-check

Percentages, sums and reported differences re-computed from the paper’s own numbers.

The self-check needs the paper’s full text.

Citations

Cites

Research works printed but not linked: 77

  1. Arold, 2010, H-NS forms a superhelical protein scaffold for DNA condensation, Proc. Natl. Acad. Sci. U S A, 107, 15728, 10.1073/pnas.1006966107 · DOI
  2. Baba, 2006, Construction of Escherichia coli K-12 in-frame, single-gene knockout mutants: the Keio collection, Mol. Syst. Biol., 2, 10.1038/msb4100050 · DOI · Paper page
  3. Balasubramanian, 1998, DNA strand breaking by the hydroxyl radical is governed by the accessible surface areas of the hydrogen atoms of the DNA backbone, Proc. Natl. Acad. Sci. U S A, 95, 9738, 10.1073/pnas.95.17.9738 · DOI
  4. Bansal, 1995, NUPARM and NUCGEN: software for analysis and generation of sequence dependent nucleic acid structures, Comput. Appl. Biosci., 11, 281
  5. Best, 2012, Optimization of the additive CHARMM all-atom protein force field targeting improved sampling of the backbone φ, ψ and side-chain χ1 and χ2 dihedral angles, J. Chem. Theor. Comput., 8, 3257, 10.1021/ct300400x · DOI
  6. Blattner, 1997, The complete genome sequence of Escherichia coli K-12, Science, 277, 1453, 10.1126/science.277.5331.1453 · DOI
  7. Boudreau, 2018, StpA and Hha stimulate pausing by RNA polymerase by promoting DNA-DNA bridging of H-NS filaments, Nucleic Acids Res., 46, 5525, 10.1093/nar/gky265 · DOI
  8. Bouffartigues, 2007, H-NS cooperative binding to high-affinity sites in a regulatory element results in transcriptional silencing, Nat. Struct. Mol. Biol., 14, 441, 10.1038/nsmb1233 · DOI
  9. Brooks, 2009, CHARMM: the biomolecular simulation program, J. Comput. Chem., 30, 1545, 10.1002/jcc.21287 · DOI
  10. Burkhoff, 1988, Structural details of an adenine tract that does not cause DNA to bend, Nature, 331, 455, 10.1038/331455a0 · DOI
  11. Bürkner, 2017, Brms: an R package for bayesian multilevel models using stan, J. Stat. Softw., 80
  12. Chandraprakash, 2014, Inhibition of factor-dependent transcription termination in Escherichia coli might relieve xenogene silencing by abrogating H-NS-DNA interactions in vivo, J. Biosci., 39, 53, 10.1007/s12038-014-9413-4 · DOI
  13. Cheal, 2009, Mapping protein-protein interactions by localized oxidation: consequences of the reach of hydroxyl radical, Biochemistry, 48, 4577, 10.1021/bi900273j · DOI
  14. Chiu, 2016, DNAshapeR: an R/Bioconductor package for DNA shape prediction and feature encoding, Bioinformatics, 32, 1211, 10.1093/bioinformatics/btv735 · DOI
  15. Chiu, 2017, Genome-wide prediction of minor-groove electrostatic potential enables biophysical modeling of protein–DNA binding, Nucleic Acids Res., 45, 12565, 10.1093/nar/gkx915 · DOI
  16. Cook, 2018, Transcription-driven genome organization: a model for chromosome structure and the regulation of gene expression tested through simulations, Nucleic Acids Res., 46, 9895, 10.1093/nar/gky763 · DOI
  17. Dame, 2000, H-NS mediated compaction of DNA visualised by atomic force microscopy, Nucleic Acids Res., 28, 3504, 10.1093/nar/28.18.3504 · DOI
  18. Dame, 2002, Structural basis for H-NS-mediated trapping of RNA polymerase in the open initiation complex at the rrnB P1, J. Biol. Chem., 277, 2146, 10.1074/jbc.C100603200 · DOI
  19. Dame, 2006, Bacterial chromatin organization by H-NS protein unravelled using dual DNA manipulation, Nature, 444, 387, 10.1038/nature05283 · DOI
  20. Dame, 2020, Chromosome organization in bacteria: mechanistic insights into genome structure and function, Nat. Rev. Genet., 21, 227, 10.1038/s41576-019-0185-4 · DOI
  21. Das, 2005, SAFA: semi-automated footprinting analysis software for high-throughput quantification of nucleic acid footprinting experiments, RNA, 11, 344, 10.1261/rna.7214405 · DOI
  22. Dole, 2004, The histone-like nucleoid structuring protein H-NS represses the Escherichia coli bgl operon downstream of the promoter, Mol. Microbiol., 52, 589, 10.1111/j.1365-2958.2004.04001.x · DOI
  23. Friedman, 2010, Regularization paths for generalized linear models via coordinate descent, J. Stat. Softw., 33, 1
  24. Gao, 2017, Charged residues in the H-NS linker drive DNA binding and gene silencing in single cells, Proc. Natl. Acad. Sci. U S A, 114, 12560, 10.1073/pnas.1716721114 · DOI
  25. Gawade, 2020, Reconstruction of transcriptional regulatory networks of Fis and H-NS in Escherichia coli from genome-wide data analysis, Genomics, 112, 1264, 10.1016/j.ygeno.2019.07.013 · DOI
  26. Gordon, 2011, Structural basis for recognition of AT-rich DNA by unrelated xenogeneic silencing proteins, Proc. Natl. Acad. Sci. U S A, 108, 10690, 10.1073/pnas.1102544108 · DOI
  27. Grainger, 2016, Structure and function of bacterial H-NS protein, Biochem. Soc. Trans., 44, 1561, 10.1042/BST20160190 · DOI
  28. Grainger, 2006, Association of nucleoid proteins with coding and non-coding segments of the Escherichia coli genome, Nucleic Acids Res., 34, 4642, 10.1093/nar/gkl542 · DOI
  29. Grant, 2011, FIMO: scanning for occurrences of a given motif, Bioinformatics, 27, 1017, 10.1093/bioinformatics/btr064 · DOI · Paper page
  30. Greiner, 1997, Synthesis of the protein cutting reagent Iron (S)-1-(p-Bromoacetamidobenzyl)ethylenediaminetetraacetate and conjugation to cysteine side chains, Bioconjug. Chem., 8, 44, 10.1021/bc9600731 · DOI
  31. Gribskov, 1983, Overexpression and purification of the sigma subunit of Escherichia coli RNA polymerase, Gene, 26, 109, 10.1016/0378-1119(83)90180-4 · DOI
  32. Gulvady, 2018, A single molecule analysis of H-NS uncouples DNA binding affinity from DNA specificity, Nucleic Acids Res., 46, 10216, 10.1093/nar/gky826 · DOI
  33. Haft, 2014, Correcting direct effects of ethanol on translation and transcription machinery confers ethanol tolerance in bacteria, Proc. Natl. Acad. Sci. U S A, 111, E2576, 10.1073/pnas.1401853111 · DOI
  34. Hampel, 1974, The influence curve and its role in robust estimation, J. Am. Stat. Assoc., 69, 383, 10.1080/01621459.1974.10482962 · DOI
  35. Hart, 2012, Optimization of the CHARMM additive force field for DNA: improved treatment of the BI/BII conformational equilibrium, J. Chem. Theor. Comput., 8, 348, 10.1021/ct200723y · DOI
  36. Heard, 2018, Choosing between methods of combining $p$-values, Biometrika, 105, 239, 10.1093/biomet/asx076 · DOI
  37. Ishihama, 2021, Hierarchy of transcription factor network in Escherichia coli K-12: H-NS-mediated silencing and Anti-silencing by global regulators, FEMS Microbiol. Rev., 45, 10.1093/femsre/fuab032 · DOI
  38. Ishihama, 2016, Transcription profile of Escherichia coli: genomic SELEX search for regulatory targets of transcription factors, Nucleic Acids Res., 44, 2058, 10.1093/nar/gkw051 · DOI
  39. Kahramanoglou, 2011, Direct and indirect effects of H-NS and Fis on global gene expression control in Escherichia coli, Nucleic Acids Res., 39, 2073, 10.1093/nar/gkq934 · DOI
  40. Kotlajich, 2015, Bridged filaments of histone-like nucleoid structuring protein pause RNA polymerase and aid termination in bacteria, Elife, 4, e04970, 10.7554/eLife.04970 · DOI
  41. Lang, 2007, High-affinity DNA binding sites for H-NS provide a molecular basis for selective silencing within proteobacterial genomes, Nucleic Acids Res., 35, 6330, 10.1093/nar/gkm712 · DOI
  42. Liao, 2017, Extending the nonbonded cationic dummy model to account for ion-induced dipole interactions, J. Phys. Chem. Lett., 8, 5408, 10.1021/acs.jpclett.7b02358 · DOI
  43. Liu, 2010, A divalent switch drives H-NS/DNA-binding conformations between stiffening and bridging modes, Genes Dev., 24, 339, 10.1101/gad.1883510 · DOI
  44. Lucchini, 2006, H-NS mediates the silencing of laterally acquired genes in bacteria, PLoS Pathog., 2, e81, 10.1371/journal.ppat.0020081 · DOI
  45. Lucht, 1994, Interactions of the nucleoid-associated DNA-binding protein H-NS with the regulatory region of the osmotically controlled proU operon of Escherichia coli, J. Biol. Chem., 269, 6578, 10.1016/S0021-9258(17)37411-2 · DOI
  46. Luger, 1997, Crystal structure of the nucleosome core particle at 2.8 Å resolution, Nature, 389, 251, 10.1038/38444 · DOI · Paper page
  47. Maxam, 1977, A new method for sequencing DNA, Proc. Natl. Acad. Sci. U S A, 74, 560, 10.1073/pnas.74.2.560 · DOI
  48. Meares, 2003, Principles and methods of affinity cleavage in studying transcription, Methods Enzymol., 371, 82, 10.1016/S0076-6879(03)71006-4 · DOI
  49. Moreira, 2011, A new target for an old regulator: H-NS represses transcription of bolA morphogene by direct binding to both promoters, Biochem. Biophys. Res. Commun., 411, 50, 10.1016/j.bbrc.2011.06.084 · DOI
  50. Murakami, 1997, The two alpha subunits of Escherichia coli RNA polymerase are asymmetrically arranged and contact different halves of the DNA upstream element, Proc. Natl. Acad. Sci. U S A, 94, 1709, 10.1073/pnas.94.5.1709 · DOI
  51. Nagarajavel, 2007, Repression by binding of H-NS within the transcription unit, J. Biol. Chem., 282, 23622, 10.1074/jbc.M702753200 · DOI
  52. Navarre, 2006, Selective silencing of foreign DNA with low GC content by the H-NS protein in Salmonella, Science, 313, 236, 10.1126/science.1128794 · DOI
  53. Nayak, 2013, Cys-pair reporters detect a constrained trigger loop in a paused RNA polymerase, Mol. Cell, 50, 882, 10.1016/j.molcel.2013.05.015 · DOI
  54. Peters, 2012, Rho and NusG suppress pervasive antisense transcription in Escherichia coli, Genes Dev., 26, 2621, 10.1101/gad.196741.112 · DOI
  55. Qin, 2019, The architects of bacterial DNA bridges: a structurally and functionally conserved family of proteins, Open Biol., 9, 190223, 10.1098/rsob.190223 · DOI
  56. Qin, 2020, Structural basis for osmotic regulation of the DNA binding properties of H-NS proteins, Nucleic Acids Res., 48, 2156, 10.1093/nar/gkz1226 · DOI
  57. Rana, 1991, Transfer of oxygen from an artificial protease to peptide carbon during proteolysis, Proc. Natl. Acad. Sci. U S A, 88, 10578, 10.1073/pnas.88.23.10578 · DOI
  58. Riccardi, 2019, Predicting the mechanism and rate of H-NS binding to AT-rich DNA, PLoS Comput. Biol., 15, e1006845, 10.1371/journal.pcbi.1006845 · DOI
  59. Rousseeuw, 1993, Alternatives to the median absolute deviation, J. Am. Stat. Assoc., 88, 1273, 10.1080/01621459.1993.10476408 · DOI
  60. Salscheider, 2014, Transcriptional regulation by BglJ-RcsB, a pleiotropic heteromeric activator in Escherichia coli, Nucleic Acids Res., 42, 2999, 10.1093/nar/gkt1298 · DOI
  61. Sankar, 2009, Fate of the H-NS-repressed bgl operon in evolution of Escherichia coli, PLoS Genet., 5, e1000405, 10.1371/journal.pgen.1000405 · DOI
  62. Saxena, 2011, Modulation of rho-dependent transcription termination in Escherichia coli by the H-ns family of proteins, J. Bacteriol., 193, 3832, 10.1128/JB.00220-11 · DOI
  63. Shahul Hameed, 2018, H-NS uses an autoinhibitory conformational switch for environment-controlled gene silencing, Nucleic Acids Res., 47, 2666, 10.1093/nar/gky1299 · DOI
  64. Shen, 2019, Transcription of bacterial chromatin, J. Mol. Biol., 431, 4040, 10.1016/j.jmb.2019.05.041 · DOI
  65. Shin, 2005, DNA looping-mediated repression by histone-like protein H-NS: specific requirement of Eσ70 as a cofactor for looping, Genes Dev., 19, 2388, 10.1101/gad.1316305 · DOI
  66. Singh, 2013, H-NS can facilitate specific DNA-binding by RNA polymerase in AT-rich gene regulatory regions, PLoS Genet., 9, e1003589, 10.1371/journal.pgen.1003589 · DOI
  67. Srinivasan, 2013, Genomic analysis reveals epistatic silencing of “expensive” genes in Escherichia coli K-12, Mol. Biosyst., 9, 2021, 10.1039/C3MB70035F · DOI
  68. Talbert, 2019, Old cogs, new tricks: the evolution of gene expression in a chromatin context, Nat. Rev. Genet., 20, 283, 10.1038/s41576-019-0105-7 · DOI
  69. Ulissi, 2014, Time-resolved assembly of a nucleoprotein complex between Shigella flexneri virF promoter and its transcriptional repressor H-NS, Nucleic Acids Res., 42, 13039, 10.1093/nar/gku1052 · DOI
  70. van der Valk, 2017, Mechanism of environmentally driven conformational changes that modulate H-NS DNA-bridging activity, Elife, 6, e27369, 10.7554/eLife.27369 · DOI
  71. van der Valk, 2018, Quantitative determination of DNA bridging efficiency of chromatin proteins, Methods Mol. Biol., 1837, 199, 10.1007/978-1-4939-8675-0_12 · DOI
  72. Wickham, 2019, Welcome to the tidyverse, J. Open Source Softw., 4, 1686, 10.21105/joss.01686 · DOI · Paper page
  73. Will, 2015, Evolutionary expansion of a regulatory network by counter-silencing, Nat. Commun., 5, 5270, 10.1038/ncomms6270 · DOI
  74. Will, 2018, Modulation of H-NS transcriptional silencing by magnesium, Nucleic Acids Res., 46, 5717, 10.1093/nar/gky387 · DOI
  75. Zhao, 2021, Molecular basis for environment sensing by a nucleoid-structuring bacterial protein filament, J. Phys. Chem. Lett., 12, 7878, 10.1021/acs.jpclett.1c01710 · DOI
  76. Zhao, 2021, Molecular basis for the adaptive evolution of environment-sensing by H-NS proteins, Elife, 10, e57467, 10.7554/eLife.57467 · DOI
  77. Zhou, 2013, DNAshape: a method for the high-throughput prediction of DNA structural features on a genomic scale, Nucleic Acids Res., 41, W56, 10.1093/nar/gkt437 · DOI

Metadata

Authors
Shen, B. A., Hustmyer, C. M., Roston, D., Wolfe, M. B., & Landick, R.
Affiliations
University of Wisconsin–Madison (US)
Corresponding author
Landick, Robert
Venue
iScience
Publisher
Elsevier BV
Published
2022-06
Volume
25
Issue
6
Pages
104429
ISSN
2589-0042 (ISSN-L)
OpenAlex
W4280508027
Cited by
20
References
2
Citations by year
2026: 5 · 2025: 2 · 2024: 7 · 2023: 3 · 2022: 1
FWCI
1.96
Type
journal article
Language
en
Open access
Locations
  • iScience (publishedVersion, cc-by-nc-nd)
  • bioRxiv (Cold Spring Harbor Laboratory) (acceptedVersion, cc-by-nc-nd)
  • PubMed Central (publishedVersion, cc-by-nc-nd)
  • PubMed (publishedVersion)
  • DOAJ (DOAJ: Directory of Open Access Journals) (submittedVersion)
Funders
  • National Institutes of Health
  • National Science Foundation (ACI-1548562, DGE-1747503, DGE-1256259)
  • NIGMS (GM38660)
Topics
  • Life Sciences › Biochemistry, Genetics and Molecular Biology › Genetics › Bacterial Genetics and Biotechnology
  • Life Sciences › Biochemistry, Genetics and Molecular Biology › Molecular Biology › Genomics and Chromatin Dynamics
  • Life Sciences › Biochemistry, Genetics and Molecular Biology › Molecular Biology › Diffusion and Search Dynamics
Keywords
H-NS, gene silencing, chromatin proteins, DNA-binding domain, nucleoprotein filament, DNA footprinting, transcription initiation, RNA polymerase, Escherichia coli

About these checks

Registry, retraction, Cites and statistics results are computed, not judged, with one exception: a printed reference that no index lists is read once by a model before it counts as a citation error. Claims are extracted by a model and kept only when their quote appears verbatim in the text; each cited source is then checked, with a model’s help, for whether it says what the claim relies on. Those verdicts can be wrong — read the claim’s quote and the cited source before relying on one.

Statistics and arithmetic are recomputed, not judged.

Confidence bands are shown only for fields calibrated on our annotated test set. None is calibrated yet, so no band is shown.

What counts as a claim ›How we measure confidence ›How we check this ›

Are you an author, or do you see a problem with this page? Request a review