Student or educator? Sign up with your school email and get 6 months of Pro free.
Cited by 4Research on Leishmaniasis StudiesProtein Tyrosine PhosphatasesGenomics and Chromatin Dynamics

The DOI matches its Crossref record; 88 of the 88 references it cites were found in a registry or an index.

Leishmania PNUTS discriminates between PP1 catalytic subunits through an RVxF–ΦΦ–F motif and polymorphisms in the PP1 C-tail and catalytic domain

Open access
Zhang, Yang, Sabatini, Robert·2023·Journal of Biological Chemistry

Published version of a preprint

Abstract

Phosphoprotein phosphatase 1 (PP1) associates with specific regulatory subunits to achieve, among other functions, substrate selectivity. Among the eight PP1 isotypes in Leishmania, PP1-8e associates with the regulatory protein PNUTS along with the structural factors JBP3 and Wdr82 in the PJW/PP1 complex that modulates RNA polymerase II (pol II) phosphorylation and transcription termination. Little is known regarding interactions involved in PJW/PP1 complex formation, including how PP1-8e is the selective isotype associated with PNUTS. Here, we show that PNUTS uses an established RVxF-ΦΦ-F motif to bind the PP1 catalytic domain with similar interfacial interactions as mammalian PP1-PNUTS and noncanonical motifs. These atypical interactions involve residues within the PP1-8e catalytic domain and N and C terminus for isoform-specific regulator binding. This work advances our understanding of PP1 isoform selectivity and reveals key roles of PP1 residues in regulator binding. We also explore the role of PNUTS as a scaffold protein for the complex by identifying the C-terminal region involved in binding JBP3 and Wdr82 and impact of PNUTS on the stability of complex components and function in pol II transcription in vivo. Taken together, these studies provide a potential mechanism where multiple motifs within PNUTS are used combinatorially to tune binding affinity to PP1, and the C terminus for JBP3 and Wdr82 association, in the Leishmania PJW/PP1 complex. Overall, our data provide insights in the formation of the PJW/PP1 complex involved in regulating pol II transcription in divergent protozoans where little is understood.

Overview

The claims and statistics of this paper haven’t been checked yet.

Run the check — free, no account needed. It reads the open-access text and checks the sources it cites.

A few free checks a day · papers already verified open instantly · results are public

Integrity signals

Registry

Crossref · 10.1016/j.jbc.2023.105432

Cites

88 of 88 references verified0 citation errors · 0 not checkable

Statistics

Figures

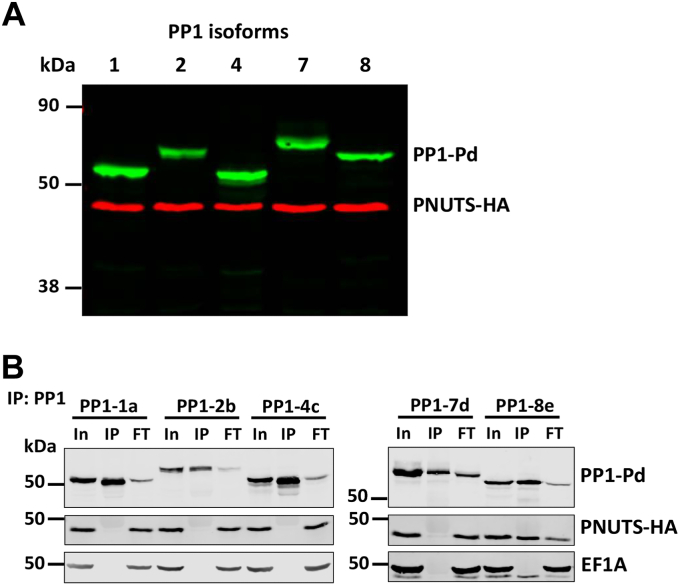
Figure 1 PNUTS binding is specific for the PP1-8e isoform.A, expression of PNUTS and PP1 isoforms in Leishmania tarentolae. Cell extracts from L. tarentolae cells that endogenously express HA-tagged PNUTS and exogenously express Pd-tagged PP1 isoforms from the pSNSAP1 vector were analyzed by Western blotting with anti-HA and anti-protein A. B, PNUTS–PP1 co-IP analysis. Lysates from the indicated cell lines were purified by anti-protein A affinity resin and analyzed by Western blotting with anti-protein A and anti-HA. Equal cell equivalents of input (In), precipitated immunocomplexes (IP), and flow-through or unbound fraction (FT) were loaded on the gel. EF1A serves as a loading and negative control for the co-IP. co-IP, coimmunoprecipitation; HA, hemagglutinin; PNUTS, PP1 nuclear targeting subunit; PP1, phosphoprotein phosphatase 1.
Figure 1 PNUTS binding is specific for the PP1-8e isoform.A, expression of PNUTS and PP1 isoforms in Leishmania tarentolae. Cell extracts from L. tarentolae cells that endogenously express HA-tagged PNUTS and exogenously express Pd-tagged PP1 isoforms from the pSNSAP1 vector were analyzed by Western blotting with anti-HA and anti-protein A. B, PNUTS–PP1 co-IP analysis. Lysates from the indicated cell lines were purified by anti-protein A affinity resin and analyzed by Western blotting with anti-protein A and anti-HA. Equal cell equivalents of input (In), precipitated immunocomplexes (IP), and flow-through or unbound fraction (FT) were loaded on the gel. EF1A serves as a loading and negative control for the co-IP. co-IP, coimmunoprecipitation; HA, hemagglutinin; PNUTS, PP1 nuclear targeting subunit; PP1, phosphoprotein phosphatase 1.CC BY · PubMed Central
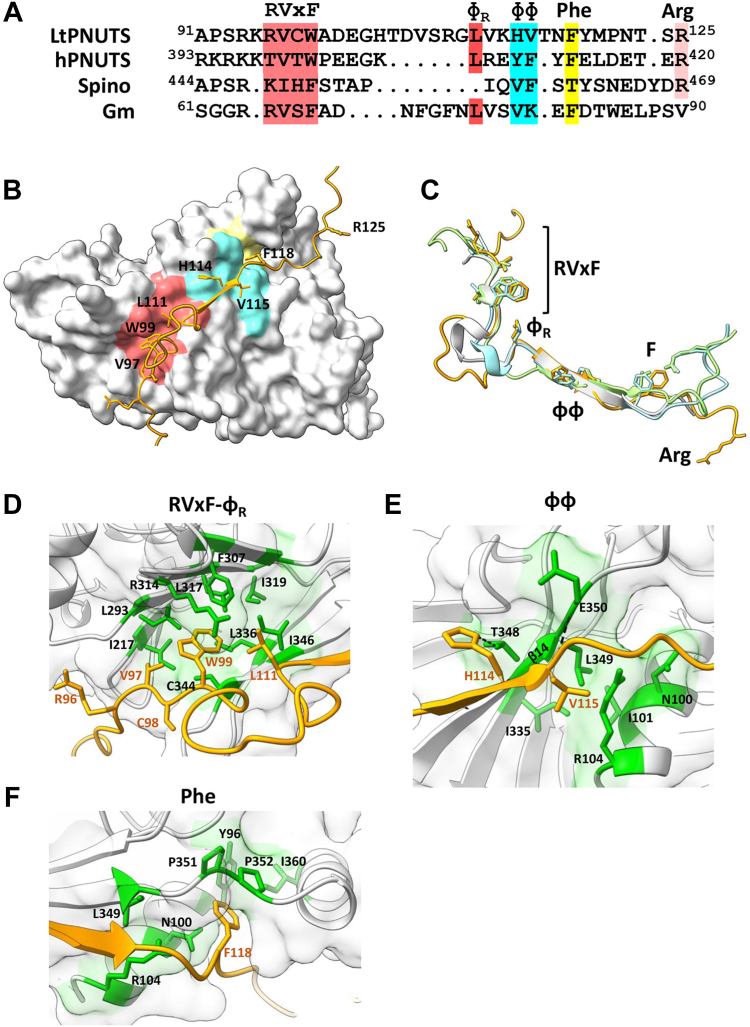
Figure 2 Predicted LtPNUTS–PP1-8e interacting motifs.A, structure-based sequence alignment of the PP1-interacting motifs of LtPNUTS, hPNUTS, spinophilin, and Gm, with PP1-interacting residues indicated. B, predicted structure of the LtPNUTS–PP1-8e complex. LtPNUTS is shown as orange ribbon with key interacting residues shown as sticks and LtPP1-8e is shown as a gray surface. LtPNUTS residues 96RVCW99 and L111 are predicted to bind to the RVxF-binding pocket (red), LtPNUTS residues 114HV115 are predicted to bind to the PP1 ΦΦ-binding pocket (cyan), and LtPNUTS residue F118 is predicted to bind to the Phe-binding pocket (yellow). The colored regions of PP1-8e correspond to the zoomed in pockets shown in D–F. C, overlay of the RVxF and ΦΦ–F structures of four PP1 regulators, LtPNUTS (orange), hPNUTS (green, 4mp0), spinophilin (blue, 3egg), and Gm (gray, 6dno), with residues binding RVxF–ΦR, ΦΦ, and Phe pockets shown as sticks. The arginine residue (R125) of LtPNUTS that deviates from the hPNUTS and spinophilin structure is indicated. D–F, major binding interactions between LtPNUTS (orange sticks) and PP1 (surface). The well-established SLiM-binding pockets (D, RVxF; E, ΦΦ; F, Phe) are shown. Key interacting residues in LtPP1-8 (black) and LtPNUTS (orange) are labeled. Predicted salt-bridge interactions between PP1 residues E350 and T348 with the PNUTS ΦΦ motif indicated by dashed line in E. Gm, muscle-specific glycogen-targeting subunit of PP1; hPNUTS, human PNUTS; LtPNUTS, Leishmania tarentolae PNUTS; PNUTS, PP1 nuclear targeting subunit; PP1, phosphoprotein phosphatase 1; SLiM, short linear motif.
Figure 2 Predicted LtPNUTS–PP1-8e interacting motifs.A, structure-based sequence alignment of the PP1-interacting motifs of LtPNUTS, hPNUTS, spinophilin, and Gm, with PP1-interacting residues indicated. B, predicted structure of the LtPNUTS–PP1-8e complex. LtPNUTS is shown as orange ribbon with key interacting residues shown as sticks and LtPP1-8e is shown as a gray surface. LtPNUTS residues 96RVCW99 and L111 are predicted to bind to the RVxF-binding pocket (red), LtPNUTS residues 114HV115 are predicted to bind to the PP1 ΦΦ-binding pocket (cyan), and LtPNUTS residue F118 is predicted to bind to the Phe-binding pocket (yellow). The colored regions of PP1-8e correspond to the zoomed in pockets shown in D–F. C, overlay of the RVxF and ΦΦ–F structures of four PP1 regulators, LtPNUTS (orange), hPNUTS (green, 4mp0), spinophilin (blue, 3egg), and Gm (gray, 6dno), with residues binding RVxF–ΦR, ΦΦ, and Phe pockets shown as sticks. The arginine residue (R125) of LtPNUTS that deviates from the hPNUTS and spinophilin structure is indicated. D–F, major binding interactions between LtPNUTS (orange sticks) and PP1 (surface). The well-established SLiM-binding pockets (D, RVxF; E, ΦΦ; F, Phe) are shown. Key interacting residues in LtPP1-8 (black) and LtPNUTS (orange) are labeled. Predicted salt-bridge interactions between PP1 residues E350 and T348 with the PNUTS ΦΦ motif indicated by dashed line in E. Gm, muscle-specific glycogen-targeting subunit of PP1; hPNUTS, human PNUTS; LtPNUTS, Leishmania tarentolae PNUTS; PNUTS, PP1 nuclear targeting subunit; PP1, phosphoprotein phosphatase 1; SLiM, short linear motif.CC BY · PubMed Central
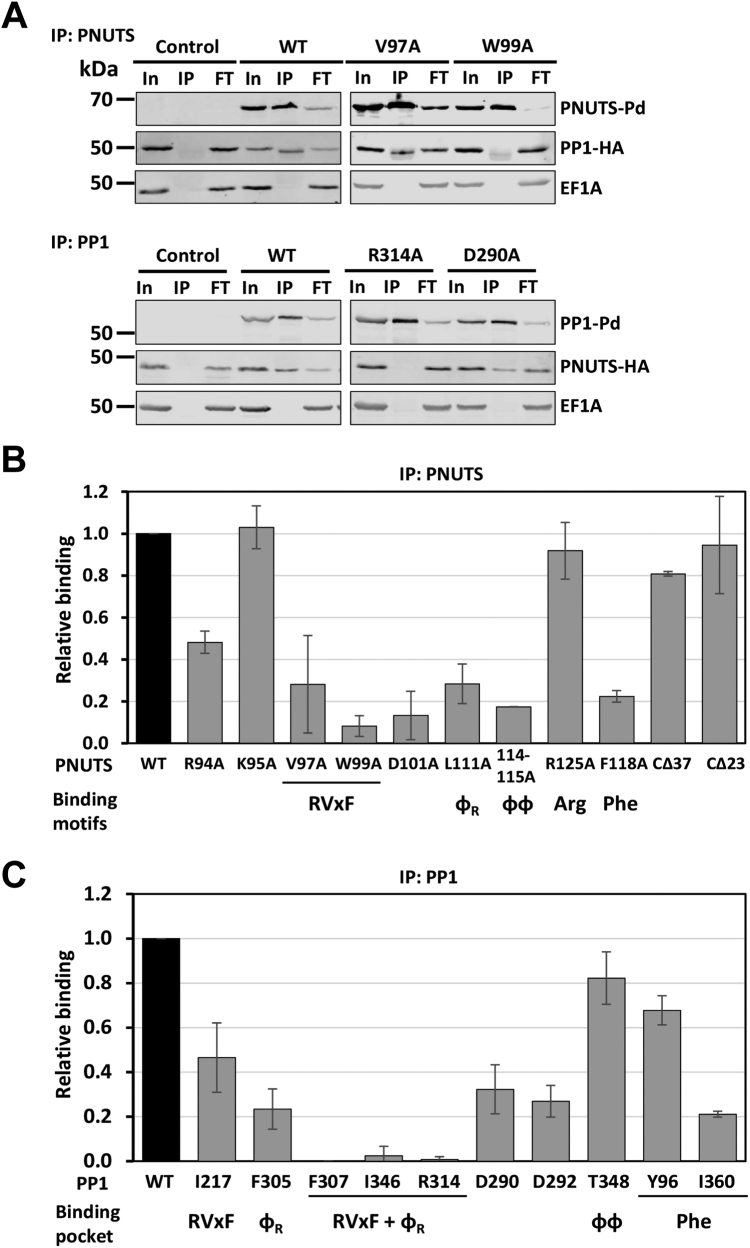
Figure 3 LtPNUTS binds LtPP1-8e using an extended RVxF–ΦR–ɸɸ–Phe motif.A, co-IP assay of PP1-8e binding to PNUTS and their derivatives. PNUTS IP; PP1-8e was endogenously tagged with HA tag, and WT or indicated PNUTS mutants with Pd tag were overexpressed from the pSNSAP1 vector. Cell extracts from the indicated cell lines were purified by anti-protein A affinity resin and analyzed by Western blot with anti-protein A and anti-HA. EF1α provides a loading control and negative control for the IP. PP1 IP; PNUTS was endogenously tagged with HA tag, and WT or indicated PP1-8e mutants with Pd tag were overexpressed from the pSNSAP1 vector. The levels of PNUTS pulled down in the PP1 IP were assessed by Western blot as described previously. Additional PNUTS and PP1-8e mutations analyzed by co-IP are shown in Fig. S6. B and C, the relative binding (%IP) between PNUTS and PP1-8e (WT and variants) determined by the ratio of the band intensity of IP to that of In. B, PNUTS-Pd IP. The bar graph represents the mean ± SD from three independent experiments, with the percent IP of PP1 using WT PNUTS set to 1. The PNUTS binding motif that corresponds to the residue tested, according to the model in Figure 2, is indicated at the bottom of the graph. CΔ23 and CΔ37 refer to C-terminal truncations of PNUTS described in Figure 4. C, PP1-8e-Pd IP. The percent IP of PNUTS from the PP1 pull-down (WT and mutants) was determined as in B. The PNUTS-binding pocket represented by each residue of PP1 is indicated below. F307, I346, and R314 are predicted to be key residues of both the RVxF and ΦR-binding pocket of PP1-8e. Co-IP, coimmunoprecipitation; FT, flow through or nonbound supernatant; HA, hemagglutinin; In, input (equivalent to the amount of protein added to the IP reaction mixture); IP, 100% of the precipitated immunocomplexes; LtPNUTS, Leishmania tarentolae PNUTS.
Figure 3 LtPNUTS binds LtPP1-8e using an extended RVxF–ΦR–ɸɸ–Phe motif.A, co-IP assay of PP1-8e binding to PNUTS and their derivatives. PNUTS IP; PP1-8e was endogenously tagged with HA tag, and WT or indicated PNUTS mutants with Pd tag were overexpressed from the pSNSAP1 vector. Cell extracts from the indicated cell lines were purified by anti-protein A affinity resin and analyzed by Western blot with anti-protein A and anti-HA. EF1α provides a loading control and negative control for the IP. PP1 IP; PNUTS was endogenously tagged with HA tag, and WT or indicated PP1-8e mutants with Pd tag were overexpressed from the pSNSAP1 vector. The levels of PNUTS pulled down in the PP1 IP were assessed by Western blot as described previously. Additional PNUTS and PP1-8e mutations analyzed by co-IP are shown in Fig. S6. B and C, the relative binding (%IP) between PNUTS and PP1-8e (WT and variants) determined by the ratio of the band intensity of IP to that of In. B, PNUTS-Pd IP. The bar graph represents the mean ± SD from three independent experiments, with the percent IP of PP1 using WT PNUTS set to 1. The PNUTS binding motif that corresponds to the residue tested, according to the model in Figure 2, is indicated at the bottom of the graph. CΔ23 and CΔ37 refer to C-terminal truncations of PNUTS described in Figure 4. C, PP1-8e-Pd IP. The percent IP of PNUTS from the PP1 pull-down (WT and mutants) was determined as in B. The PNUTS-binding pocket represented by each residue of PP1 is indicated below. F307, I346, and R314 are predicted to be key residues of both the RVxF and ΦR-binding pocket of PP1-8e. Co-IP, coimmunoprecipitation; FT, flow through or nonbound supernatant; HA, hemagglutinin; In, input (equivalent to the amount of protein added to the IP reaction mixture); IP, 100% of the precipitated immunocomplexes; LtPNUTS, Leishmania tarentolae PNUTS.CC BY · PubMed Central
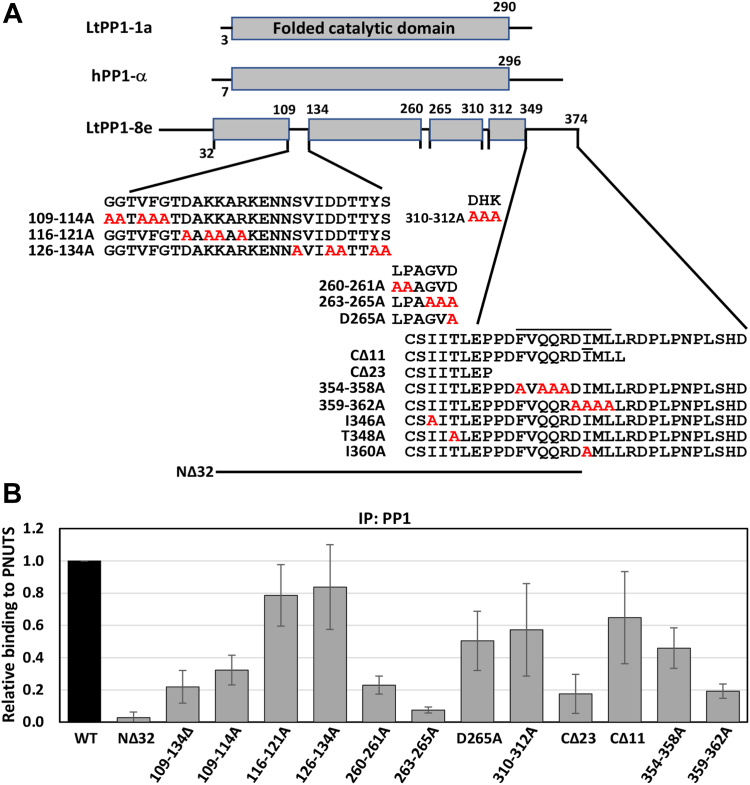
Figure 4 Noncanonical sites on PP1-8e are essential for PNUTS binding.A, PP1-8e constructs. The conserved PP1 catalytic domain is shown as gray boxes. Isoform differences between LtPP1-8e and LtPP1a and hPP1 are indicated by the lines within the catalytic domain and at the N and C terminus of LtPP1-8e. Sequence is provided for all these regions in LtPP1-8e, except the N terminus, and residues subjected to alanine mutagenesis (red) or deletion are indicated. Residues in the predicted α-helix at the C terminus are indicated by the line above the sequence. B, the percent IP of PNUTS from the PP1 pull-down (WT and indicated variants) was determined as described in C. The bar graph represents the mean ± SD from three independent experiments, with the %IP from WT PP1 set to 1. See Fig. S9. PNUTS, PP1 nuclear targeting subunit; Pol II, RNA polymerase II; PP1, phosphoprotein phosphatase 1.
Figure 4 Noncanonical sites on PP1-8e are essential for PNUTS binding.A, PP1-8e constructs. The conserved PP1 catalytic domain is shown as gray boxes. Isoform differences between LtPP1-8e and LtPP1a and hPP1 are indicated by the lines within the catalytic domain and at the N and C terminus of LtPP1-8e. Sequence is provided for all these regions in LtPP1-8e, except the N terminus, and residues subjected to alanine mutagenesis (red) or deletion are indicated. Residues in the predicted α-helix at the C terminus are indicated by the line above the sequence. B, the percent IP of PNUTS from the PP1 pull-down (WT and indicated variants) was determined as described in C. The bar graph represents the mean ± SD from three independent experiments, with the %IP from WT PP1 set to 1. See Fig. S9. PNUTS, PP1 nuclear targeting subunit; Pol II, RNA polymerase II; PP1, phosphoprotein phosphatase 1.CC BY · PubMed Central
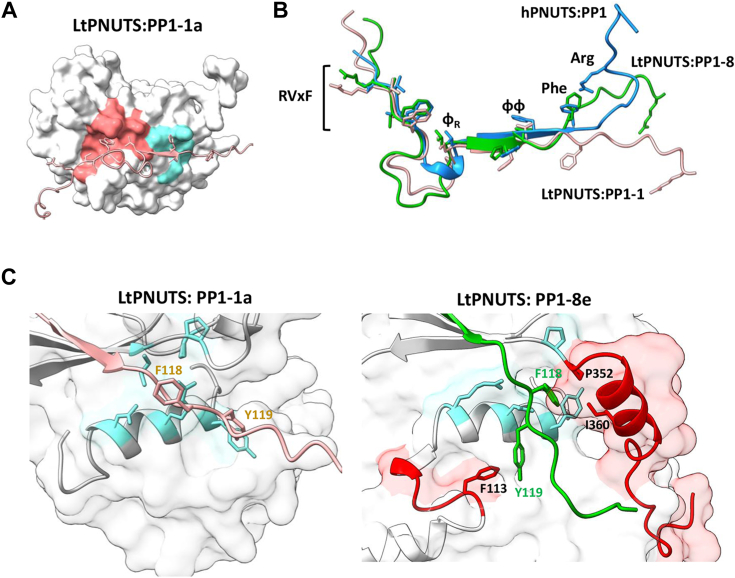
Figure 5 The predicted LtPNUTS–PP1-1a structure.A, the predicted holoenzyme structure of LtPNUTS (pink ribbon) and LtPP1-1a (white surface). The RVxF-binding pocket (red) and ΦΦ-binding pocket (cyan) are shaded on PP1 surface. B, structural comparison of the PP1-binding domains of LtPNUTS in complex with PP1-8e (green) or PP1-1a (pink). Structure of hPNUTS (blue) bound to hPP1 is also shown. C, close-up view of F118PNUTS (pink) in complex with LtPP1-1a (white surface, left) or (green) with LtPP1-8e (white surface, right). F118 and Y119 of PNUTS are shown as sticks and labeled. Conserved Phe-binding pocket residues (according to the hPNUTS–PP1 structure) are shown in blue sticks. LtPNUTS–PP1-8e complex (right). The C terminus of LtPP1-8e is shown in red carton, and key residues (P352 and I360) shown to be important for LtPNUTS binding are shown in sticks and labeled. Residues 109GGTVFG114 within the PP1 catalytic motif and important for PNUTS binding are also shown in red, and residue 113F is shown as sticks and labeled. hPNUTS, human PNUTS; LtPNUTS, Leishmania tarentolae PNUTS; PNUTS, PP1 nuclear targeting subunit; PP1, phosphoprotein phosphatase 1.
Figure 5 The predicted LtPNUTS–PP1-1a structure.A, the predicted holoenzyme structure of LtPNUTS (pink ribbon) and LtPP1-1a (white surface). The RVxF-binding pocket (red) and ΦΦ-binding pocket (cyan) are shaded on PP1 surface. B, structural comparison of the PP1-binding domains of LtPNUTS in complex with PP1-8e (green) or PP1-1a (pink). Structure of hPNUTS (blue) bound to hPP1 is also shown. C, close-up view of F118PNUTS (pink) in complex with LtPP1-1a (white surface, left) or (green) with LtPP1-8e (white surface, right). F118 and Y119 of PNUTS are shown as sticks and labeled. Conserved Phe-binding pocket residues (according to the hPNUTS–PP1 structure) are shown in blue sticks. LtPNUTS–PP1-8e complex (right). The C terminus of LtPP1-8e is shown in red carton, and key residues (P352 and I360) shown to be important for LtPNUTS binding are shown in sticks and labeled. Residues 109GGTVFG114 within the PP1 catalytic motif and important for PNUTS binding are also shown in red, and residue 113F is shown as sticks and labeled. hPNUTS, human PNUTS; LtPNUTS, Leishmania tarentolae PNUTS; PNUTS, PP1 nuclear targeting subunit; PP1, phosphoprotein phosphatase 1.CC BY · PubMed Central
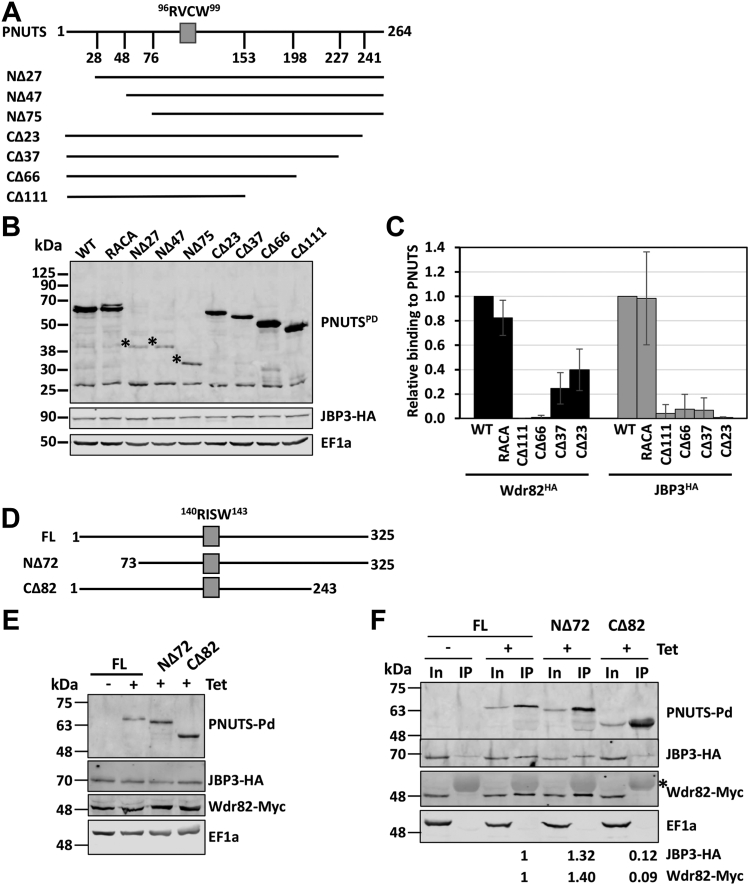
Figure 6 JBP3 and Wdr82 bind to the C terminus of PNUTS.A–C, coimmunoprecipitation analysis of LtPNUTS and Wdr82 and JBP3. A, schematic diagram of PNUTS depicting the PP1-specific RVxF SLiM (RVCW). Constructs used in this study are illustrated. B, Western blot showing the protein expression of Pd-tagged PNUTS (WT and truncation mutants) in JBP3-HA tagged Leishmania tarentolae cells. Dots indicate the proposed products representing the indicated N-terminal truncations. Anti-EF1A Western blot is shown as a loading control. C, analysis of JBP3–Wdr82 binding to PNUTS by co-IP. PNUTS truncations (C) or mutants (D) were tested for interaction with HA-tagged Wdr82 or JBP3 by co-IP analysis. %IP of WT Wdr82 and JBP3 by PNUTS were set to 1, and relative %IP of the indicated mutants was determined as described in Figure 3. The bar graph represents the mean ± SD from three independent experiments. See Fig. S10. D–F, co-IP analysis of TbPNUTS and Wdr82 and JBP3. D, schematic representation of the TbPNUTS truncations. The putative RVxF motif is indicated by a gray box. E, JBP3 and Wdr82 were endogenously tagged with HA and Myc tags, respectively. The protein expression of the indicated TbPNUTS was induced by addition of tetracycline (Tet) for 24 h, and lysates were analyzed by Western blot with anti-protein A, anti-HA, anti-Myc, or anti-EF1a. EF1a serves as a loading control. F, lysates of the indicated cell lines with or without tetracycline induction were purified by anti-protein A affinity resin and analyzed by Western blot with anti-protein A, anti-HA, anti-Myc, and anti-EF1a antibodies. Asterisk indicates the IgG cross-reactive signal in the IP fraction from anti-Myc. Protein A purification results in low background JBP3-HA signal in the absence of protein A-tagged PNUTS. %IP is quantified from two replicates and shown below for the corresponding cell lines. co-IP, coimmunoprecipitation; FL, full-length (WT) TbPNUTS; HA, hemagglutinin; IgG, immunoglobulin G; LtPNUTS, Leishmania tarentolae PNUTS; PNUTS, PP1 nuclear targeting subunit; PP1, phosphoprotein phosphatase 1; SLiM, short linear motif; TbPNUTS, Trypanosoma brucei PNUTS.
Figure 6 JBP3 and Wdr82 bind to the C terminus of PNUTS.A–C, coimmunoprecipitation analysis of LtPNUTS and Wdr82 and JBP3. A, schematic diagram of PNUTS depicting the PP1-specific RVxF SLiM (RVCW). Constructs used in this study are illustrated. B, Western blot showing the protein expression of Pd-tagged PNUTS (WT and truncation mutants) in JBP3-HA tagged Leishmania tarentolae cells. Dots indicate the proposed products representing the indicated N-terminal truncations. Anti-EF1A Western blot is shown as a loading control. C, analysis of JBP3–Wdr82 binding to PNUTS by co-IP. PNUTS truncations (C) or mutants (D) were tested for interaction with HA-tagged Wdr82 or JBP3 by co-IP analysis. %IP of WT Wdr82 and JBP3 by PNUTS were set to 1, and relative %IP of the indicated mutants was determined as described in Figure 3. The bar graph represents the mean ± SD from three independent experiments. See Fig. S10. D–F, co-IP analysis of TbPNUTS and Wdr82 and JBP3. D, schematic representation of the TbPNUTS truncations. The putative RVxF motif is indicated by a gray box. E, JBP3 and Wdr82 were endogenously tagged with HA and Myc tags, respectively. The protein expression of the indicated TbPNUTS was induced by addition of tetracycline (Tet) for 24 h, and lysates were analyzed by Western blot with anti-protein A, anti-HA, anti-Myc, or anti-EF1a. EF1a serves as a loading control. F, lysates of the indicated cell lines with or without tetracycline induction were purified by anti-protein A affinity resin and analyzed by Western blot with anti-protein A, anti-HA, anti-Myc, and anti-EF1a antibodies. Asterisk indicates the IgG cross-reactive signal in the IP fraction from anti-Myc. Protein A purification results in low background JBP3-HA signal in the absence of protein A-tagged PNUTS. %IP is quantified from two replicates and shown below for the corresponding cell lines. co-IP, coimmunoprecipitation; FL, full-length (WT) TbPNUTS; HA, hemagglutinin; IgG, immunoglobulin G; LtPNUTS, Leishmania tarentolae PNUTS; PNUTS, PP1 nuclear targeting subunit; PP1, phosphoprotein phosphatase 1; SLiM, short linear motif; TbPNUTS, Trypanosoma brucei PNUTS.CC BY · PubMed Central
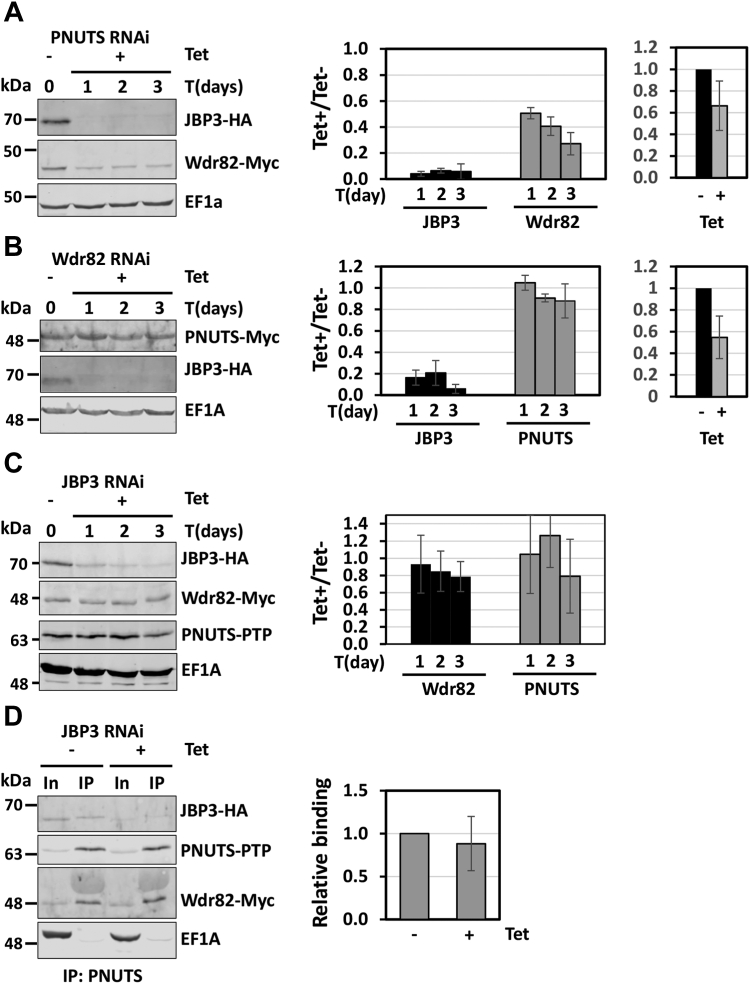
Figure 7 TbPNUTS functions as a scaffold factor. RNAi knockdown of the Trypanosoma brucei PJW complex components. Endogenous loci of the indicated genes were tagged with HA, PTP, or Myc tags. Cells were then transfected with the indicated RNAi construct, and knockdown of PNUTS (A), Wdr82 (B), or JBP3 (C) was induced by tetracycline (Tet) addition. Cell lysates were collected at the indicated time points and analyzed by Western blot with anti-protein A, anti-HA, or anti-Myc. Anti-EF1a serves as a loading control. Bands were quantified by densitometry. The bar graphs represent the mean ± SD from three independent experiments for the indicated protein level relative to protein level prior to the induction of RNAi. The bar graphs on the right, in A and B, show depletion of the RNAi targeted transcript upon Tet induction by qRT–PCR analysis and represent the mean ± SD from three independent experiments, with levels at uninduced (Tet-) set to 1. D, effect of JBP3 knockdown on PNUTS–Wdr82 binding. JBP3 RNAi was induced for 48 h, and PNUTS-PTP was purified from cell extracts by anti-protein A affinity resin and analyzed by Western blot. The %IP of Wdr82 by PNUTS IP with or without JBP3 RNAi induction was determined as described in Figure 3. The bar graph on the right represents the mean ± SD from three independent experiments, with the %IP from the uninduced cells set to 1. HA, hemagglutinin; qRT–PCR, quantitative RT–PCR; TbPNUTS, Trypanosoma brucei PNUTS.
Figure 7 TbPNUTS functions as a scaffold factor. RNAi knockdown of the Trypanosoma brucei PJW complex components. Endogenous loci of the indicated genes were tagged with HA, PTP, or Myc tags. Cells were then transfected with the indicated RNAi construct, and knockdown of PNUTS (A), Wdr82 (B), or JBP3 (C) was induced by tetracycline (Tet) addition. Cell lysates were collected at the indicated time points and analyzed by Western blot with anti-protein A, anti-HA, or anti-Myc. Anti-EF1a serves as a loading control. Bands were quantified by densitometry. The bar graphs represent the mean ± SD from three independent experiments for the indicated protein level relative to protein level prior to the induction of RNAi. The bar graphs on the right, in A and B, show depletion of the RNAi targeted transcript upon Tet induction by qRT–PCR analysis and represent the mean ± SD from three independent experiments, with levels at uninduced (Tet-) set to 1. D, effect of JBP3 knockdown on PNUTS–Wdr82 binding. JBP3 RNAi was induced for 48 h, and PNUTS-PTP was purified from cell extracts by anti-protein A affinity resin and analyzed by Western blot. The %IP of Wdr82 by PNUTS IP with or without JBP3 RNAi induction was determined as described in Figure 3. The bar graph on the right represents the mean ± SD from three independent experiments, with the %IP from the uninduced cells set to 1. HA, hemagglutinin; qRT–PCR, quantitative RT–PCR; TbPNUTS, Trypanosoma brucei PNUTS.CC BY · PubMed Central
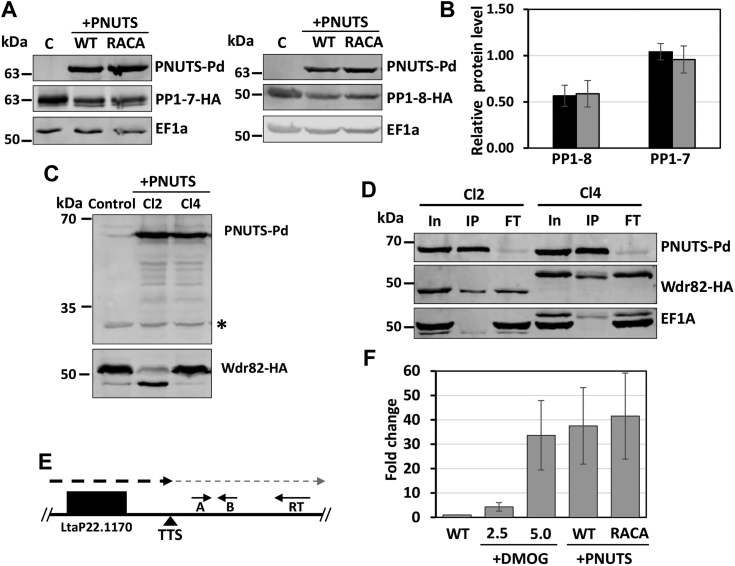
Figure 8 LtPNUTS overexpression alters PP1 and Wdr82 stability and transcription termination.A–D, effect of PNUTS overexpression on PP1 and Wdr82. A, PP1-1 or PP1-8 was tagged with HA tag at its endogenous loci, and either WT or RACA mutant PNUTS protein was exogenously overexpressed. Cell lysates were analyzed by Western blot with anti-protein, anti-HA, and anti-EF1a. Anti-EF1A serves as a loading control. PP1-tagged control cell lines not transfected with the PNUTS expression plasmid are indicated by the C for control. B, HA-tagged PP1-1 and PP1-8 band intensities were quantified by densitometry. The bar graph represents the mean ± SD of PP1-1 or PP1-8 protein level relative to control cells with no overexpression of PNUTS (WT, black bar; RACA mutant, gray bar). C, Wdr82 was tagged at its endogenous loci with HA tag with or without WT PNUTS overexpression, and cell lines were analyzed by Western blot with anti-protein A and anti-HA. A nonspecific product recognized by the anti-protein A antibody is indicated by an asterisk and serves as a loading control. Shown here are results from two clones (Cl2 and Cl4). See Fig. S11B for results from multiple clones. D, cell extracts from the cell lines in C were purified by anti-protein A affinity resin and analyzed by Western blot with anti-protein A, anti-HA, and anti-EF1a. E and F, effect of PNUTS overexpression on polymerase II transcription termination. E, diagram of the termination site at the end of a polycistronic gene array on chromosome 22 illustrating the strand-specific RT–qPCR analysis of readthrough defects. The dashed line indicates the readthrough transcripts past the transcription termination site (TTS) that accumulate following a defect in polymerase II termination. The location of primers for RT and qPCR (A and B) are indicated by the small arrows. F, RT–PCR analysis for the readthrough transcripts. Strand-specific cDNAs were synthesized from RNAs extracted from cells treated with the indicated concentrations of DMOG or from cells with either WT or RACA mutant PNUTS overexpression using primer RT. Fold change of the readthrough transcripts relative to the WT ± SD is based on qPCR analysis with primer A and B, normalized to tubulin RNA. cDNA, complementary DNA; HA, hemagglutinin; LtPNUTS, Leishmania tarentolae PNUTS; PP1, phosphoprotein phosphatase 1; qPCR, quantitative PCR.
Figure 8 LtPNUTS overexpression alters PP1 and Wdr82 stability and transcription termination.A–D, effect of PNUTS overexpression on PP1 and Wdr82. A, PP1-1 or PP1-8 was tagged with HA tag at its endogenous loci, and either WT or RACA mutant PNUTS protein was exogenously overexpressed. Cell lysates were analyzed by Western blot with anti-protein, anti-HA, and anti-EF1a. Anti-EF1A serves as a loading control. PP1-tagged control cell lines not transfected with the PNUTS expression plasmid are indicated by the C for control. B, HA-tagged PP1-1 and PP1-8 band intensities were quantified by densitometry. The bar graph represents the mean ± SD of PP1-1 or PP1-8 protein level relative to control cells with no overexpression of PNUTS (WT, black bar; RACA mutant, gray bar). C, Wdr82 was tagged at its endogenous loci with HA tag with or without WT PNUTS overexpression, and cell lines were analyzed by Western blot with anti-protein A and anti-HA. A nonspecific product recognized by the anti-protein A antibody is indicated by an asterisk and serves as a loading control. Shown here are results from two clones (Cl2 and Cl4). See Fig. S11B for results from multiple clones. D, cell extracts from the cell lines in C were purified by anti-protein A affinity resin and analyzed by Western blot with anti-protein A, anti-HA, and anti-EF1a. E and F, effect of PNUTS overexpression on polymerase II transcription termination. E, diagram of the termination site at the end of a polycistronic gene array on chromosome 22 illustrating the strand-specific RT–qPCR analysis of readthrough defects. The dashed line indicates the readthrough transcripts past the transcription termination site (TTS) that accumulate following a defect in polymerase II termination. The location of primers for RT and qPCR (A and B) are indicated by the small arrows. F, RT–PCR analysis for the readthrough transcripts. Strand-specific cDNAs were synthesized from RNAs extracted from cells treated with the indicated concentrations of DMOG or from cells with either WT or RACA mutant PNUTS overexpression using primer RT. Fold change of the readthrough transcripts relative to the WT ± SD is based on qPCR analysis with primer A and B, normalized to tubulin RNA. cDNA, complementary DNA; HA, hemagglutinin; LtPNUTS, Leishmania tarentolae PNUTS; PP1, phosphoprotein phosphatase 1; qPCR, quantitative PCR.CC BY · PubMed Central

Verification

Claims the paper makes

The claims and statistics of this paper haven’t been checked yet.

Run the check — free, no account needed. It reads the open-access text and checks the sources it cites.

A few free checks a day · papers already verified open instantly · results are public

Self-check

Percentages, sums and reported differences re-computed from the paper’s own numbers.

The self-check needs the paper’s full text.

Citations

Cites

Show all 88 references

Metadata

Authors
Zhang, Y., & Sabatini, R.
Affiliations
University of Georgia (US)
Corresponding author
Sabatini, Robert
Venue
Journal of Biological Chemistry
Publisher
Elsevier BV
Published
2023-12
Volume
299
Issue
12
Pages
105432
ISSN
0021-9258 (ISSN-L)
OpenAlex
W4388313095
Cited by
4
References
88
Citations by year
2024: 2 · 2023: 2
FWCI
1.02
Type
journal article
Language
en
Open access
Licence
Locations
  • Journal of Biological Chemistry (publishedVersion, cc-by)
  • bioRxiv (Cold Spring Harbor Laboratory) (acceptedVersion)
  • PubMed Central (publishedVersion, cc-by)
  • PubMed (publishedVersion)
  • PubMed Central (submittedVersion)
Funders
National Institutes of Health (R01AI109108)
Topics
  • Health Sciences › Medicine › Public Health, Environmental and Occupational Health › Research on Leishmaniasis Studies
  • Life Sciences › Biochemistry, Genetics and Molecular Biology › Molecular Biology › Protein Tyrosine Phosphatases
  • Life Sciences › Biochemistry, Genetics and Molecular Biology › Molecular Biology › Genomics and Chromatin Dynamics
Keywords
Leishmania, PNUTS, PP1 phosphatase, PP1 regulatory subunits, WDR82, RNA polymerase II transcription, transcription termination, protein-protein interaction, scaffold proteins

About these checks

Registry, retraction, Cites and statistics results are computed, not judged, with one exception: a printed reference that no index lists is read once by a model before it counts as a citation error. Claims are extracted by a model and kept only when their quote appears verbatim in the text; each cited source is then checked, with a model’s help, for whether it says what the claim relies on. Those verdicts can be wrong — read the claim’s quote and the cited source before relying on one.

Statistics and arithmetic are recomputed, not judged.

Confidence bands are shown only for fields calibrated on our annotated test set. None is calibrated yet, so no band is shown.

What counts as a claim ›How we measure confidence ›How we check this ›

Are you an author, or do you see a problem with this page? Request a review

How to cite

Cite CoChat for the checks on this page, and the paper for its own findings.

This page
CoChat. (2026). Citation check: Leishmania PNUTS discriminates between PP1 catalytic subunits through an RVxF–ΦΦ–F motif and polymorphisms in the PP1 C-tail and catalytic domain. https://app.cochat.ai/papers/10.1016/j.jbc.2023.105432
The paper
Zhang, Y., & Sabatini, R. (2023). Leishmania PNUTS discriminates between PP1 catalytic subunits through an RVxF–ΦΦ–F motif and polymorphisms in the PP1 C-tail and catalytic domain. Journal of Biological Chemistry. https://doi.org/10.1016/j.jbc.2023.105432

Data sources

Bibliographic data: Semantic Scholar, OpenAlex, Crossref.

Contains information from the Semantic Scholar Academic Graph Datasets, made available under the ODC Attribution License (ODC-BY 1.0).

Semantic Scholar’s data is described in: Kinney, R., et al. (2023). The Semantic Scholar Open Data Platform. arXiv:2301.10140.