

The DOI matches its Crossref record; 45 of the 45 references it cites were found in a registry or an index.
Predicting Clinical Outcomes of Cirrhosis Patients With Hepatic Encephalopathy From the Fecal Microbiome
Open accessAbstract
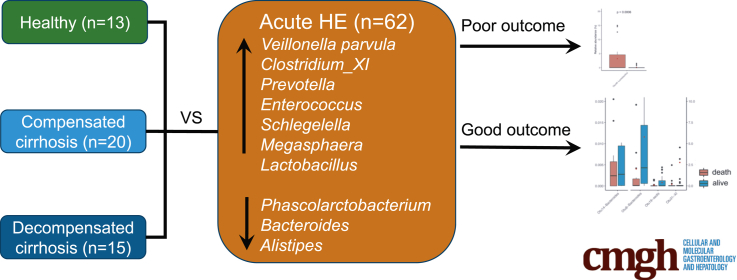
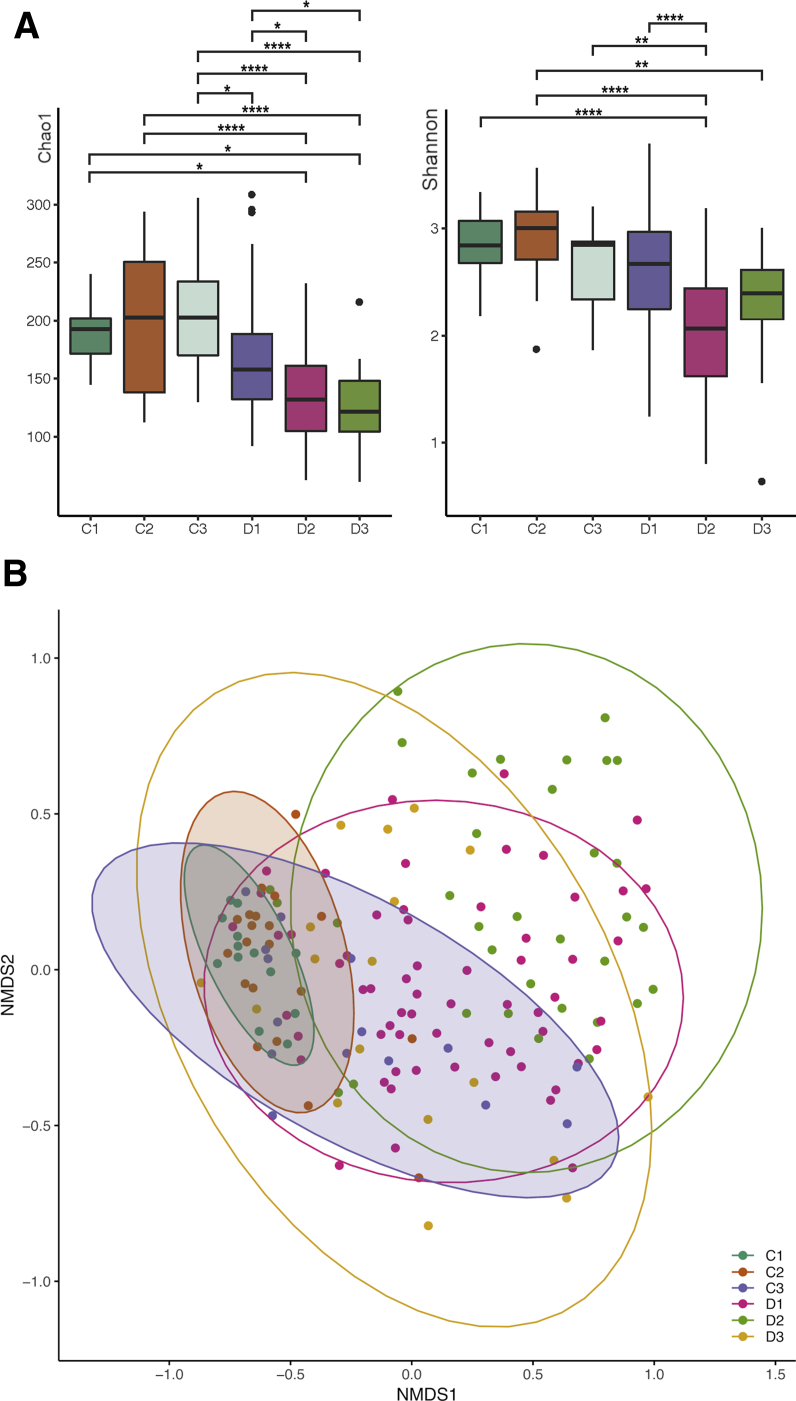
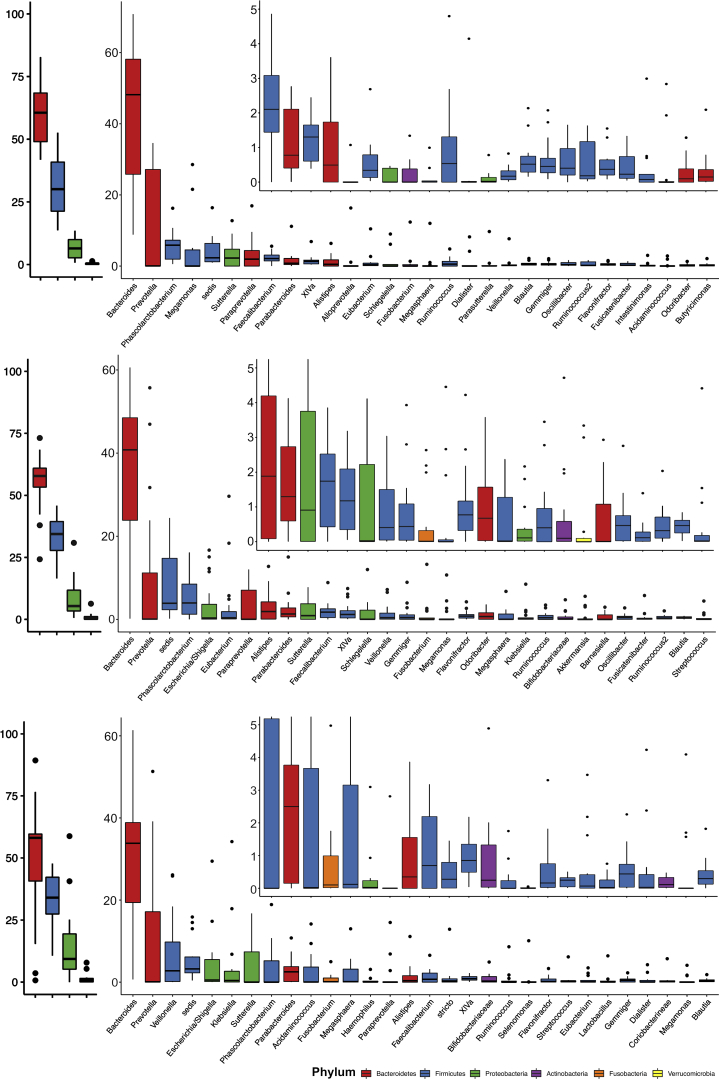
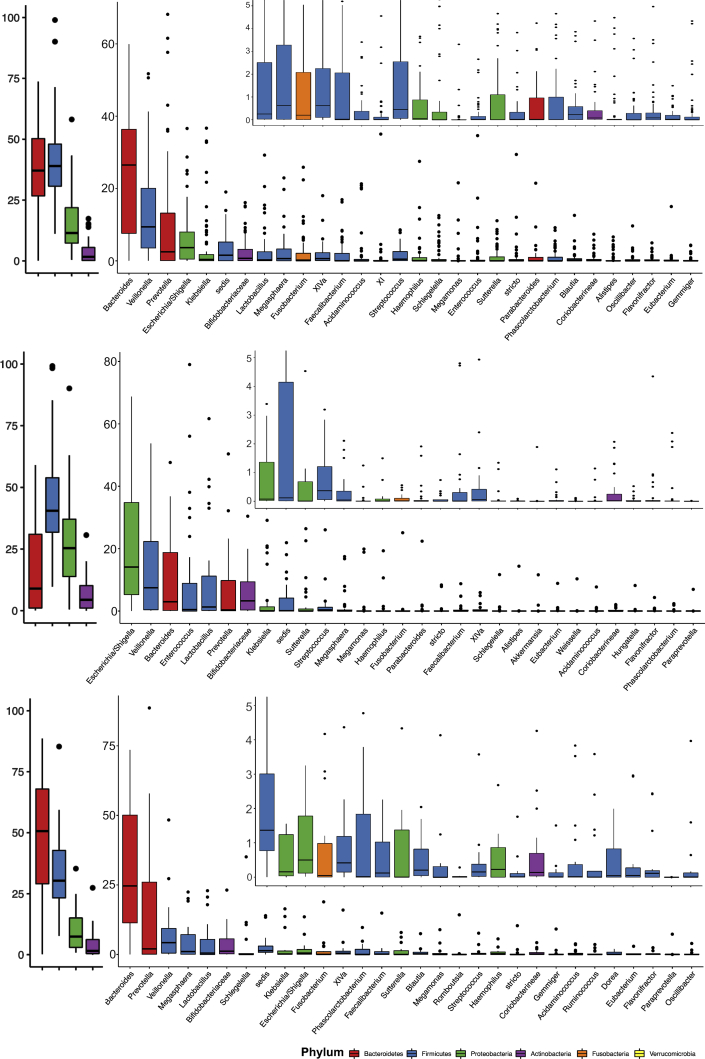
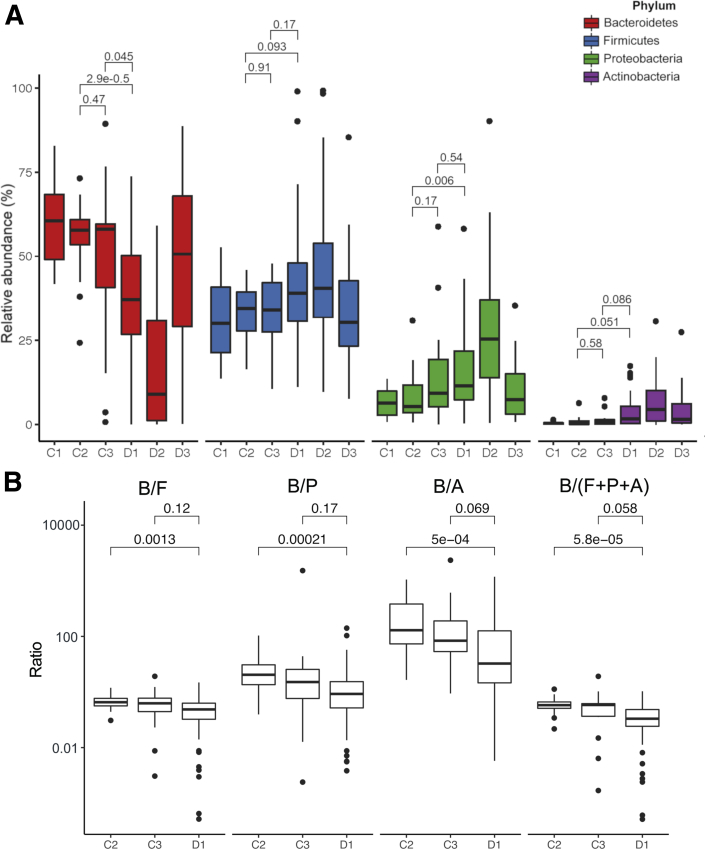
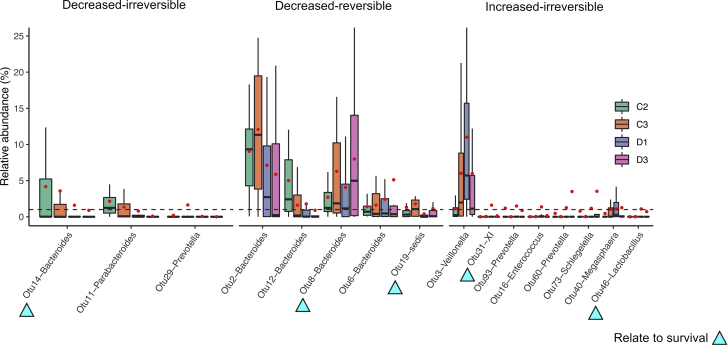
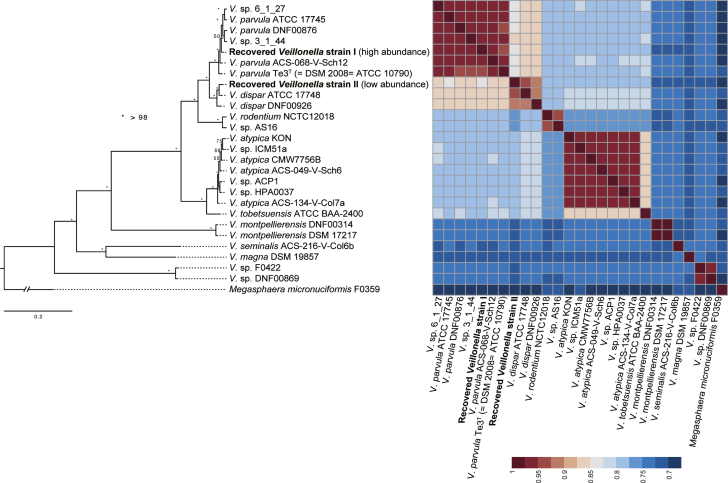
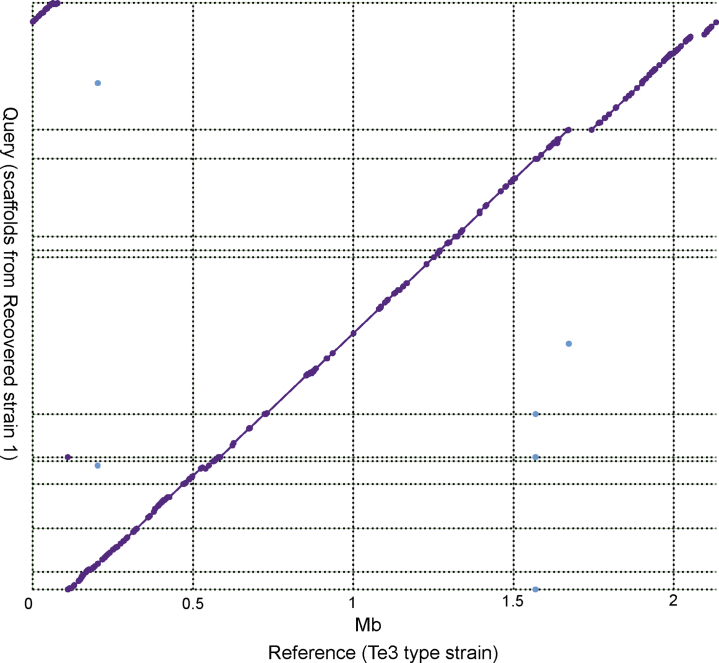
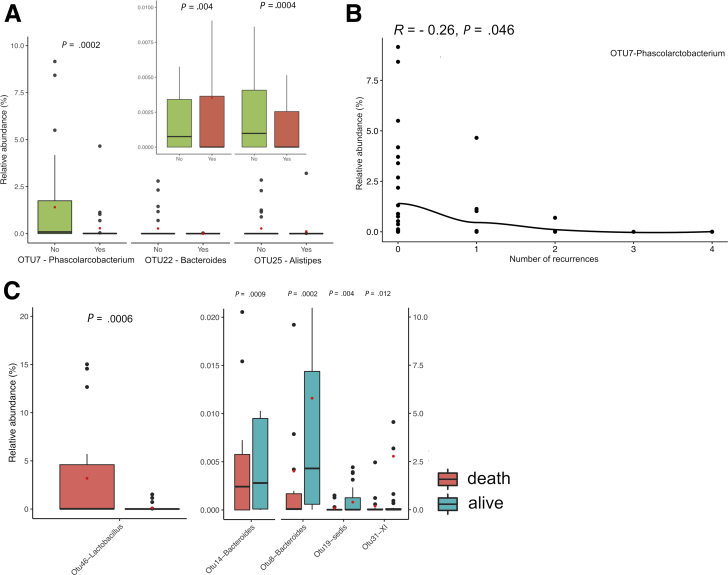
BACKGROUND & AIMS: Gut dysbiosis plays a role in hepatic encephalopathy (HE), while its relationship at the acute episode of overt HE (AHE), the disease progression and clinical outcomes remains unclear. We aimed to identify AHE-specific microbiome and its association to patients' outcomes. METHODS: We profiled fecal microbiome changes for a cohort of 62 patients with cirrhosis and AHE i) before treatment, ii) 2-3 days after medication and iii) 2-3 months after recovery, and three control cohorts i) healthy individuals, patients with ii) compensated or iii) decompensated cirrhosis. RESULTS: Comparison of the microbiome shift from compensated, decompensated cirrhosis, AHE to recovery revealed the AHE-specific gut-dysbiosis. The gut microbiome diversity was decreased during AHE, further reduced after medication, and only partially reversed during the recovery. The relative abundance of Bacteroidetes phylum in the microbiome decreased, whereas that of Firmicute, Proteobacteria and Actinobacteria increased in patients during AHE compared with those with compensated cirrhosis. A total of 70 operational taxonomic units (OTUs) were significantly different between AHE and decompensated cirrhosis abundances. Of them, the abundance of Veillonella parvula increased the most during AHE via a metagenomics recovery of the genomes. Moreover, the relative abundances of three (Alistipes, Bacteroides, Phascolarctobacterium) and five OTUs (Clostridium-XI, Bacteroides, Bacteroides, Lactobacillus, Clostridium-sedis) at AHE were respectively associated with HE recurrence and overall survival during the subsequent one-year follow-up. CONCLUSIONS: AHE-specific gut OTUs were identified that may be involved in HE development and able to predict clinical outcomes, providing new strategies for the prevention and treatment of HE recurrence in patients with cirrhosis.
Overview
The claims and statistics of this paper haven’t been checked yet.
Run the check — free, no account needed. It reads the open-access text and checks the sources it cites.
Integrity signals
Registry
Cites
Statistics
Figures
Verification
Claims the paper makes
The claims and statistics of this paper haven’t been checked yet.
Run the check — free, no account needed. It reads the open-access text and checks the sources it cites.
Claims other papers make about this one
Each is checked against this paper’s own text: does it say what the citing paper says it does?
In the citing paper
“Research has also shown a significant increase in Alcaligenaceae, Porphyromonadaceae, Veillonellaceae, Enterococcus, Megasphaera, and Burkholderia in the GI microbiome of cirrhotic patients with hepatic encephalopathy (HE), and this taxonomic shift has been associated with hyperammonemia and systemic inflammation [164].”
From The Potential Impact of Probiotics on Human Health: An Update on Their Health-Promoting Properties (2024) · cites this paper as [164]
In the citing paper
“Interestingly, research has shown a significant increase in Alcaligenaceae, Porphyromonadaceae, Veillonellaceae, Enterococcus, Megasphaera, and Burkholderia in the GI microbiomes of cirrhotic patients with HE. This taxonomic shift was associated with hyperammonaemia and systemic inflammation contributing to the exacerbation of HE symptoms (Sung et al., 2019).”
From Viral Infections, the Microbiome, and Probiotics (2021) · cites this paper as Sung et al., 2019
In the citing paper
“For example, it is well established that the cognitive impairment arising due to hepatic encephalopathy is mediated by microbial disturbances and can be reversed with oral antibiotic treatment (414–417).”
From Signalling cognition: The gut microbiota and hypothalamic-pituitary-adrenal axis (2023) · cites this paper as [416]
Self-check
Percentages, sums and reported differences re-computed from the paper’s own numbers.
The self-check needs the paper’s full text.
Citations
Cites
Moderated estimation of fold change and dispersion for RNA-seq data with DESeq2
Love, M. I., Huber, W., & Anders, S. (2014) · Genome Biology · doi:10.1186/s13059-014-0550-8 · Cited by 95,106
Trimmomatic: a flexible trimmer for Illumina sequence data
Bolger, A. M., Lohse, M., & Usadel, B. (2014) · Bioinformatics · doi:10.1093/bioinformatics/btu170 · Cited by 65,548
phyloseq: An R Package for Reproducible Interactive Analysis and Graphics of Microbiome Census Data
McMurdie, P. J., & Holmes, S. (2013) · PLoS ONE · doi:10.1371/journal.pone.0061217 · Cited by 21,942
UPARSE: highly accurate OTU sequences from microbial amplicon reads
Edgar, R. C. (2013) · Nature Methods · doi:10.1038/nmeth.2604 · Cited by 16,770
RAxML-VI-HPC: maximum likelihood-based phylogenetic analyses with thousands of taxa and mixed models
Stamatakis, A. (2006) · Bioinformatics · doi:10.1093/bioinformatics/btl446 · Cited by 15,582
Erdogan, D., Heijnen, B. H. M., Bennink, R. J., Kok, M., Dinant, S., Straatsburg, I. H., Gouma, D. J., & van Gulik, T. M. (2004) · Liver International · doi:10.1111/j.1478-3231.2004.00901.x · Cited by 11,656
Transection of the oesophagus for bleeding oesophageal varices
Pugh, R. N. H., Murray-Lyon, I. M., Dawson, J. L., Pietroni, M. C., & Williams, R. (1973) · Journal of British Surgery · doi:10.1002/bjs.1800600817 · Cited by 7,941
Kozich, J. J., Westcott, S. L., Baxter, N. T., Highlander, S. K., & Schloss, P. D. (2013) · Applied and Environmental Microbiology · doi:10.1128/aem.01043-13 · Cited by 7,246
Changes of Intestinal Functions in Liver Cirrhosis
Fukui, H., & Wiest, R. (2016) · Inflammatory Intestinal Diseases · doi:10.1159/000444436 · Cited by 6,820
Kraken: ultrafast metagenomic sequence classification using exact alignments
Wood, D. E., & Salzberg, S. L. (2014) · Genome Biology · doi:10.1186/gb-2014-15-3-r46 · Cited by 4,521
Cited by
Sorted by citations
Parker, B. J., Wearsch, P. A., Veloo, A. C. M., & Rodriguez‐Palacios, A. (2020) · Frontiers in Immunology · doi:10.3389/fimmu.2020.00906 · Cited by 1,771
Signalling cognition: The gut microbiota and hypothalamic-pituitary-adrenal axis
Rusch, J. A., Layden, B. T., & Dugas, L. R. (2023) · Frontiers in Endocrinology · doi:10.3389/fendo.2023.1130689 · Cited by 415
The Potential Impact of Probiotics on Human Health: An Update on Their Health-Promoting Properties
Maftei, N.-M., Raileanu, C. R., Balta, A. A., Ambrose, L., Boev, M., Marin, D. B., & Lisa, E. L. (2024) · Microorganisms · doi:10.3390/microorganisms12020234 · Cited by 381
Acute-on-Chronic Liver Failure Clinical Guidelines
Bajaj, J. S., O’Leary, J. G., Lai, J. C., Wong, F. S.-H., Long, M. D., Wong, R. J., & Kamath, P. S. (2022) · The American Journal of Gastroenterology · doi:10.14309/ajg.0000000000001595 · Cited by 247
Viral Infections, the Microbiome, and Probiotics
Harper, A., Vijayakumar, V., Ouwehand, A. C., ter Haar, J., Obis, D., Espadaler, J., Binda, S., Desiraju, S., & Day, R. (2021) · Frontiers in Cellular and Infection Microbiology · doi:10.3389/fcimb.2020.596166 · Cited by 177
Metadata
- Authors
- Sung, C. M., Lin, Y.-F., Chen, K.-F., Ke, H.-M., Huang, H.-Y., Gong, Y.-N., Tsai, W.-S., You, J.-F., Lu, M. J., Cheng, H.-T., Lin, C.-Y., Kuo, C.-J., Tsai, I. J., & Hsieh, S.-Y.
- Affiliations
- Chang Gung University (TW)
- Biodiversity Research Center, Academia Sinica (TW)
- Chang Gung Memorial Hospital (TW)
- Corresponding author
- Tsai, Isheng J.
- Hsieh, Sen-Yung
- ORCID
- Venue
- Cellular and Molecular Gastroenterology and Hepatology
- Publisher
- Elsevier BV
- Published
- 2019
- Volume
- 8
- Issue
- 2
- Pages
- 301-318.e2
- ISSN
- 2352-345X (ISSN-L)
- PMC
- PMC6718362
- OpenAlex
- W2938740358
- Cited by
- 127
- References
- 45
- Citations by year
- 2026: 9 · 2025: 16 · 2024: 17 · 2023: 22 · 2022: 24 · 2021: 21 · 2020: 13 · 2019: 5
- FWCI
- 5.21
- Type
- journal article
- Language
- en
- Open access
- gold
- doi.org
- Licence
- Locations
- Cellular and Molecular Gastroenterology and Hepatology (publishedVersion, cc-by-nc-nd)
- PubMed Central (publishedVersion, cc-by-nc-nd)
- PubMed (publishedVersion)
- DOAJ (DOAJ: Directory of Open Access Journals) (submittedVersion, cc-by-sa)
- Funders
- National Health Research Institutes (NHRI-EX106-10619SC)
- Chang Gung Medical Foundation (CMRPG 3E1411-3, 3H1031-3)
- Topics
- Life Sciences › Biochemistry, Genetics and Molecular Biology › Molecular Biology › Gut microbiota and health
- Health Sciences › Medicine › Hepatology › Liver Disease and Transplantation
- Health Sciences › Medicine › Infectious Diseases › Clostridium difficile and Clostridium perfringens research
- Keywords
- hepatic encephalopathy, liver cirrhosis, gut microbiota, gut dysbiosis, fecal microbiota, decompensated cirrhosis, clinical outcome prediction, Veillonella parvula, Bacteroides, Phascolarctobacterium, Clostridium, Lactobacillus, overall survival, microbiome diversity
- MeSH terms
- Gastrointestinal Microbiome, Adult, Aged, Bacteria, Feces, Female, Hepatic Encephalopathy, Humans, Liver Cirrhosis, Male, Middle Aged, Prognosis, Dysbiosis
About these checks
Registry, retraction, Cites and statistics results are computed, not judged, with one exception: a printed reference that no index lists is read once by a model before it counts as a citation error. Claims are extracted by a model and kept only when their quote appears verbatim in the text; each cited source is then checked, with a model’s help, for whether it says what the claim relies on. Those verdicts can be wrong — read the claim’s quote and the cited source before relying on one.
Statistics and arithmetic are recomputed, not judged.
Confidence bands are shown only for fields calibrated on our annotated test set. None is calibrated yet, so no band is shown.
What counts as a claim ›How we measure confidence ›How we check this ›
Are you an author, or do you see a problem with this page? Request a review
