

The DOI matches its Crossref record; 49 of the 51 references it cites were found in a registry or an index.
A randomized, double-blind, placebo-controlled phase IIa trial of efruxifermin for patients with compensated NASH cirrhosis
Open accessAbstract
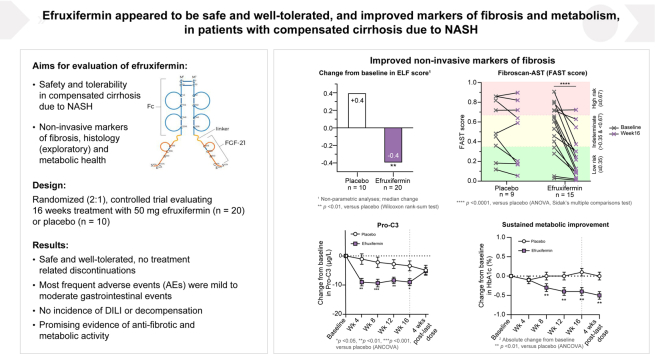
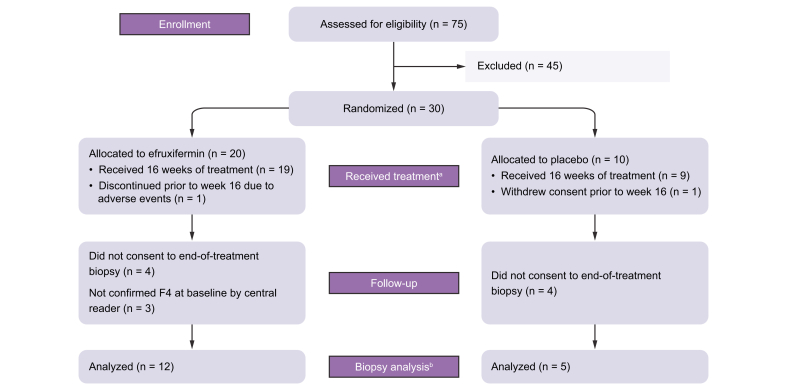
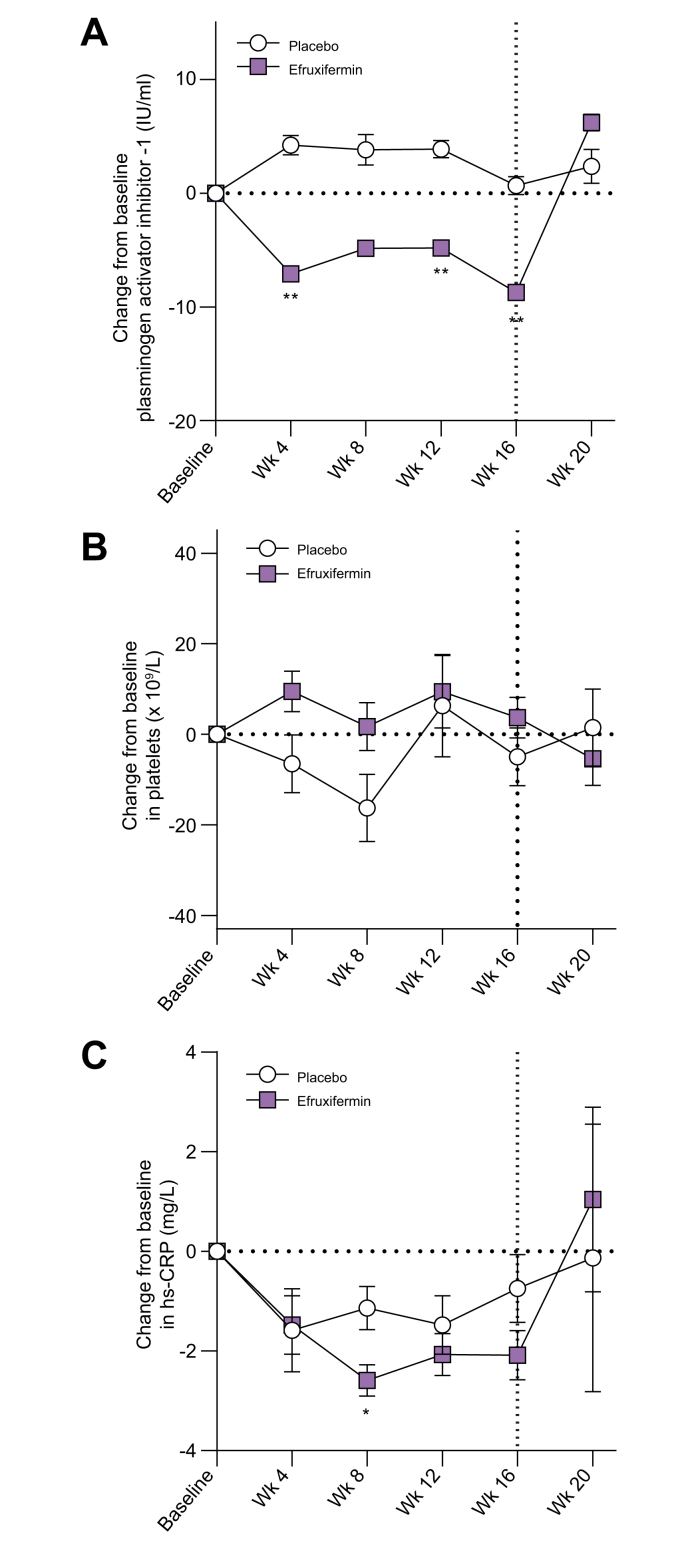
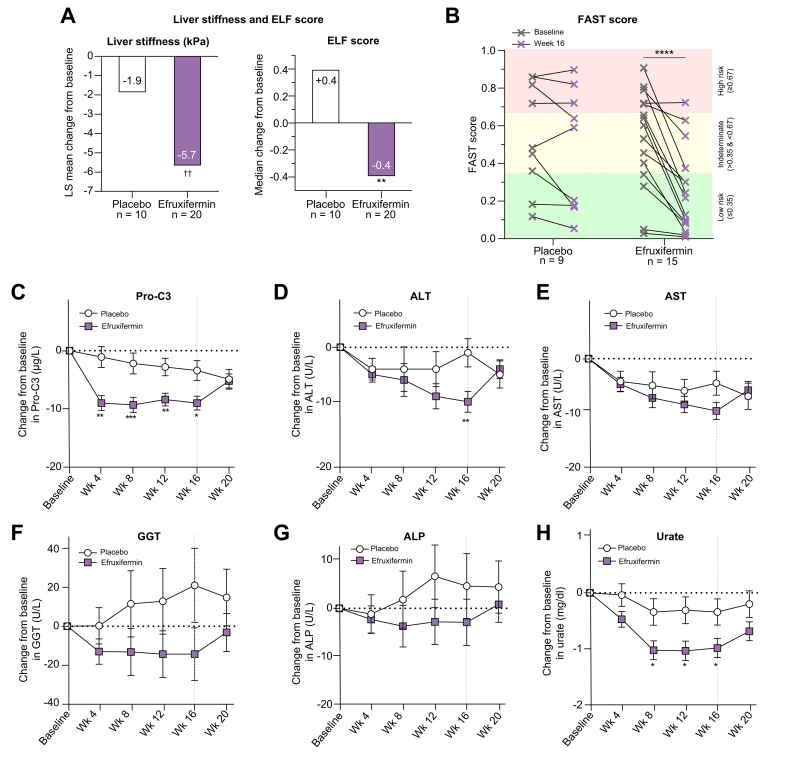
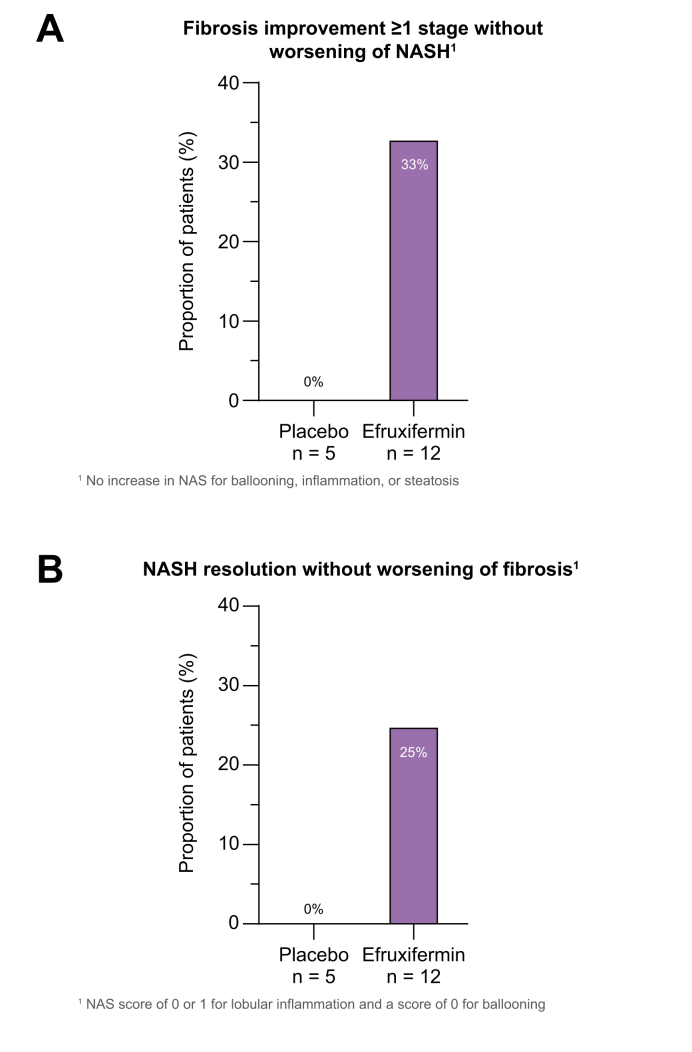
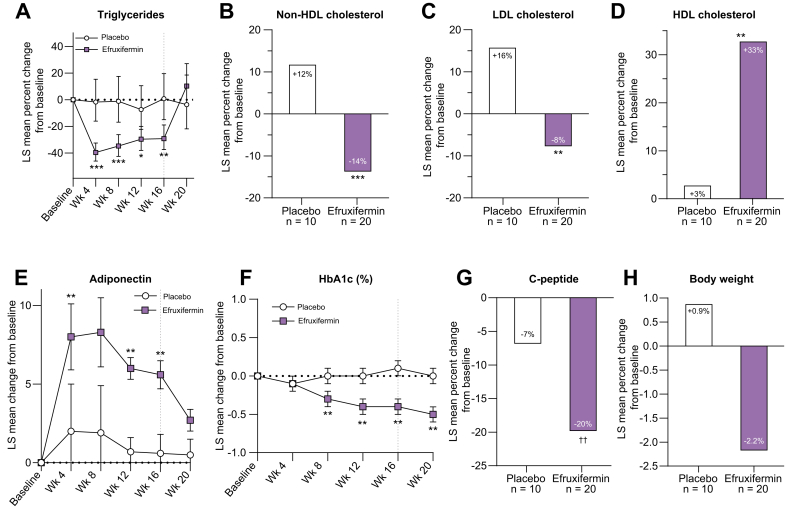
Background & Aims Efruxifermin has shown clinical efficacy in patients with non-alcoholic steatohepatitis (NASH) and F1–F3 fibrosis. The primary objective of the BALANCED Cohort C was to assess the safety and tolerability of efruxifermin in patients with compensated NASH cirrhosis. Methods Patients with NASH and stage 4 fibrosis (n = 30) were randomized 2:1 to receive efruxifermin 50 mg (n = 20) or placebo (n = 10) once-weekly for 16 weeks. The primary endpoint was safety and tolerability of efruxifermin. Secondary and exploratory endpoints included evaluation of non-invasive markers of liver injury and fibrosis, glucose and lipid metabolism, and changes in histology in a subset of patients who consented to end-of-study liver biopsy. Results Efruxifermin was safe and well-tolerated; most adverse events (AEs) were grade 1 (n = 7, 23.3%) or grade 2 (n = 19, 63.3%). The most frequent AEs were gastrointestinal, including transient, mild to moderate diarrhea, and/or nausea. Significant improvements were noted in key markers of liver injury (alanine aminotransferase) and glucose and lipid metabolism. Sixteen-week treatment with efruxifermin was associated with significant reductions in non-invasive markers of fibrosis including Pro-C3 (least squares mean change from baseline [LSMCFB] −9 μg/L efruxifermin vs. −3.4 μg/L placebo; p = 0.0130) and ELF score (−0.4 efruxifermin vs. +0.4 placebo; p = 0.0036), with a trend towards reduced liver stiffness (LSMCFB −5.7 kPa efruxifermin vs. −1.1 kPa placebo; n.s.). Of 12 efruxifermin-treated patients with liver biopsy after 16 weeks, 4 (33%) achieved fibrosis improvement of at least one stage without worsening of NASH, while an additional 3 (25%) achieved resolution of NASH, compared to 0 of 5 placebo-treated patients. Conclusions Efruxifermin appeared safe and well-tolerated with encouraging improvements in markers of liver injury, fibrosis, and glucose and lipid metabolism following 16 weeks of treatment, warranting confirmation in larger and longer term studies. Lay summary Cirrhosis resulting from non-alcoholic steatohepatitis (NASH), the progressive form of non-alcoholic fatty liver disease, represents a major unmet medical need. Currently there are no approved drugs for the treatment of NASH. This proof-of-concept randomized, double-blind clinical trial demonstrated the potential therapeutic benefit of efruxifermin treatment compared to placebo in patients with cirrhosis due to NASH. Clinical Trial Number NCT03976401
Overview
The claims and statistics of this paper haven’t been checked yet.
Run the check — free, no account needed. It reads the open-access text and checks the sources it cites.
Integrity signals
Registry
Cites
Statistics
Figures
Verification
Claims the paper makes
The claims and statistics of this paper haven’t been checked yet.
Run the check — free, no account needed. It reads the open-access text and checks the sources it cites.
Claims other papers make about this one
Each is checked against this paper’s own text: does it say what the citing paper says it does?
The cited source says what the claim attributes to it.
In the citing paper
“Of interest, adiponectin levels and insulin sensitivity increased with both substances despite, if any, only minor changes in body weight [202,203].”
From Obesity and MASLD: Is weight loss the (only) key to treat metabolic liver disease? (2024) · cites this paper as [203]
Self-check
Percentages, sums and reported differences re-computed from the paper’s own numbers.
The self-check needs the paper’s full text.
Citations
Cites
Chalasani, N., Younossi, Z., Lavine, J. E., Charlton, M., Cusi, K., Rinella, M., Harrison, S. A., Brunt, E. M., & Sanyal, A. J. (2018) · Hepatology · doi:10.1002/hep.29367 · Cited by 7,239
Self-citationNonalcoholic fatty liver disease: a spectrum of clinical and pathological severity.
MATTEONI, C., YOUNOSSI, Z., GRAMLICH, T., BOPARAI, N., LIU, Y., & MCCULLOUGH, A. (1999) · Gastroenterology · doi:10.1016/s0016-5085(99)70506-8 · Cited by 3,345
Angulo, P., Kleiner, D. E., Dam-Larsen, S., Adams, L. A., Bjornsson, E. S., Charatcharoenwitthaya, P., Mills, P. R., Keach, J. C., Lafferty, H. D., Stahler, A., et al. (2015) · Gastroenterology · doi:10.1053/j.gastro.2015.04.043 · Cited by 2,987
Ekstedt, M., Hagström, H., Nasr, P., Fredrikson, M., Stål, P., Kechagias, S., & Hultcrantz, R. (2015) · Hepatology · doi:10.1002/hep.27368 · Cited by 2,287
Dulai, P. S., Singh, S., Patel, J., Soni, M., Prokop, L. J., Younossi, Z., Sebastiani, G., Ekstedt, M., Hagstrom, H., Nasr, P., et al. (2017) · Hepatology · doi:10.1002/hep.29085 · Cited by 1,965
The economic and clinical burden of nonalcoholic fatty liver disease in the United States and Europe
Younossi, Z. M., Blissett, D. B., Blissett, R., Henry, L. L., Stepanova, M., Younossi, Y., Racila, A., Hunt, S., & Beckerman, R. (2016) · Hepatology · doi:10.1002/hep.28785 · Cited by 1,308
Xu, J., Lloyd, D. J., Hale, C., Stanislaus, S., Chen, M., Sivits, G., Vonderfecht, S., Hecht, R., Li, Y.-S., Lindberg, R. A., et al. (2009) · Diabetes · doi:10.2337/db08-0392 · Cited by 1,151
Taylor, R. S., Taylor, R. J., Bayliss, S., Hagström, H., Nasr, P., Schattenberg, J. M., Ishigami, M., Toyoda, H., Wai-Sun Wong, V., Peleg, N., et al. (2020) · Gastroenterology · doi:10.1053/j.gastro.2020.01.043 · Cited by 1,069
Fibroblast Growth Factor 21 Corrects Obesity in Mice
Coskun, T., Bina, H. A., Schneider, M. A., Dunbar, J. D., Hu, C. C., Chen, Y., Moller, D. E., & Kharitonenkov, A. (2008) · Endocrinology · doi:10.1210/en.2008-0816 · Cited by 1,031
Self-citationNewsome, P. N., Sasso, M., Deeks, J. J., Paredes, A. H., Boursier, J., Chan, W., Yilmaz, Y. N., Czernichow, S., Zheng, M., Wong, V. W., et al. (2020) · The Lancet. Gastroenterology & hepatology · doi:10.1016/s2468-1253(19)30383-8 · Cited by 839
Self-citationA Randomized, Controlled Trial of the Pan-PPAR Agonist Lanifibranor in NASH
Francque, S. M., Bedossa, P., Ratziu, V., Anstee, Q. M., Bugianesi, E., Sanyal, A. J., Loomba, R., Harrison, S. A., Balabanska, R., Mateva, L., et al. (2021) · New England Journal of Medicine · doi:10.1056/nejmoa2036205 · Cited by 801
Self-citation2019 Global NAFLD Prevalence: A Systematic Review and Meta-analysis
Le, M. H., Yeo, Y. H., Li, X., Li, J., Zou, B., Wu, Y., Ye, Q., Huang, D. Q., Zhao, C., Zhang, J., et al. (2022) · Clinical Gastroenterology and Hepatology · doi:10.1016/j.cgh.2021.12.002 · Cited by 711
Lin, Z., Tian, H., Lam, K. S. L., Lin, S., Hoo, R. C. L., Konishi, M., Itoh, N., Wang, Y., Bornstein, S. R., Xu, A., et al. (2013) · Cell Metabolism · doi:10.1016/j.cmet.2013.04.005 · Cited by 691
Noureddin, M., Vipani, A., Bresee, C. J., Todo, T., Kim, I. K., Alkhouri, N., Setiawan, V. W., Tran, T. T., Ayoub, W. S., Lu, S. C.-L., et al. (2018) · The American Journal of Gastroenterology · doi:10.1038/s41395-018-0088-6 · Cited by 578
Past, present and future perspectives in nonalcoholic fatty liver disease
Sanyal, A. J. (2019) · Nature Reviews Gastroenterology & Hepatology · doi:10.1038/s41575-019-0144-8 · Cited by 522
Harrison, S. A., Wong, V. W.-S., Okanoue, T., Bzowej, N., Vuppalanchi, R., Younes, Z., Kohli, A., Sarin, S., Caldwell, S. H., Alkhouri, N., et al. (2020) · Journal of Hepatology · doi:10.1016/j.jhep.2020.02.027 · Cited by 497
Self-citationTalukdar, S., Zhou, Y., Li, D., Rossulek, M., Dong, J., Somayaji, V., Weng, Y., Clark, R., Lanba, A., Owen, B. M., et al. (2016) · Cell Metabolism · doi:10.1016/j.cmet.2016.02.001 · Cited by 496
Self-citationHistopathology of nonalcoholic fatty liver disease/nonalcoholic steatohepatitis
Takahashi, Y. (2014) · World Journal of Gastroenterology · doi:10.3748/wjg.v20.i42.15539 · Cited by 492
Harrison, S. A., Abdelmalek, M. F., Caldwell, S., Shiffman, M. L., Diehl, A. M., Ghalib, R., Lawitz, E. J., Rockey, D. C., Schall, R. A., Jia, C., et al. (2018) · Gastroenterology · doi:10.1053/j.gastro.2018.07.006 · Cited by 384
Self-citationHarrison, S. A., Ruane, P. J., Freilich, B. L., Neff, G., Patil, R., Behling, C. A., Hu, C., Fong, E., de Temple, B., Tillman, E. J., et al. (2021) · Nature Medicine · doi:10.1038/s41591-021-01425-3 · Cited by 368 · cited 19×
“The magnitude of improvement in markers of liver injury (ALT, AST, ALP, GGT, urate) associated with efruxifermin treatment was somewhat smaller for Cohort C than for the BALANCED main study.(32) This may be ascribed to a declining population of hepatocytes as fibrosis progresses to cirrhosis,(14) consistent with the l…”
BackgroundResultInfluentialSelf-citationHarrison, S. A., Gawrieh, S., Roberts, K., Lisanti, C. J., Schwope, R. B., Cebe, K. M., Paradis, V., Bedossa, P., Aldridge Whitehead, J. M., Labourdette, A., et al. (2021) · Journal of Hepatology · doi:10.1016/j.jhep.2021.02.034 · Cited by 293
Self-citationHarrison, S. A., Neff, G., Guy, C. D., Bashir, M. R., Paredes, A. H., Frias, J. P., Younes, Z., Trotter, J. F., Gunn, N. T., Moussa, S. E., et al. (2021) · Gastroenterology · doi:10.1053/j.gastro.2020.08.004 · Cited by 280
Self-citationAnstee, Q. M., Lawitz, E. J., Alkhouri, N., Wong, V. W., Romero‐Gomez, M., Okanoue, T., Trauner, M., Kersey, K., Li, G., Han, L., et al. (2019) · Hepatology · doi:10.1002/hep.30842 · Cited by 277
Self-citationFisher, F. M., Chui, P. C., Nasser, I. A., Popov, Y., Cunniff, J. C., Lundasen, T., Kharitonenkov, A., Schuppan, D., Flier, J. S., & Maratos-Flier, E. (2014) · Gastroenterology · doi:10.1053/j.gastro.2014.07.044 · Cited by 263
Heyens, L. J. M., Busschots, D., Koek, G. H., Robaeys, G., & Francque, S. (2021) · Frontiers in Medicine · doi:10.3389/fmed.2021.615978 · Cited by 258
Charles, E. D., Neuschwander‐Tetri, B. A., Pablo Frias, J., Kundu, S., Luo, Y., Tirucherai, G. S., & Christian, R. (2019) · Obesity · doi:10.1002/oby.22344 · Cited by 257
Cellular Mechanisms by Which FGF21 Improves Insulin Sensitivity in Male Mice
Camporez, J. P., Jornayvaz, F. R., Petersen, M. C., Pesta, D. H., Guigni, B. A., Serr, J., Zhang, D., Kahn, M., Samuel, V. T., Jurczak, M. J., et al. (2013) · Endocrinology · doi:10.1210/en.2013-1191 · Cited by 232
Tillman, E. J., & Rolph, T. (2020) · Frontiers in Endocrinology · doi:10.3389/fendo.2020.601290 · Cited by 214
Self-citationCombination therapy for non-alcoholic steatohepatitis: rationale, opportunities and challenges
Dufour, J.-F., Caussy, C., & Loomba, R. (2020) · Gut · doi:10.1136/gutjnl-2019-319104 · Cited by 193
van der Poorten, D., Samer, C. F., Ramezani–Moghadam, M., Coulter, S., Kacevska, M., Schrijnders, D., Wu, L. E., McLeod, D. J., Bugianesi, E., Komuta, M., et al. (2012) · Hepatology · doi:10.1002/hep.26072 · Cited by 179
Sanyal, A. J., Anstee, Q. M., Trauner, M., Lawitz, E. J., Abdelmalek, M. F., Ding, D., Han, L., Jia, C., Huss, R. S., Chung, C., et al. (2022) · Hepatology · doi:10.1002/hep.32204 · Cited by 171
Self-citationMu, J., Pinkstaff, J. K., Li, Z., Skidmore, L. K., Li, N., Myler, H. A., Dallas-Yang, Q., Hays, A. A., Yao, J., Bussell, S., et al. (2011) · Diabetes · doi:10.2337/db11-0838 · Cited by 162
Kim, A. M., Somayaji, V. R., Dong, J. Q., Rolph, T. P., Weng, Y., Chabot, J. R., Gropp, K. E., Talukdar, S., & Calle, R. A. (2017) · Diabetes, Obesity and Metabolism · doi:10.1111/dom.13023 · Cited by 145
Self-citationBone turnover: Biology and assessment tools
Szulc, P. (2018) · Best Practice & Research Clinical Endocrinology & Metabolism · doi:10.1016/j.beem.2018.05.003 · Cited by 140
Kaufman, A., Abuqayyas, L., Denney, W. S., Tillman, E. J., & Rolph, T. (2020) · Cell Reports Medicine · doi:10.1016/j.xcrm.2020.100057 · Cited by 131
Self-citationRecent Epidemiology of Nonalcoholic Fatty Liver Disease
Murag, S., Ahmed, A., & Kim, D. (2020) · Gut and Liver · doi:10.5009/gnl20127 · Cited by 127
Stanislaus, S., Hecht, R. I., Yie, J., Hager, T., Hall, M. P., Spahr, C. S., Wang, W., Weiszmann, J., Li, Y., Deng, L., et al. (2017) · Endocrinology · doi:10.1210/en.2016-1917 · Cited by 114
Chavassieux, P., Portero-Muzy, N., Roux, J.-P., Garnero, P., & Chapurlat, R. D. (2015) · The Journal of Clinical Endocrinology & Metabolism · doi:10.1210/jc.2015-2957 · Cited by 99
Xu, P., Zhang, Y., Liu, Y., Yuan, Q., Song, L., Liu, M., Liu, Z., Yang, Y., Li, J., Li, D., et al. (2016) · Toxicology and Applied Pharmacology · doi:10.1016/j.taap.2015.11.012 · Cited by 97
Veidal, S. S., Vassiliadis, E., Bay‐Jensen, A., Tougas, G. H., Vainer, B., & Karsdal, M. A. (2010) · Fibrogenesis & Tissue Repair · doi:10.1186/1755-1536-3-5 · Cited by 73
Abdelmalek, M. F., Charles, E. D., Sanyal, A. J., Harrison, S. A., Neuschwander‐Tetri, B. A., Goodman, Z. D., Ehman, R., Karsdal, M. A., Nakajima, A., Du, S., et al. (2021) · Contemporary Clinical Trials · doi:10.1016/j.cct.2021.106335 · Cited by 64
Self-citationFGF21 attenuates pulmonary fibrogenesis through ameliorating oxidative stress in vivo and in vitro
Zhang, S., Yu, D., Wang, M., Huang, T., Wu, H., Zhang, Y., Zhang, T., Wang, W., Yin, J., Ren, G., et al. (2018) · Biomedicine & Pharmacotherapy · doi:10.1016/j.biopha.2018.03.100 · Cited by 63
Bhattoa, H. P., Cavalier, E., Eastell, R., Heijboer, A. C., Jørgensen, N. R., Makris, K., Ulmer, C. Z., Kanis, J. А., Cooper, C. C., Silverman, S. L., et al. (2020) · Clinica Chimica Acta · doi:10.1016/j.cca.2020.12.023 · Cited by 61
Masugi, Y., Abe, T., Tsujikawa, H., Effendi, K., Hashiguchi, A., Abe, M., Imai, Y., Hino, K., Hige, S., Kawanaka, M., et al. (2017) · Hepatology Communications · doi:10.1002/hep4.1121 · Cited by 60
Wu, G., Li, H., Fang, Q., Zhang, J., Zhang, M., Zhang, L., Wu, L., Hou, X., Lu, J., Bao, Y., et al. (2017) · Scientific Reports · doi:10.1038/s41598-017-05257-5 · Cited by 49
Recent advances in understanding and managing non-alcoholic fatty liver disease
Albhaisi, S. A. M., & Sanyal, A. J. (2018) · F1000Research · doi:10.12688/f1000research.14421.1 · Cited by 44
Opoku, Y. K., Liu, Z., Afrifa, J., Kumi, A. K., Liu, H., Ghartey‐Kwansah, G., Koranteng, H., Jiang, X., Ren, G., & Li, D. (2020) · EXCLI journal · doi:10.17179/excli2020-1287 · Cited by 14
Frías, J. P., Lawitz, E., Ortiz‐Lasanta, G., FRANEY, B. B., Morrow, L., Chen, C., Tseng, L., Charlton, R. W., Mansbach, H., Margalit, M., et al. (2021) · Journal of the Endocrine Society · doi:10.1210/jendso/bvab048.010 · Cited by 9
Tirucherai, G., Mora, J. R., Revankar, R., & Charles, E. D. (2019) · Journal of Hepatology · doi:10.1016/s0618-8278(19)31589-0 · Cited by 5
Cited by
Sorted by citations
Harrison, S. A., Frias, J. P., Neff, G., Abrams, G. A., Lucas, K. J., Sanchez, W., Gogia, S., Sheikh, M. Y., Behling, C., Bedossa, P., et al. (2023) · The Lancet Gastroenterology & Hepatology · doi:10.1016/s2468-1253(23)00272-8 · Cited by 276
Self-citationHarrison, S. A., Rolph, T., Knott, M., & Dubourg, J. (2024) · Journal of Hepatology · doi:10.1016/j.jhep.2024.04.034 · Cited by 179
Self-citationObesity and MASLD: Is weight loss the (only) key to treat metabolic liver disease?
Huttasch, M., Roden, M., & Kahl, S. (2024) · Metabolism · doi:10.1016/j.metabol.2024.155937 · Cited by 169
Efruxifermin in Compensated Liver Cirrhosis Caused by MASH
Noureddin, M., Rinella, M. E., Chalasani, N., Neff, G. W., Lucas, K. J., Rodriguez, M. E., Rudraraju, M., Patil, R., Behling, C. A., Burch, M., et al. (2025) · New England Journal of Medicine · doi:10.1056/nejmoa2502242 · Cited by 144
Self-citationHarrison, S. A., Frías, J. P., Lucas, K. J., Reiss, G. M., Neff, G. W., Bollepalli, S., Su, Y., Chan, D. C., Tillman, E. J., Moulton, A. W., et al. (2024) · Clinical Gastroenterology and Hepatology · doi:10.1016/j.cgh.2024.02.022 · Cited by 117
Self-citation
Metadata
- Authors
- Harrison, S. A., Ruane, P. J., Freilich, B., Neff, G., Patil, R., Behling, C., Hu, C., Shringarpure, R., de Temple, B., Fong, E., Tillman, E. J., Rolph, T., Cheng, A., & Yale, K.
- Affiliations
- Pinnacle Clinical Research (US)
- Ruane Medical (US)
- Kansas City Research Institute (US)
- University of California San Diego (US)
- Medpace (United States) (US)
- Corresponding author
- Yale, Kitty
- ORCID
- Venue
- JHEP Reports
- Publisher
- Elsevier BV
- Published
- 2023-01
- Volume
- 5
- Issue
- 1
- Pages
- 100563
- ISSN
- 2589-5559 (ISSN-L)
- PMC
- PMC9832280
- OpenAlex
- W4292830211
- Cited by
- 110
- References
- 51
- Citations by year
- 2026: 20 · 2025: 42 · 2024: 35 · 2023: 13
- FWCI
- 16.24
- Type
- journal article
- Language
- en
- Open access
- gold
- doi.org
- Licence
- Locations
- JHEP Reports (publishedVersion, cc-by)
- PubMed Central (publishedVersion, cc-by)
- PubMed (publishedVersion)
- Topics
- Health Sciences › Medicine › Hepatology › Liver Disease Diagnosis and Treatment
- Health Sciences › Medicine › Hepatology › Hepatitis C virus research
- Health Sciences › Medicine › Hepatology › Liver physiology and pathology
- Keywords
- nonalcoholic steatohepatitis, liver fibrosis, fibrosis regression, liver injury biomarkers, PRO-C3, liver stiffness, glycolipid metabolism, alanine aminotransferase, drug safety and tolerability, SGLT2 inhibitors
About these checks
Registry, retraction, Cites and statistics results are computed, not judged, with one exception: a printed reference that no index lists is read once by a model before it counts as a citation error. Claims are extracted by a model and kept only when their quote appears verbatim in the text; each cited source is then checked, with a model’s help, for whether it says what the claim relies on. Those verdicts can be wrong — read the claim’s quote and the cited source before relying on one.
Statistics and arithmetic are recomputed, not judged.
Confidence bands are shown only for fields calibrated on our annotated test set. None is calibrated yet, so no band is shown.
What counts as a claim ›How we measure confidence ›How we check this ›
Are you an author, or do you see a problem with this page? Request a review
