Cited by 129Regulation of Appetite and ObesityDiabetes Treatment and ManagementBiochemical Analysis and Sensing Techniques

The DOI matches its Crossref record; 86 of the 86 references it cites were found in a registry or an index.

Direct and indirect effects of liraglutide on hypothalamic POMC and NPY/AgRP neurons – Implications for energy balance and glucose control

Open access

Abstract

OBJECTIVE: The long-acting glucagon-like peptide-1 receptor (GLP-1R) agonist, liraglutide, stimulates insulin secretion and efficiently suppresses food intake to reduce body weight. As such, liraglutide is growing in popularity in the treatment of diabetes and chronic weight management. Within the brain, liraglutide has been shown to alter the activity of hypothalamic proopiomelanocortin (POMC) and Neuropeptide Y/Agouti-related peptide (NPY/AgRP) neurons. Moreover, the acute activities of POMC and NPY neurons have been directly linked to feeding behavior, body weight, and glucose metabolism. Despite the increased usage of liraglutide and other GLP-1 analogues as diabetic and obesity interventions, the cellular mechanisms by which liraglutide alters the activity of metabolically relevant neuronal populations are poorly understood. METHODS: In order to resolve this issue, we utilized neuron-specific transgenic mouse models to identify POMC and NPY neurons for patch-clamp electrophysiology experiments. RESULTS: receptors and enhanced activity of pre-synaptic GABAergic neurons, which required both TrpC5 subunits and K-ATP channels. In support of an additive role of leptin and liraglutide in suppressing food intake, leptin potentiated the acute effects of liraglutide to activate POMC neurons. TrpC5 subunits in POMC neurons were also required for the intact pharmacological effects of liraglutide on food intake and body weight. Thus, the current study adds to recent work from our group and others, which highlight potential mechanisms to amplify the effects of GLP-1 agonists in vivo. Moreover, these data highlight multiple sites of action (both pre- and post-synaptic) for GLP-1 agonists on this circuit. CONCLUSIONS: Taken together, our results identify critical molecular mechanisms linking GLP-1 analogues in arcuate POMC and NPY/AgRP neurons with metabolism.

Overview

The claims and statistics of this paper haven’t been checked yet.

Run the check — free, no account needed. It reads the open-access text and checks the sources it cites.

A few free checks a day · papers already verified open instantly · results are public

Integrity signals

Registry

Crossref · 10.1016/j.molmet.2019.07.008

Cites

86 of 86 references verified0 citation errors · 0 not checkable

Statistics

Figures

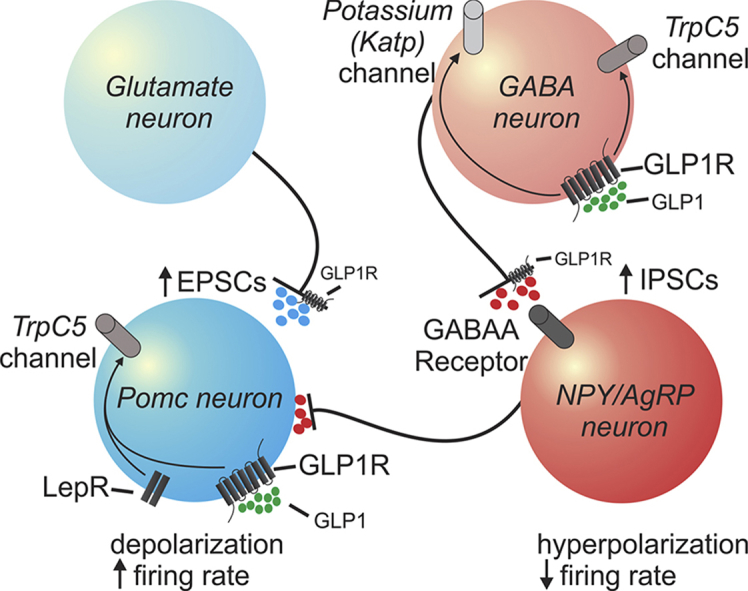
Graphical abstract Graphical abstract Model for direct and indirect effects of GLP-1 and its agonist (liraglutide) on arcuate POMC and NPY/AgRP neurons.
Graphical abstract Graphical abstract Model for direct and indirect effects of GLP-1 and its agonist (liraglutide) on arcuate POMC and NPY/AgRP neurons.CC BY-NC-ND · PubMed Central
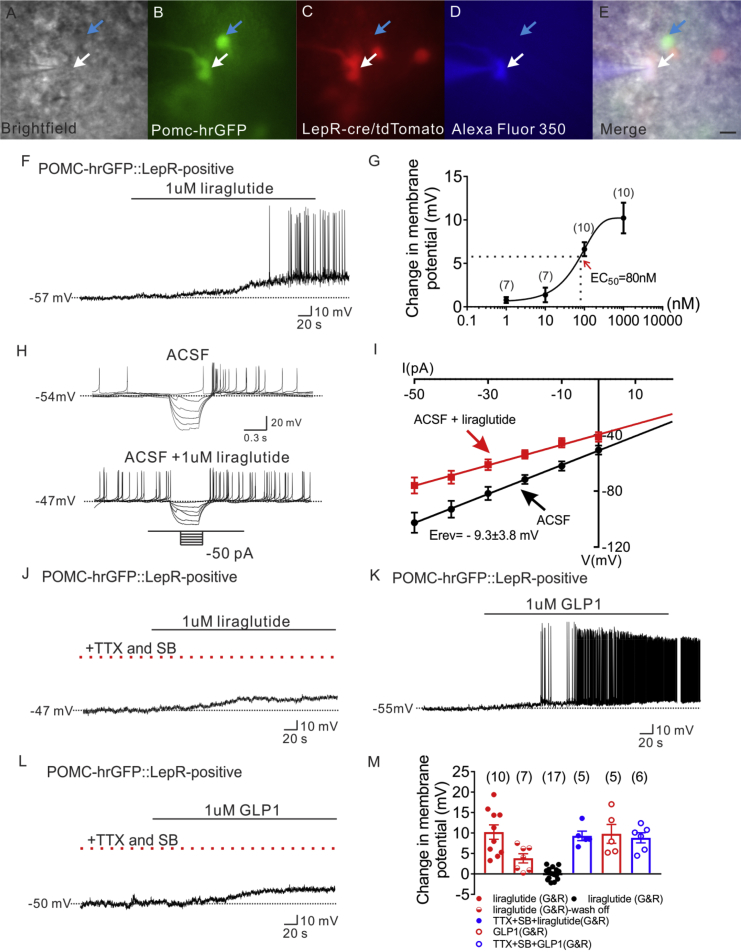
Figure 1 Liraglutide depolarizes LepR expressing POMC neurons in arcuate nucleus of hypothalamus. (A) Brightfield illumination of POMC-hrGFP::Lepr-cre::tdtomato neuron from PLT mice. (B) and (C) The same neuron under FITC (hrGFP) and Alexa Fluor 594 (tdtomato) illumination. (D) Complete dialysis of Alexa Fluor 350 from the intracellular pipette. (E) Merge image illustrates colocalization of hr-GFP, tdtomato, and Alexa Fluor 350 indicative of LepR expressing (white arrows) and non LepR expressing (blue arrows) POMC neurons. (F) Electrophysiological study demonstrates a POMC-hrGFP::Lepr-cre::tdtomato (green/red) neuron that is depolarized in response to liraglutide (1 μM). (G) Dosage response of liraglutide on LepR-expressing POMC neurons. (H) Traces showing decreased voltage deflection and increased action potential frequency after liraglutide application. (I) Current versus voltage (I–V) plot illustrating a characteristic decrease in input resistance subsequent to liraglutide application. Shown are responses before (ACSF) and during liraglutide application. (J) Representative trace showing pretreatment with TTX (2 μM) and synaptic blockers (SB) do not abrogate liraglutide-induced depolarization of LepR-expressing POMC neurons. (K) Representative trace showing that GLP 1 depolarizes LepR-expressing POMC neurons. (L) Representative trace showing that pretreatment with TTX (2 μM) and synaptic blockers do not abrogate liraglutide-induced depolarization of LepR-expressing POMC neurons. (M) Histogram summarizing the acute effect of liraglutide on the membrane potential of POMC neurons which express LepR (G&R: LepR expressing POMC neurons). Data are expressed as mean ± SEM.
Figure 1 Liraglutide depolarizes LepR expressing POMC neurons in arcuate nucleus of hypothalamus. (A) Brightfield illumination of POMC-hrGFP::Lepr-cre::tdtomato neuron from PLT mice. (B) and (C) The same neuron under FITC (hrGFP) and Alexa Fluor 594 (tdtomato) illumination. (D) Complete dialysis of Alexa Fluor 350 from the intracellular pipette. (E) Merge image illustrates colocalization of hr-GFP, tdtomato, and Alexa Fluor 350 indicative of LepR expressing (white arrows) and non LepR expressing (blue arrows) POMC neurons. (F) Electrophysiological study demonstrates a POMC-hrGFP::Lepr-cre::tdtomato (green/red) neuron that is depolarized in response to liraglutide (1 μM). (G) Dosage response of liraglutide on LepR-expressing POMC neurons. (H) Traces showing decreased voltage deflection and increased action potential frequency after liraglutide application. (I) Current versus voltage (I–V) plot illustrating a characteristic decrease in input resistance subsequent to liraglutide application. Shown are responses before (ACSF) and during liraglutide application. (J) Representative trace showing pretreatment with TTX (2 μM) and synaptic blockers (SB) do not abrogate liraglutide-induced depolarization of LepR-expressing POMC neurons. (K) Representative trace showing that GLP 1 depolarizes LepR-expressing POMC neurons. (L) Representative trace showing that pretreatment with TTX (2 μM) and synaptic blockers do not abrogate liraglutide-induced depolarization of LepR-expressing POMC neurons. (M) Histogram summarizing the acute effect of liraglutide on the membrane potential of POMC neurons which express LepR (G&R: LepR expressing POMC neurons). Data are expressed as mean ± SEM.CC BY-NC-ND · PubMed Central
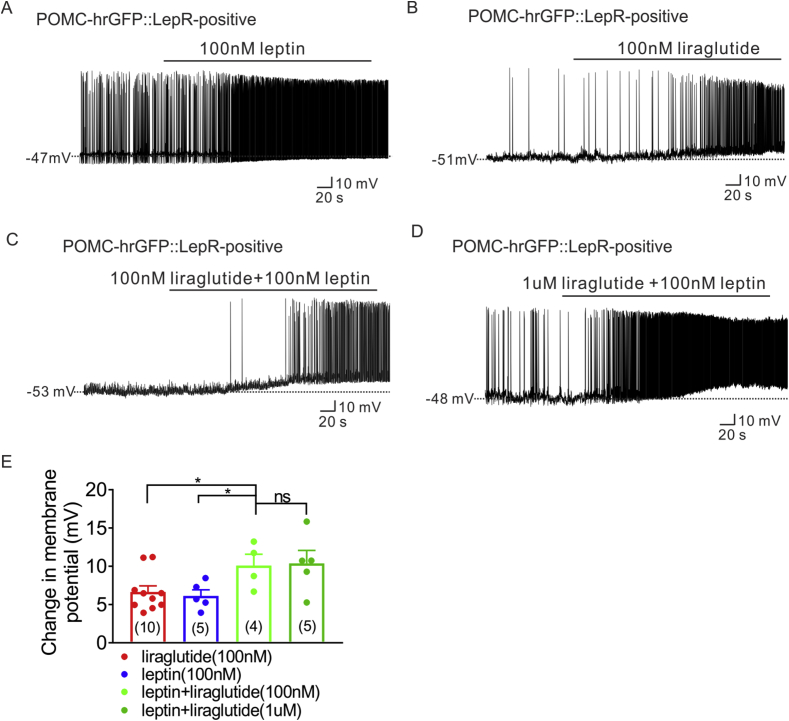
Figure 2 Synergetic effect of liraglutide and leptin on LepR expressing POMC neurons. (A) Current-clamp record depicting the characteristic depolarization of arcuate LepR-expressing POMC neurons by leptin (100 nM). (B) Representative trace showing that low dose of liraglutide (100 nM) depolarizes LepR-expressing POMC neurons. (C) Representative electrophysiological trace demonstrating that additive administration of liraglutide (100 nM) with leptin (100 nM) induced larger depolarized effect of LepR-expressing POMC neurons. (D) Representative trace showing that additive administration of liraglutide (1 μM) with leptin (100 nM) induced depolarization of LepR-expressing POMC neurons. (E) Histogram summarizing the acute effect of liraglutide and leptin on the membrane potential of LepR expressing POMC neurons. Data are expressed as mean ± SEM. *p < 0.05, unpaired t-test was used to compare.
Figure 2 Synergetic effect of liraglutide and leptin on LepR expressing POMC neurons. (A) Current-clamp record depicting the characteristic depolarization of arcuate LepR-expressing POMC neurons by leptin (100 nM). (B) Representative trace showing that low dose of liraglutide (100 nM) depolarizes LepR-expressing POMC neurons. (C) Representative electrophysiological trace demonstrating that additive administration of liraglutide (100 nM) with leptin (100 nM) induced larger depolarized effect of LepR-expressing POMC neurons. (D) Representative trace showing that additive administration of liraglutide (1 μM) with leptin (100 nM) induced depolarization of LepR-expressing POMC neurons. (E) Histogram summarizing the acute effect of liraglutide and leptin on the membrane potential of LepR expressing POMC neurons. Data are expressed as mean ± SEM. *p < 0.05, unpaired t-test was used to compare.CC BY-NC-ND · PubMed Central
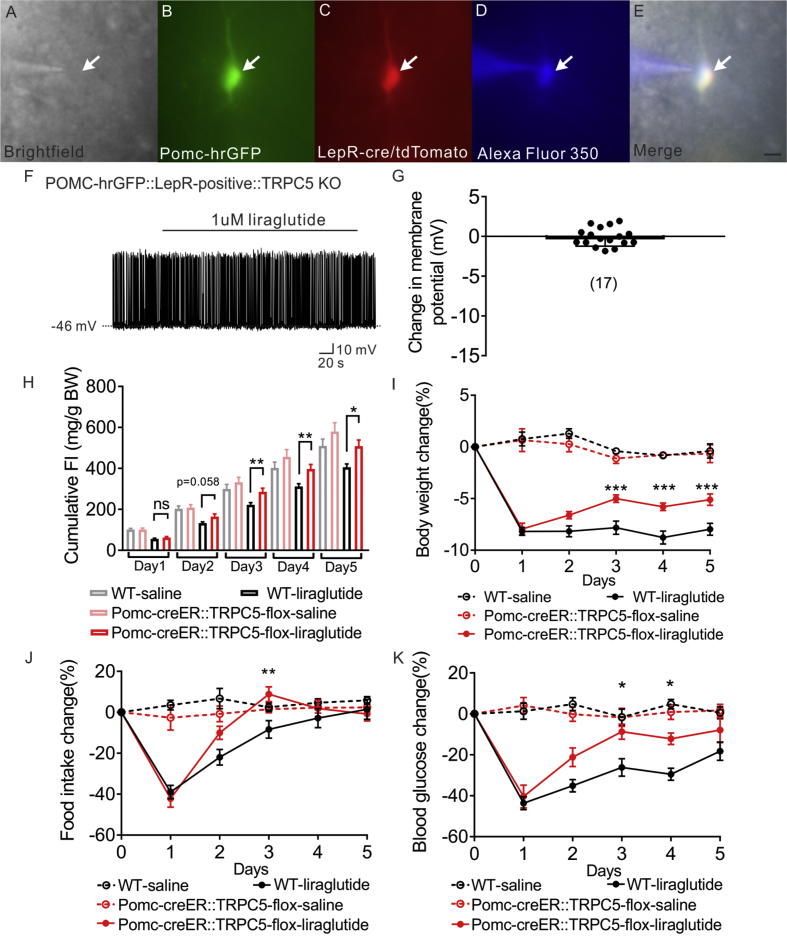
Figure 3 Liraglutide depolarizes LepR expressing POMC neurons via TrpC 5 subunits. (A) Brightfield illumination of POMC-hrGFP::Lepr-cre::tdtomato neuron from POMC-hrGFP::Lepr-cre::tdtomato::TrpC5 KO mice. (B) and (C) The same neuron under FITC (hrGFP) and Alexa Fluor 594 (tdtomato) illumination. (D) Complete dialysis of Alexa Fluor 350 from the intracellular pipette. (E) Merge image illustrates colocalization of hr-GFP, tdtomato, and Alexa Fluor 350 indicative of LepR expressing (white arrows) POMC neurons. (F) Representative trace showing that liraglutide fails to induce a depolarization in a POMC-hrGFP::Lepr-cre::tdtomato::TrpC5 KO (green/red) neuron. (G) Histogram summarizing the acute effect of liraglutide on the membrane potential of LepR expressing POMC neurons which deleted of TrpC5. Data are expressed as mean ± SEM. Plots show the changes in cumulative food intake (H), body weight (I), daily food intake (J), and blood glucose (K) with daily injection of liraglutide on both litter mates control and POMC-creER::TrpC5-flox mice. Data are from male chow-fed mice. Number of mice studied for each group equals or above 5. Unpaired t-test compared to controls. *p < 0.05, **p < 0.01.
Figure 3 Liraglutide depolarizes LepR expressing POMC neurons via TrpC 5 subunits. (A) Brightfield illumination of POMC-hrGFP::Lepr-cre::tdtomato neuron from POMC-hrGFP::Lepr-cre::tdtomato::TrpC5 KO mice. (B) and (C) The same neuron under FITC (hrGFP) and Alexa Fluor 594 (tdtomato) illumination. (D) Complete dialysis of Alexa Fluor 350 from the intracellular pipette. (E) Merge image illustrates colocalization of hr-GFP, tdtomato, and Alexa Fluor 350 indicative of LepR expressing (white arrows) POMC neurons. (F) Representative trace showing that liraglutide fails to induce a depolarization in a POMC-hrGFP::Lepr-cre::tdtomato::TrpC5 KO (green/red) neuron. (G) Histogram summarizing the acute effect of liraglutide on the membrane potential of LepR expressing POMC neurons which deleted of TrpC5. Data are expressed as mean ± SEM. Plots show the changes in cumulative food intake (H), body weight (I), daily food intake (J), and blood glucose (K) with daily injection of liraglutide on both litter mates control and POMC-creER::TrpC5-flox mice. Data are from male chow-fed mice. Number of mice studied for each group equals or above 5. Unpaired t-test compared to controls. *p < 0.05, **p < 0.01.CC BY-NC-ND · PubMed Central
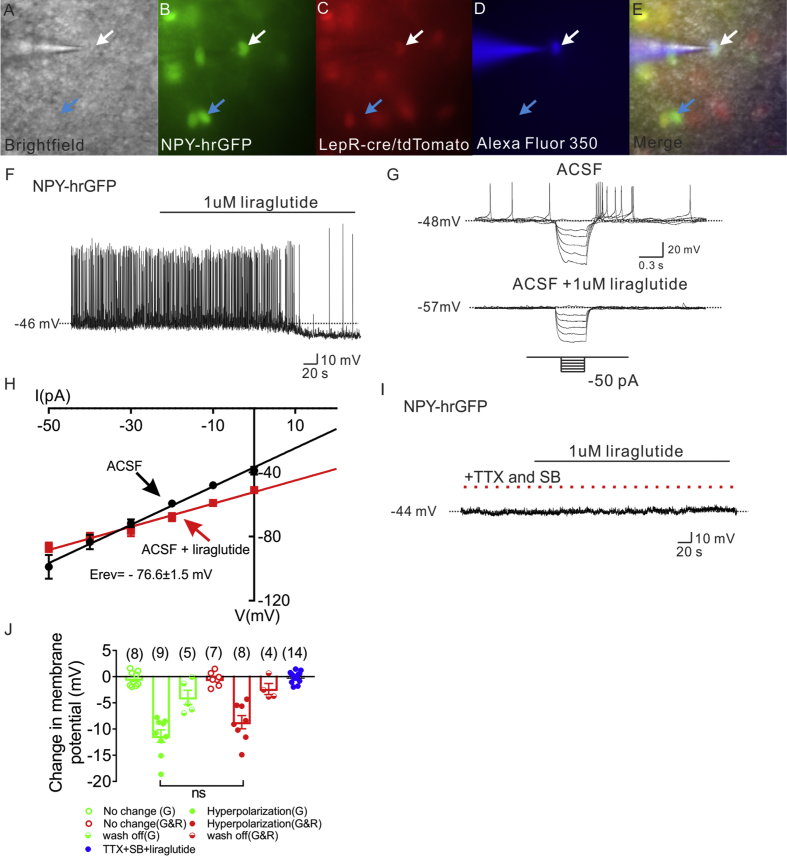
Figure 4 Liraglutide indirectly hyperpolarizes NPY neurons in arcuate nucleus of hypothalamus. (A) Brightfield illumination of NPY-hrGFP::Lepr-cre::tdtomato neuron from NLT mice. (B) and (C) The same neuron under FITC (hrGFP) and Alexa Fluor 594 (tdtomato) illumination. (D) Complete dialysis of Alexa Fluor 350 from the intracellular pipette. (E) Merge image illustrates colocalization of hr-GFP, tdtomato, and Alexa Fluor 350 indicative of LepR expressing (white arrows) and non LepR expressing (blue arrows) NPY neurons. (F) Electrophysiological study demonstrates a NPY-hrGFP neuron that is hyperpolarized in response to liraglutide (1 μM). (G) Traces showing decreased voltage deflection and decreased action potential frequency after liraglutide application. (H) Current versus voltage (I–V) plot illustrating a characteristic decrease in input resistance subsequent to liraglutide application. Shown are responses before (ACSF) and during liraglutide application. (I) Electrophysiological study demonstrates that pretreatment with TTX (2 μM) and synaptic blockers (SB) abrogate liraglutide (1 μM)-induced hyperpolarization of NPY neurons. (J) Histogram summarizing the acute effect of liraglutide (1 μM) on the membrane potential of NPY neurons with or without pretreatment of TTX and synaptic blockers. (G: non LepR expressing NPY neurons. G&R: LepR expressing NPY neurons). Data are expressed as mean ± SEM.
Figure 4 Liraglutide indirectly hyperpolarizes NPY neurons in arcuate nucleus of hypothalamus. (A) Brightfield illumination of NPY-hrGFP::Lepr-cre::tdtomato neuron from NLT mice. (B) and (C) The same neuron under FITC (hrGFP) and Alexa Fluor 594 (tdtomato) illumination. (D) Complete dialysis of Alexa Fluor 350 from the intracellular pipette. (E) Merge image illustrates colocalization of hr-GFP, tdtomato, and Alexa Fluor 350 indicative of LepR expressing (white arrows) and non LepR expressing (blue arrows) NPY neurons. (F) Electrophysiological study demonstrates a NPY-hrGFP neuron that is hyperpolarized in response to liraglutide (1 μM). (G) Traces showing decreased voltage deflection and decreased action potential frequency after liraglutide application. (H) Current versus voltage (I–V) plot illustrating a characteristic decrease in input resistance subsequent to liraglutide application. Shown are responses before (ACSF) and during liraglutide application. (I) Electrophysiological study demonstrates that pretreatment with TTX (2 μM) and synaptic blockers (SB) abrogate liraglutide (1 μM)-induced hyperpolarization of NPY neurons. (J) Histogram summarizing the acute effect of liraglutide (1 μM) on the membrane potential of NPY neurons with or without pretreatment of TTX and synaptic blockers. (G: non LepR expressing NPY neurons. G&R: LepR expressing NPY neurons). Data are expressed as mean ± SEM.CC BY-NC-ND · PubMed Central
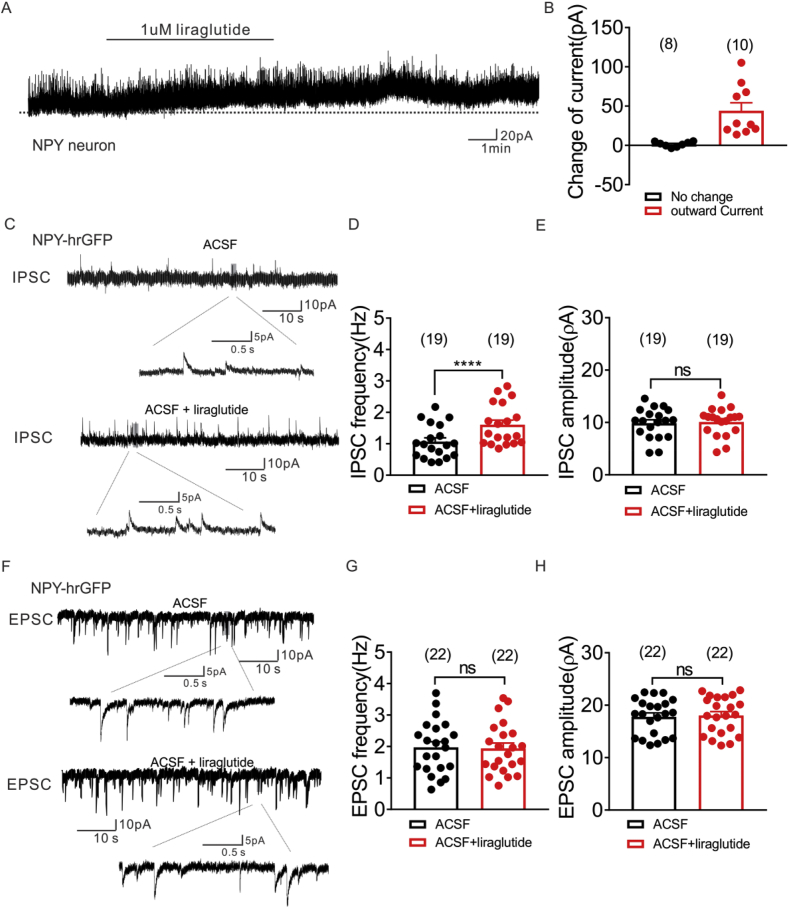
Figure 5 Liraglutide enhances inhibitory synaptic inputs to arcuate NPY neurons, while no effect on excitatory synaptic inputs. (A) Voltage clamp recording demonstrates liraglutide (1 μM) induced outward current on NPY neurons (Vm = −15 mV). (B) Histogram summarizing the acute effect of liraglutide (1 μM) on the currents of NPY neurons (Vm = −15 mV). Data are expressed as mean ± SEM. (C) Voltage clamp recording of spontaneous inhibitory postsynaptic currents (sIPSCs) observed in NPY-hrGFP neuron from NLT mice before (upper) and during (lower) liraglutide administration (Vm = −15 mV). (D&E) Plots indicating increased sIPSC frequency (Hz), but not amplitude (pA) in arcuate NPY neurons with liraglutide (1 μM) administration. (F) Voltage clamp recording of spontaneous excitatory postsynaptic currents (sEPSCs) observed in NPY-hrGFP neuron from NLT mice before (upper) and during (lower) liraglutide administration (Vm = −70 mV). (G&H) Plots indicating no change of both sEPSC frequency (Hz) and amplitude (pA) in arcuate NPY neurons with liraglutide (1 μM) administration (black bar: ACSF; red bar: ACSF + liraglutide). Data are expressed as mean ± SEM. ****p < 0.0001, paired t-test compared to controls.
Figure 5 Liraglutide enhances inhibitory synaptic inputs to arcuate NPY neurons, while no effect on excitatory synaptic inputs. (A) Voltage clamp recording demonstrates liraglutide (1 μM) induced outward current on NPY neurons (Vm = −15 mV). (B) Histogram summarizing the acute effect of liraglutide (1 μM) on the currents of NPY neurons (Vm = −15 mV). Data are expressed as mean ± SEM. (C) Voltage clamp recording of spontaneous inhibitory postsynaptic currents (sIPSCs) observed in NPY-hrGFP neuron from NLT mice before (upper) and during (lower) liraglutide administration (Vm = −15 mV). (D&E) Plots indicating increased sIPSC frequency (Hz), but not amplitude (pA) in arcuate NPY neurons with liraglutide (1 μM) administration. (F) Voltage clamp recording of spontaneous excitatory postsynaptic currents (sEPSCs) observed in NPY-hrGFP neuron from NLT mice before (upper) and during (lower) liraglutide administration (Vm = −70 mV). (G&H) Plots indicating no change of both sEPSC frequency (Hz) and amplitude (pA) in arcuate NPY neurons with liraglutide (1 μM) administration (black bar: ACSF; red bar: ACSF + liraglutide). Data are expressed as mean ± SEM. ****p < 0.0001, paired t-test compared to controls.CC BY-NC-ND · PubMed Central
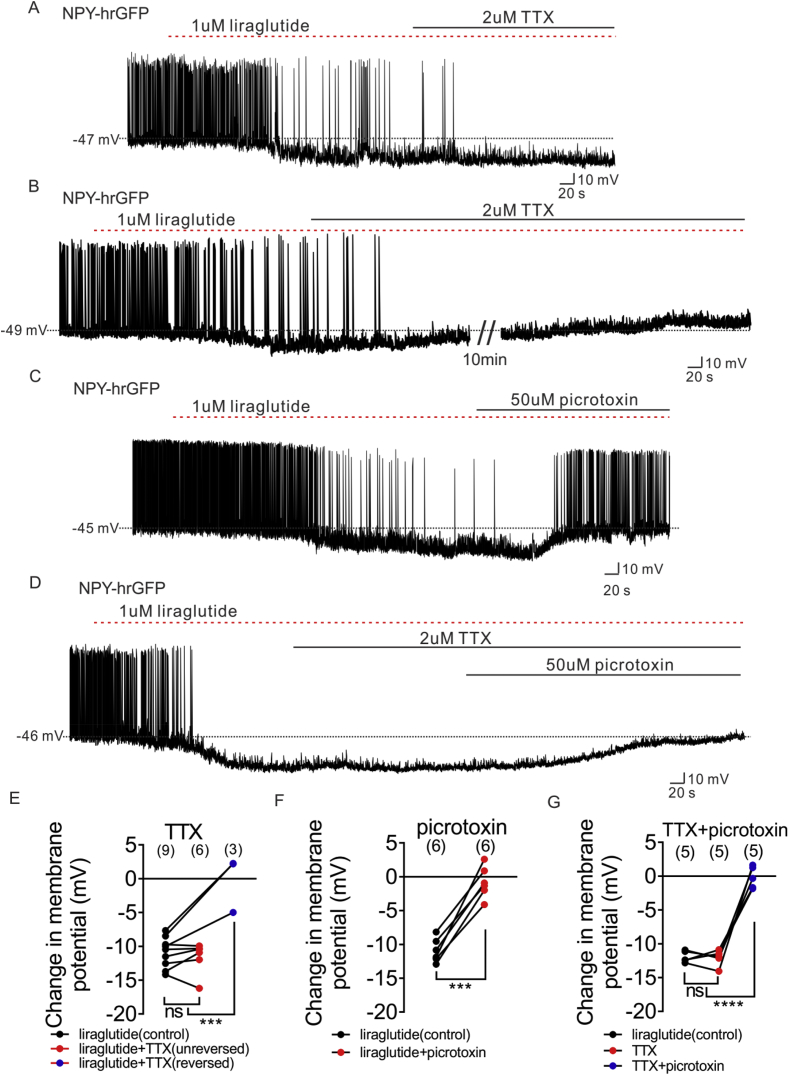
Figure 6 Liraglutide hyperpolarizes NPY neurons via both pre-synaptic GLP1 receptor and post-synaptic GABAA receptor. (A) Representative trace showing that TTX (2 μM) does not prevent the liraglutide (1 μM)-induced hyperpolarization of NPY neurons. (B) Representative trace showing that TTX (2 μM) blocked the liraglutide (1 μM)-induced hyperpolarization of NPY neurons. (C) Representative trace showing that picrotoxin (50 μM) reversed the liraglutide (1 μM)-induced hyperpolarization of NPY neurons. (D) Representative trace showing that picrotoxin (50 μM) reversed the liraglutide (1 μM)-induced hyperpolarization of NPY neurons in which TTX (2 μM) does not blocked the liraglutide-induced effect. (E) Histogram summarizing the acute effect of liraglutide and followed by TTX (2 μM) administration on the membrane potential of arcuate NPY neurons (black: liraglutide, red: TTX does not block the liraglutide-induced effect, blue: TTX blocked the liraglutide-induced effect). (F) Histogram summarizing the acute effect of liraglutide and followed by picrotoxin (50 μM) administration on the membrane potential of arcuate NPY neurons (black: liraglutide, red: picrotoxin reversed the liraglutide effect). (G) Histogram summarizing the acute effect of liraglutide and followed by picrotoxin (50 μM) administration on the membrane potential of arcuate NPY neurons, in which TTX (2 μM) does not block the liraglutide-induced effect. Data are expressed as mean ± SEM. ***p < 0.001, ****p < 0.0001, unpaired & paired t-test were used to compare the significance.
Figure 6 Liraglutide hyperpolarizes NPY neurons via both pre-synaptic GLP1 receptor and post-synaptic GABAA receptor. (A) Representative trace showing that TTX (2 μM) does not prevent the liraglutide (1 μM)-induced hyperpolarization of NPY neurons. (B) Representative trace showing that TTX (2 μM) blocked the liraglutide (1 μM)-induced hyperpolarization of NPY neurons. (C) Representative trace showing that picrotoxin (50 μM) reversed the liraglutide (1 μM)-induced hyperpolarization of NPY neurons. (D) Representative trace showing that picrotoxin (50 μM) reversed the liraglutide (1 μM)-induced hyperpolarization of NPY neurons in which TTX (2 μM) does not blocked the liraglutide-induced effect. (E) Histogram summarizing the acute effect of liraglutide and followed by TTX (2 μM) administration on the membrane potential of arcuate NPY neurons (black: liraglutide, red: TTX does not block the liraglutide-induced effect, blue: TTX blocked the liraglutide-induced effect). (F) Histogram summarizing the acute effect of liraglutide and followed by picrotoxin (50 μM) administration on the membrane potential of arcuate NPY neurons (black: liraglutide, red: picrotoxin reversed the liraglutide effect). (G) Histogram summarizing the acute effect of liraglutide and followed by picrotoxin (50 μM) administration on the membrane potential of arcuate NPY neurons, in which TTX (2 μM) does not block the liraglutide-induced effect. Data are expressed as mean ± SEM. ***p < 0.001, ****p < 0.0001, unpaired & paired t-test were used to compare the significance.CC BY-NC-ND · PubMed Central
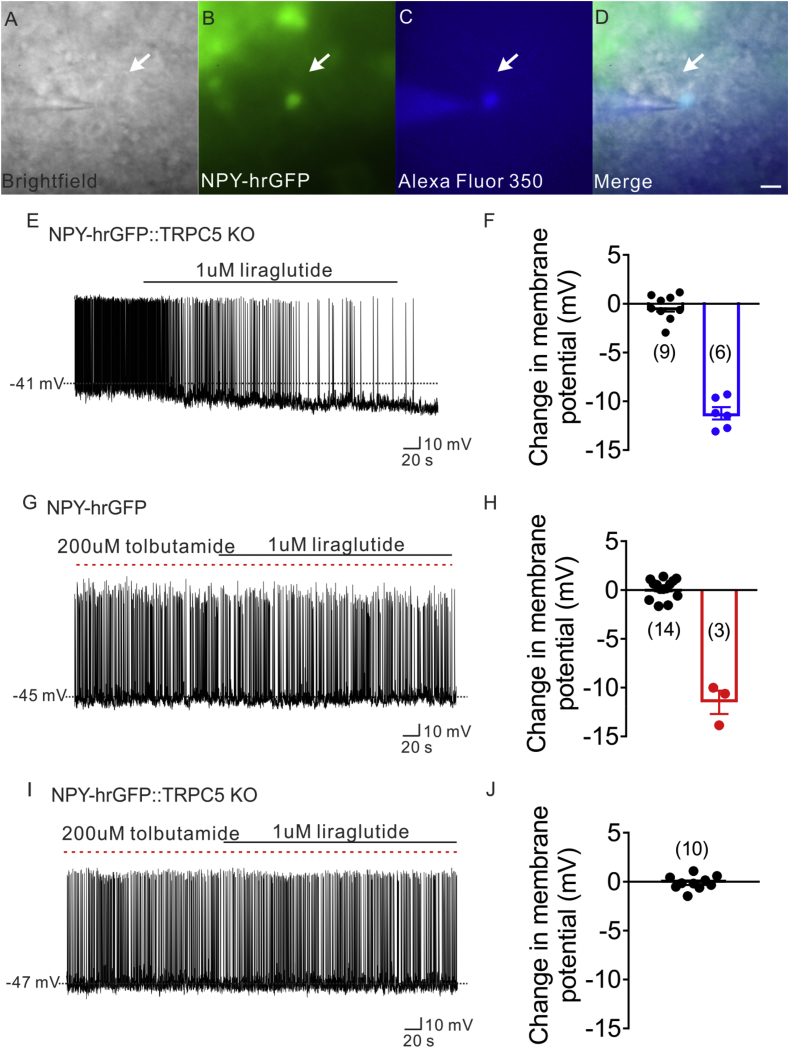
Figure 7 ATP-sensitive potassium channel (K-ATP) and TrpC 5 subunits were involved in liraglutide effect. (A) Brightfield illumination of NPY-hrGFP neuron from NLT::TRPC5 KO mice. (B) The same neuron under FITC (hrGFP) illumination. (C) Complete dialysis of Alexa Fluor 350 from the intracellular pipette. (D) Merge image illustrates colocalization of hr-GFP and Alexa Fluor 350 indicative of NPY neuron which was deleted of TRPC5. (E) Electrophysiological study demonstrates a TRPC5 deleted NPY-hrGFP neuron that is hyperpolarized in response to liraglutide (1 μM). (F) Histogram summarizing the acute effect of liraglutide (1 μM) on the membrane potential of TRPC5 deleted NPY neurons. (G) Electrophysiological study demonstrates that liraglutide fails to hyperpolarize NPY-hrGFP neuron with the pretreatment of tolbutamide(200 μM). (H) Histogram summarizing the acute effect of liraglutide (1 μM) on the membrane potential of NPY neurons, with the pretreatment of tolbutamide(200 μM). (I) Representative trace showing that liraglutide fails to hyperpolarize NPY-hrGFP neuron from NLT:TrpC5 KO mice with the pretreatment of tolbutamide (200 μM). (J) Histogram summarizing the acute effect of liraglutide (1 μM) on the membrane potential of NPY neurons from NLT:TrpC5 KO mice, with the pretreatment of tolbutamide (200 μM). Data are expressed as mean ± SEM.
Figure 7 ATP-sensitive potassium channel (K-ATP) and TrpC 5 subunits were involved in liraglutide effect. (A) Brightfield illumination of NPY-hrGFP neuron from NLT::TRPC5 KO mice. (B) The same neuron under FITC (hrGFP) illumination. (C) Complete dialysis of Alexa Fluor 350 from the intracellular pipette. (D) Merge image illustrates colocalization of hr-GFP and Alexa Fluor 350 indicative of NPY neuron which was deleted of TRPC5. (E) Electrophysiological study demonstrates a TRPC5 deleted NPY-hrGFP neuron that is hyperpolarized in response to liraglutide (1 μM). (F) Histogram summarizing the acute effect of liraglutide (1 μM) on the membrane potential of TRPC5 deleted NPY neurons. (G) Electrophysiological study demonstrates that liraglutide fails to hyperpolarize NPY-hrGFP neuron with the pretreatment of tolbutamide(200 μM). (H) Histogram summarizing the acute effect of liraglutide (1 μM) on the membrane potential of NPY neurons, with the pretreatment of tolbutamide(200 μM). (I) Representative trace showing that liraglutide fails to hyperpolarize NPY-hrGFP neuron from NLT:TrpC5 KO mice with the pretreatment of tolbutamide (200 μM). (J) Histogram summarizing the acute effect of liraglutide (1 μM) on the membrane potential of NPY neurons from NLT:TrpC5 KO mice, with the pretreatment of tolbutamide (200 μM). Data are expressed as mean ± SEM.CC BY-NC-ND · PubMed Central

Verification

Claims the paper makes

The claims and statistics of this paper haven’t been checked yet.

Run the check — free, no account needed. It reads the open-access text and checks the sources it cites.

A few free checks a day · papers already verified open instantly · results are public

Claims other papers make about this one

Each is checked against this paper’s own text: does it say what the citing paper says it does?

Self-check

Percentages, sums and reported differences re-computed from the paper’s own numbers.

The self-check needs the paper’s full text.

Citations

Cites

Show all 86 references

Cited by

Sorted by citations

See all 129

Metadata

Authors
He, Z., Gao, Y., Lieu, L., Afrin, S., Cao, J., Michael, N. J., Dong, Y., Sun, J., Guo, H., & Williams, K. W.
Affiliations
  • Zhujiang Hospital (CN)
  • Chinese Academy of Medical Sciences & Peking Union Medical College (CN)
  • The University of Texas Southwestern Medical Center (US)
  • Guangzhou University of Chinese Medicine (CN)
Corresponding author
  • Guo, Hongbo
  • Williams, Kevin W.
Venue
Molecular Metabolism
Publisher
Elsevier BV
Published
2019-10
Volume
28
Pages
120-134
ISSN
2212-8778 (ISSN-L)
OpenAlex
W2965632554
Cited by
128
References
86
Citations by year
2026: 17 · 2025: 28 · 2024: 26 · 2023: 18 · 2022: 16 · 2021: 17 · 2020: 6
FWCI
5.38
Type
journal article
Language
en
Open access
Locations
  • Molecular Metabolism (publishedVersion, cc-by-nc-nd)
  • Europe PMC (PubMed Central) (publishedVersion, cc-by-nc-nd)
  • PubMed Central (publishedVersion, cc-by-nc-nd)
  • PubMed (publishedVersion)
  • DOAJ (DOAJ: Directory of Open Access Journals) (submittedVersion)
Funders
Guangdong Provincial Clinical Medical Centre for Neurosurgery (2013B020400005)
Topics
  • Life Sciences › Neuroscience › Endocrine and Autonomic Systems › Regulation of Appetite and Obesity
  • Health Sciences › Medicine › Endocrinology, Diabetes and Metabolism › Diabetes Treatment and Management
  • Health Sciences › Nursing › Nutrition and Dietetics › Biochemical Analysis and Sensing Techniques
Keywords
liraglutide, GLP-1 receptor agonists, POMC neurons, NPY/AgRP neurons, hypothalamus, arcuate nucleus, dietary intake, body weight, leptin, ATP-sensitive potassium channels, GABAergic neurons, energy balance, glucose metabolism, obesity, diabetes mellitus
MeSH terms
Liraglutide, Animals, Blood Glucose, Energy Metabolism, Hypoglycemic Agents, Hypothalamus, Male, Mice, Transgenic, Neurons, Neuropeptide Y, Pro-Opiomelanocortin, Mice, Agouti-Related Protein

About these checks

Registry, retraction, Cites and statistics results are computed, not judged, with one exception: a printed reference that no index lists is read once by a model before it counts as a citation error. Claims are extracted by a model and kept only when their quote appears verbatim in the text; each cited source is then checked, with a model’s help, for whether it says what the claim relies on. Those verdicts can be wrong — read the claim’s quote and the cited source before relying on one.

Statistics and arithmetic are recomputed, not judged.

Confidence bands are shown only for fields calibrated on our annotated test set. None is calibrated yet, so no band is shown.

What counts as a claim ›How we measure confidence ›How we check this ›

Are you an author, or do you see a problem with this page? Request a review