

The DOI matches its Crossref record; 28 of the 28 references it cites were found in a registry or an index.
Development of a tool for measuring uncertainty of acute cytotoxicity results using the methodology of OECD Guidance Document 129
Abstract
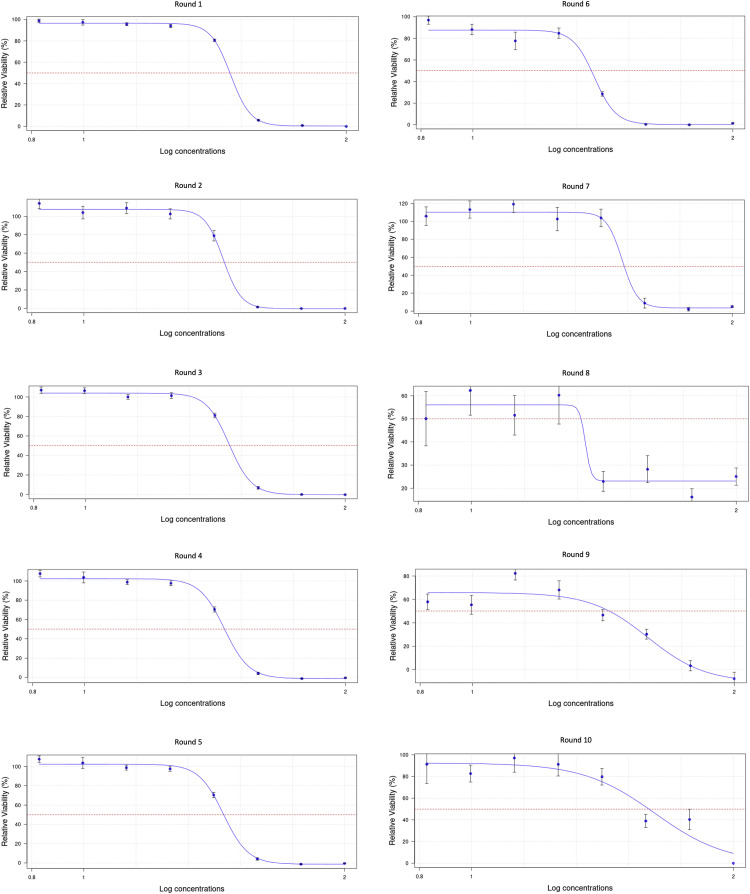
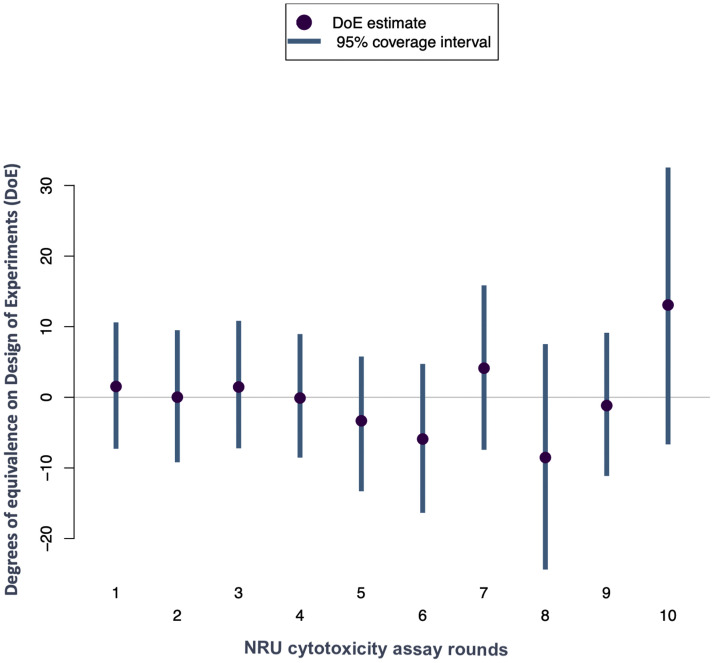
Despite the use of strict acceptance criteria in validated methods for in vitro toxicology safety non-animal methods, the evaluation of statistical uncertainties in the results and their impact on the reproducibility and reliability of these methods is limited. Technical and operational variations in intra- and inter-laboratory settings can interfere with the results, and measurement uncertainty estimations are crucial for a better understanding of the potential sources of errors and ensuring that the assays are under control. The measurement uncertainty characterizes the dispersion of values, which can be attributed to the measurement results. This study applied the Monte Carlo statistical model to calculate the measurement uncertainty for the half-maximal inhibitory concentration (IC50) of sodium dodecyl sulfate (SDS) using OECD Guidance Document 129. We focused on acute oral cytotoxicity in vitro and developed a specific tool for this purpose. The Monte Carlo method enabled the identification of the contributions to the measurement uncertainty of IC50 and their confidence intervals for the in vitro cytotoxicity assay recommended by OECD GD 129. Furthermore, the statistical tool developed in this study, although specifically applied to OECD GD 129, has the potential to be adapted and extended to other in vitro toxicological assays based on dose-response curves, thus supporting broader applications in New Approach Methodologies (NAMs) by enhancing reproducibility and confidence in alternative methods validation processes. In conclusion, this study demonstrates the effectiveness of the Monte Carlo statistical model in quantifying the measurement uncertainty of sodium dodecyl sulfate (SDS) IC50 values, with a comprehensive analysis yielding a combined IC50 of 34.6 μg/mL with a combined uncertainty of 1.21 μg/mL. These findings highlight the importance of incorporating metrological evaluations to increase the reliability of in vitro methods. By enabling more informed decision-making, this study can significantly contribute to the advancement of toxicological research and NAMs.
Overview
The claims and statistics of this paper haven’t been checked yet.
Run the check — free, no account needed. It reads the open-access text and checks the sources it cites.
Integrity signals
Registry
Cites
Statistics
Figures
Verification
Claims the paper makes
The claims and statistics of this paper haven’t been checked yet.
Run the check — free, no account needed. It reads the open-access text and checks the sources it cites.
Claims other papers make about this one
Each is checked against this paper’s own text: does it say what the citing paper says it does?
The source backs part of the claim, not all of it — or backs it for a different population, condition or comparison.
In the citing paper
“Independent evaluations and modelling approaches have shown that uncertainty in IC50 estimates in vitro cytotoxicity tests propagates into uncertainty in predicted acute toxicity values in vivo (Schrage et al., 2011; Neves L de et al., 2025).”
From Cytotoxicity across OECD methods is not a single endpoint: context-dependent roles, variability and implications for decision-making (2026) · cites this paper as Neves L de et al., 2025
Experimental — accuracy not yet measured
Self-check
Percentages, sums and reported differences re-computed from the paper’s own numbers.
The self-check needs the paper’s full text.
Citations
Cites
International Organization for Standardization
(2011) · SpringerReference · doi:10.1007/springerreference_16847 · Cited by 12,534
Dose-Response Analysis Using R
Ritz, C., Baty, F., Streibig, J. C., & Gerhard, D. (2015) · PLoS ONE · doi:10.1371/journal.pone.0146021 · Cited by 3,833
dplyr: A Grammar of Data Manipulation
Wickham, H., François, R., Henry, L., Müller, K., & Vaughan, D. (2014) · doi:10.32614/cran.package.dplyr · Cited by 3,612
shiny: Web Application Framework for R
Chang, W., Cheng, J. Z., Allaire, J., Sievert, C., Schloerke, B., Aden-Buie, G., Xie, Y., Allen, J., McPherson, J., Dipert, A., et al. (2012) · doi:10.32614/cran.package.shiny · Cited by 849
Toxicology for the twenty-first century
Härtung, T. (2009) · Nature · doi:10.1038/460208a · Cited by 686
Kwon, Y., Won, J.-H., Kim, B. J., & Paik, M. C. (2020) · Computational Statistics & Data Analysis · doi:10.1016/j.csda.2019.106816 · Cited by 424
Ethical and Scientific Considerations Regarding Animal Testing and Research
Ferdowsian, H. R., & Beck, N. B. (2011) · PLoS ONE · doi:10.1371/journal.pone.0024059 · Cited by 181
R Markdown: The Definitive Guide
Xie, Y., Allaire, J., & Grolemund, G. (2018) · Cited by 181
Evaluation of Measurement Data: The Role of Measurement Uncertainty in Conformity Assessment
Hibbert, B. D. B. (2013) · Chemistry International · doi:10.1515/ci.2013.35.2.22 · Cited by 119
The National Institute for Standards and Technology
Erbschloe, M. (2017) · Auerbach Publications eBooks · doi:10.1201/9781315167558-3 · Cited by 104
Research works printed but not linked: 6
- 2010, Directive 2010/63 on the protection of animals used for scientific purposes, Official J. European Union, 47
- 2006, ICCVAM-recommended test method protocol BALB/c 3T3 NRU cytotoxicity test method, ICCVAM Test Method Eval Rep Vitr Cytotox Test Methods Estim Start Doses Acute Oral Syst Toxic Tests
- 2012, International vocabulary of metrology – Basic and general concepts and associated terms (VIM), Tetrahedron Lett.
- JCGM/WG. Evaluation of measurement data. Vol. 50, GUM - guide to the expression of uncertainty in measurement. 2008.
- 2014, Series on Testing and Assessment No. 129. GUIDANCE DOCUMENT ON USING CYTOTOXICITY TESTS TO ESTIMATE STARTING DOSES FOR ACUTE ORAL SYSTEMIC TOXICITY TESTS, ENV/JM/MONO(2010), 20, 54
- Valadares, 2006, Avaliação de toxicidade Aguda: estratégias após a “era do Teste dl 50, Rev Eletrônica Farmácia, 3, 93
Cited by
Thoma, T., Löhr, L., Demuth, P., Hambruch, N., Oesch, F., & Landsiedel, R. (2026) · NAM Journal · doi:10.1016/j.namjnl.2026.100126
Metadata
- Authors
- Neves, L. D. O., Garrido, B. C., Granjeiro, J. M., & Balottin, L. B. L.
- Venue
- NAM Journal
- Publisher
- Elsevier BV
- Published
- 2025
- Volume
- 1
- Pages
- 100021
- ISSN
- 3050-6204
- PMC
- PMC13396913
- Cited by
- 1
- References
- 28
- Language
- en
- Licence
- www.elsevier.com/tdm/userlicense/1.0/ (tdm)
- www.elsevier.com/legal/tdmrep-license (tdm)
- creativecommons.org/licenses/by/4.0/ (vor, 101 d)
- Funders
- Coordination of Higher Education Personnel Improvement
- National Council for Scientific and Technological Development (465656/2014-5, 400030/2018-7)
- Instituto Nacional de Ciência e Tecnologia em Medicina Regenerativa
- Ministry of Science Technology and Innovations (404149/2020-0)
- Carlos Chagas Filho Foundation for Research Support of Rio de Janeiro State (E-26/10.000981/2019)
About these checks
Registry, retraction, Cites and statistics results are computed, not judged, with one exception: a printed reference that no index lists is read once by a model before it counts as a citation error. Claims are extracted by a model and kept only when their quote appears verbatim in the text; each cited source is then checked, with a model’s help, for whether it says what the claim relies on. Those verdicts can be wrong — read the claim’s quote and the cited source before relying on one.
Statistics and arithmetic are recomputed, not judged.
Confidence bands are shown only for fields calibrated on our annotated test set. None is calibrated yet, so no band is shown.
What counts as a claim ›How we measure confidence ›How we check this ›
Are you an author, or do you see a problem with this page? Request a review
How to cite
Cite CoChat for the checks on this page, and the paper for its own findings.
- This page
- CoChat. (2026). Citation check: Development of a tool for measuring uncertainty of acute cytotoxicity results using the methodology of OECD Guidance Document 129. https://app.cochat.ai/papers/10.1016/j.namjnl.2025.100021
- The paper
- Neves, L. D. O., Garrido, B. C., Granjeiro, J. M., & Balottin, L. B. L. (2025). Development of a tool for measuring uncertainty of acute cytotoxicity results using the methodology of OECD Guidance Document 129. NAM Journal. https://doi.org/10.1016/j.namjnl.2025.100021
Data sources
Bibliographic data: Semantic Scholar, OpenAlex, Crossref.
Contains information from the Semantic Scholar Academic Graph Datasets, made available under the ODC Attribution License (ODC-BY 1.0).
Semantic Scholar’s data is described in: Kinney, R., et al. (2023). The Semantic Scholar Open Data Platform. arXiv:2301.10140.
