

The DOI matches its Crossref record; 85 of the 85 references it cites were found in a registry or an index.
Local and distant relationships between amyloid, tau and neurodegeneration in Alzheimer's Disease
Open accessAbstract
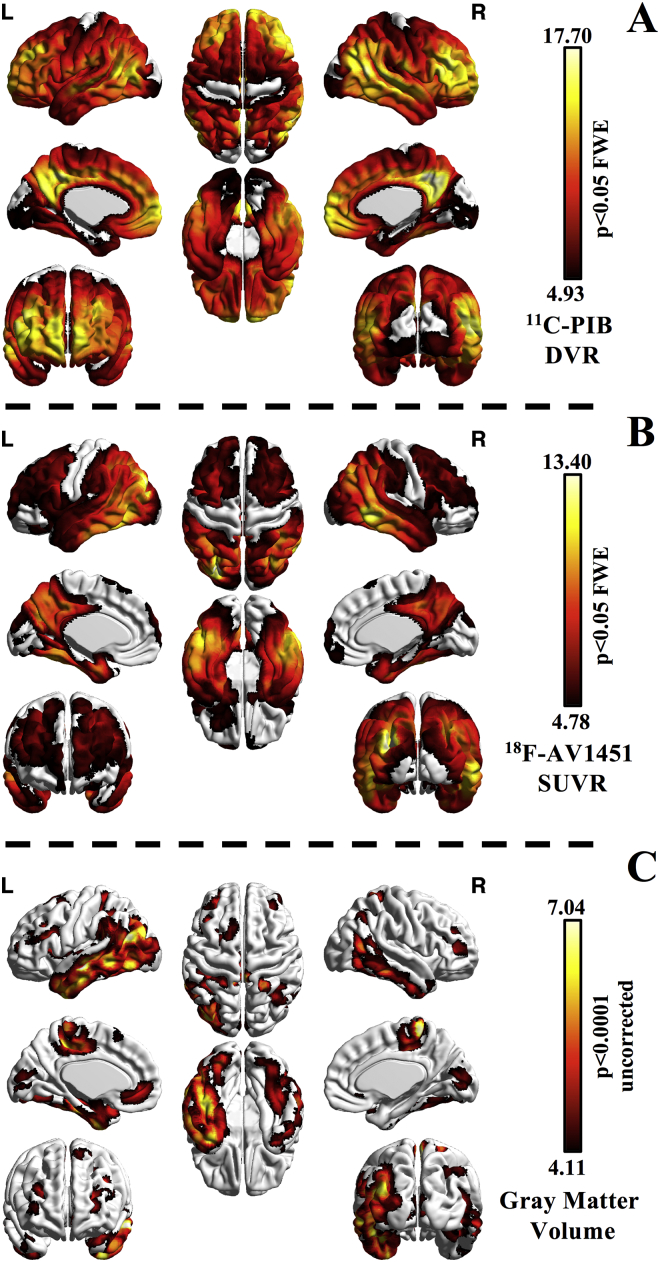
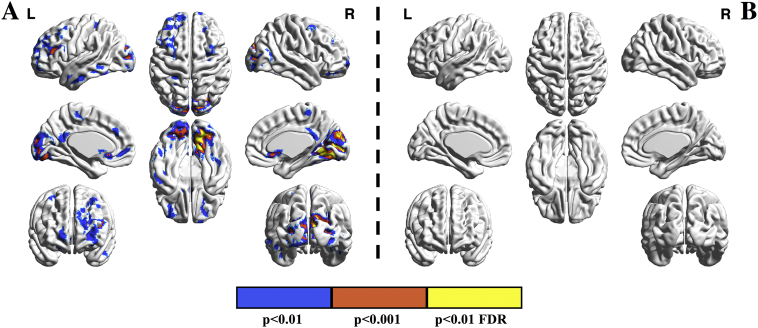
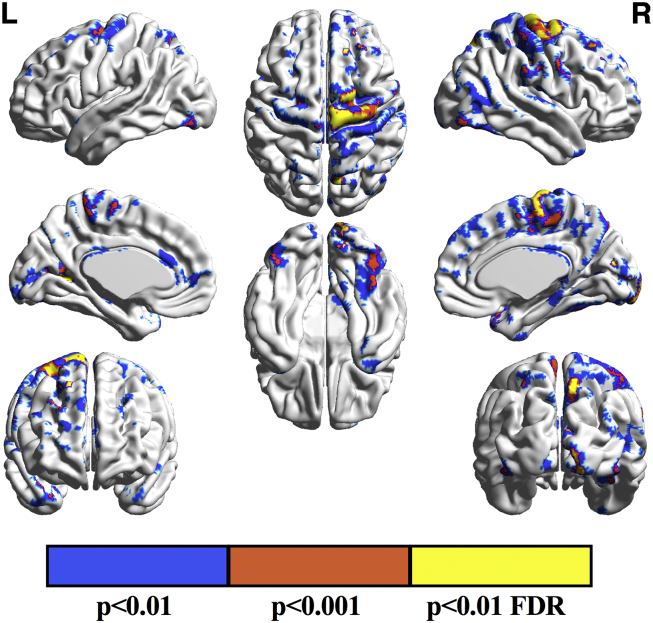
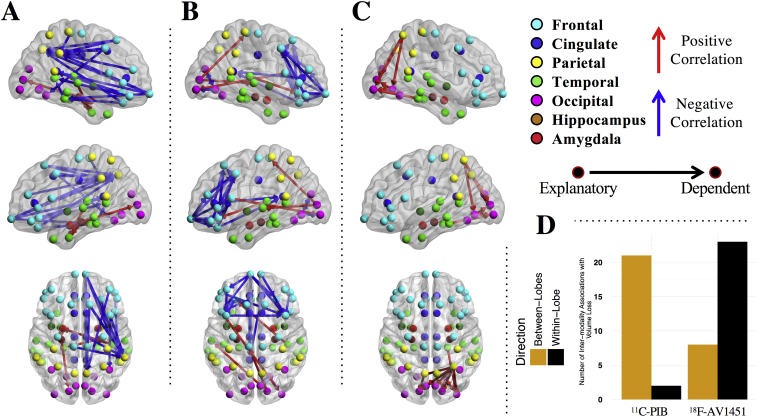
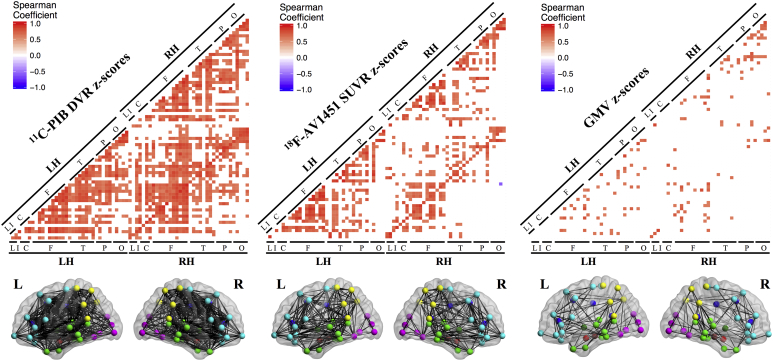
The relationships between β-amyloid (Aβ), tau and neurodegeneration within Alzheimer's Disease pathogenesis are not fully understood. To explore these associations in vivo, we evaluated 30 Aβ PET-positive patients (mean ± sd age 62.4 ± 8.3) with mild probable AD and 12 Aβ PET-negative healthy controls (HC) (mean ± sd age 77.3 ± 6.9) as comparison. All participants underwent 3 T MRI, 11C-PiB (Aβ) PET and 18F-AV1451 (tau) PET. Multimodal correlation analyses were run at both voxel- and region-of-interest levels. 11C-PiB retention in AD showed the most diffuse uptake pattern throughout association neocortex, whereas 18F-AV1451 and gray matter volume reduction (GMR) showed a progressive predilection for posterior cortices (p<0.05 Family-Wise Error-[FWE]-corrected). Voxel-level analysis identified negative correlations between 18F-AV1451 and gray matter peaking in medial and infero-occipital regions (p<0.01 False Discovery Rate-[FDR]-corrected). 18F-AV1451 and 11C-PiB were positively correlated in right parietal and medial/inferior occipital regions (p<0.001 uncorrected). 11C-PiB did not correlate with GMR at the voxel-level. Regionally, 18F-AV1451 was largely associated with local/adjacent GMR whereas frontal 11C-PiB correlated with GMR in posterior regions. These findings suggest that, in mild AD, tau aggregation drives local neurodegeneration, whereas the relationships between Aβ and neurodegeneration are not region specific and may be mediated by the interaction between Aβ and tau.
Overview
The claims and statistics of this paper haven’t been checked yet.
Run the check — free, no account needed. It reads the open-access text and checks the sources it cites.
Integrity signals
Registry
Cites
Statistics
Figures
Verification
Claims the paper makes
The claims and statistics of this paper haven’t been checked yet.
Run the check — free, no account needed. It reads the open-access text and checks the sources it cites.
Claims other papers make about this one
Each is checked against this paper’s own text: does it say what the citing paper says it does?
The cited source says what the claim attributes to it.
In the citing paper
“The occurrence of NFTs correlates well with spatial patterns of neuronal loss and is related to the degree of cognitive deficits [3,4].”
From Diffusion tensor imaging reveals whole-brain microstructural changes in the P301L mouse model of tauopathy. (2020) · cites this paper as [3]
Self-check
Percentages, sums and reported differences re-computed from the paper’s own numbers.
The self-check needs the paper’s full text.
Citations
Cites
McKhann, G. M., Knopman, D. S., Chertkow, H., Hyman, B. T., Jack, C. R., Kawas, C. H., Klunk, W. E., Koroshetz, W. J., Manly, J. J., Mayeux, R., et al. (2011) · Alzheimer's & Dementia · doi:10.1016/j.jalz.2011.03.005 · Cited by 18,657
Neuropathological stageing of Alzheimer-related changes.
Braak, H., & Braak, E. (1991) · Acta Neuropathologica · doi:10.1007/bf00308809 · Cited by 16,123
Desikan, R. S., Ségonne, F., Fischl, B., Quinn, B. T., Dickerson, B. C., Blacker, D., Buckner, R. L., Dale, A. M., Maguire, R. P., Hyman, B. T., et al. (2006) · NeuroImage · doi:10.1016/j.neuroimage.2006.01.021 · Cited by 13,324
Alzheimer's disease: the amyloid cascade hypothesis
Hardy, J. A., & Higgins, G. A. (1992) · Science · doi:10.1126/science.1566067 · Cited by 7,484
Classification of primary progressive aphasia and its variants
Gorno-Tempini, M. L., Hillis, A. E., Weintraub, S., Kertesz, A., Mendez, M., Cappa, S. F., Ogar, J. M., Rohrer, J. D., Black, S., Boeve, B. F., et al. (2011) · Neurology · doi:10.1212/wnl.0b013e31821103e6 · Cited by 5,141
Self-citationQuerfurth, H. W., & LaFerla, F. M. (2010) · New England Journal of Medicine · doi:10.1056/nejmra0909142 · Cited by 4,569
Jack, C. R., Knopman, D. S., Jagust, W. J., Petersen, R. C., Weiner, M. W., Aisen, P. S., Shaw, L. M., Vemuri, P., Wiste, H. J., Weigand, S. D., et al. (2013) · The Lancet Neurology · doi:10.1016/s1474-4422(12)70291-0 · Cited by 4,396
Self-citationBrainNet Viewer: A Network Visualization Tool for Human Brain Connectomics
Xia, M., Wang, J., & He, Y. (2013) · PLoS ONE · doi:10.1371/journal.pone.0068910 · Cited by 4,106
Advancing research diagnostic criteria for Alzheimer's disease: the IWG-2 criteria
Dubois, B., Feldman, H. H., Jacova, C., Hampel, H., Molinuevo, J. L., Blennow, K., DeKosky, S. T., Gauthier, S., Selkoe, D., Bateman, R., et al. (2014) · The Lancet Neurology · doi:10.1016/s1474-4422(14)70090-0 · Cited by 3,321
Self-citationBraak, H., Alafuzoff, I., Arzberger, T., Kretzschmar, H., & Del Tredici, K. (2006) · Acta Neuropathologica · doi:10.1007/s00401-006-0127-z · Cited by 3,172
Cited by
Sorted by citations
Microglia in Neurological Diseases: A Road Map to Brain-Disease Dependent-Inflammatory Response
Bachiller, S., Jiménez-Ferrer, I., Paulus, A., Yang, Y., Swanberg, M., Deierborg, T., & Boza‐Serrano, A. (2018) · Frontiers in Cellular Neuroscience · doi:10.3389/fncel.2018.00488 · Cited by 750
Imaging the evolution and pathophysiology of Alzheimer disease
Jagust, W. (2018) · Nature Reviews Neuroscience · doi:10.1038/s41583-018-0067-3 · Cited by 604
Self-citationTau PET imaging in neurodegenerative tauopathies—still a challenge
Leuzy, A., Chiotis, K., Lemoine, L., Gillberg, P.-G., Almkvist, O., Rodriguez-Vieitez, E., & Nordberg, A. (2019) · Molecular Psychiatry · doi:10.1038/s41380-018-0342-8 · Cited by 628
La Joie, R., Visani, A. V., Baker, S. L., Brown, J. A., Bourakova, V., Cha, J., Chaudhary, K., Edwards, L., Iaccarino, L., Janabi, M., et al. (2020) · Science Translational Medicine · doi:10.1126/scitranslmed.aau5732 · Cited by 612
Self-citationAssociations between tau, Aβ, and cortical thickness with cognition in Alzheimer disease
Ossenkoppele, R., Smith, R. A., Ohlsson, T. G., Strandberg, O. T., Mattsson, N., Insel, P. S., Palmqvist, S., & Hansson, O. (2019) · Neurology · doi:10.1212/wnl.0000000000006875 · Cited by 325
Self-citation
Metadata
- Authors
- Iaccarino, L., Tammewar, G., Ayakta, N., Baker, S. L., Bejanin, A., Boxer, A. L., Gorno-Tempini, M. L., Janabi, M., Kramer, J. H., Lazaris, A., Lockhart, S. N., Miller, B. L., Miller, Z. A., O'Neil, J. P., Ossenkoppele, R., Rosen, H. J., Schonhaut, D. R., Jagust, W. J., & Rabinovici, G. D.
- Affiliations
- Vita-Salute San Raffaele University (IT)
- University of California, San Francisco (US)
- Lawrence Berkeley National Laboratory (US)
- University of California, Berkeley (US)
- Corresponding author
- Iaccarino, Leonardo
- ORCID
- Venue
- NeuroImage: Clinical
- Publisher
- Elsevier BV
- Published
- 2018
- Volume
- 17
- Pages
- 452-464
- ISSN
- 2213-1582 (ISSN-L)
- PMC
- PMC5684433
- OpenAlex
- W2756641284
- Cited by
- 165
- References
- 85
- Citations by year
- 2026: 10 · 2025: 13 · 2024: 22 · 2023: 18 · 2022: 22 · 2021: 18 · 2020: 20 · 2019: 25 · 2018: 17
- FWCI
- 12.55
- Type
- journal article
- Language
- en
- Open access
- gold
- doi.org
- Licence
- Locations
- NeuroImage Clinical (publishedVersion, cc-by-nc-nd)
- PubMed Central (publishedVersion, cc-by-nc-nd)
- PubMed (publishedVersion)
- eScholarship (California Digital Library) (submittedVersion)
- OSTI OAI (U.S. Department of Energy Office of Scientific and Technical Information) (submittedVersion)
- DOAJ (DOAJ: Directory of Open Access Journals) (submittedVersion, cc-by-sa)
- Pure Amsterdam UMC (submittedVersion, other-oa)
- Amsterdam UMC (VU Amsterdam) - Institutional Repository (submittedVersion, other-oa)
- Data Archiving and Networked Services (DANS) (submittedVersion, other-oa)
- Funders
- University of California
- FP7 People: Marie-Curie Actions (628812)
- National Institutes of Health (K23-AG048291, R01-AG038791, U01-AG045390, U54-NS092089)
- Tau Consortium
- National Institute on Aging (F32-AG050389, P50-AG023501, R01-AG034570, R01-AG045611)
- John Douglas French Alzheimer's Foundation
- National Institute of Neurological Disorders and Stroke (R01-NS050915)
- Ministero dell’Istruzione, dell’Università e della Ricerca
- Alzheimer's Association
- Topics
- Life Sciences › Neuroscience › Cellular and Molecular Neuroscience › Alzheimer's disease research and treatments
- Health Sciences › Medicine › Psychiatry and Mental health › Dementia and Cognitive Impairment Research
- Life Sciences › Neuroscience › Neurology › Neuroinflammation and Neurodegeneration Mechanisms
- Keywords
- Alzheimer's disease, amyloid-beta, tau protein, neurodegeneration, 11C-PiB PET, gray matter volume reduction
- MeSH terms
- Aged, Aged, 80 and over, Alzheimer Disease, Brain, Female, Humans, Magnetic Resonance Imaging, Male, Middle Aged, Neural Pathways, Amyloid beta-Peptides, tau Proteins, Positron-Emission Tomography
About these checks
Registry, retraction, Cites and statistics results are computed, not judged, with one exception: a printed reference that no index lists is read once by a model before it counts as a citation error. Claims are extracted by a model and kept only when their quote appears verbatim in the text; each cited source is then checked, with a model’s help, for whether it says what the claim relies on. Those verdicts can be wrong — read the claim’s quote and the cited source before relying on one.
Statistics and arithmetic are recomputed, not judged.
Confidence bands are shown only for fields calibrated on our annotated test set. None is calibrated yet, so no band is shown.
What counts as a claim ›How we measure confidence ›How we check this ›
Are you an author, or do you see a problem with this page? Request a review
