

The DOI matches its Crossref record.
End-to-End page-Level assessment of handwritten text recognition
Overview
The claims and statistics of this paper haven’t been checked yet.
Run the check — free, no account needed. It reads the open-access text and checks the sources it cites.
Integrity signals
Registry
Cites
Statistics
Figures
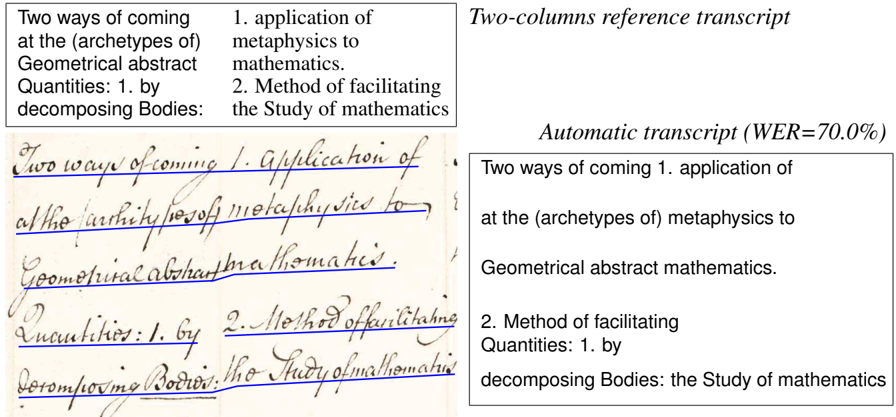
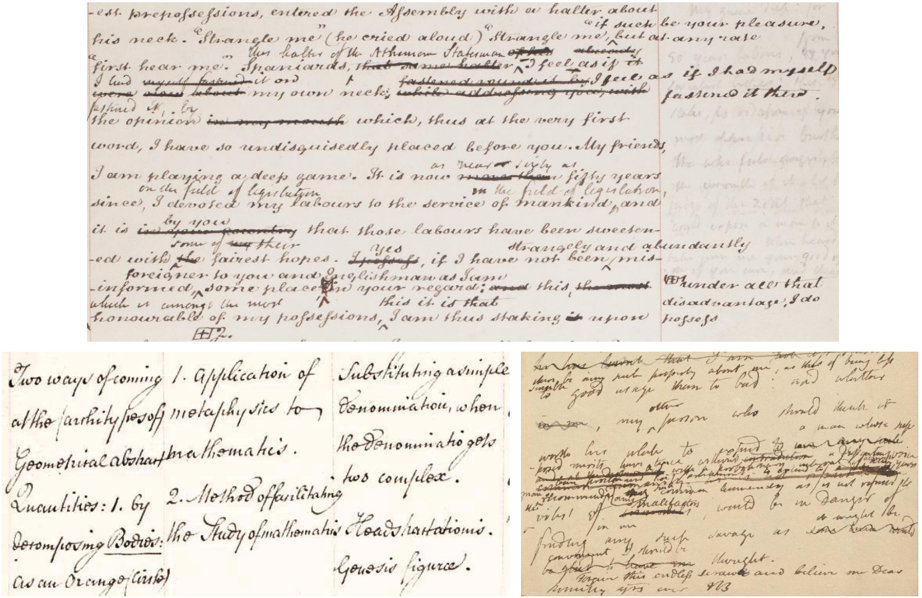
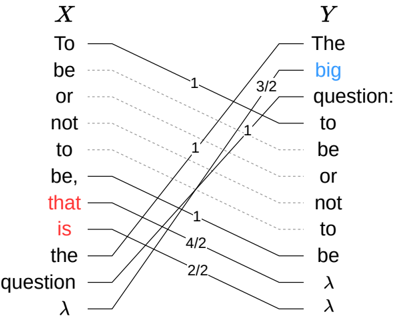
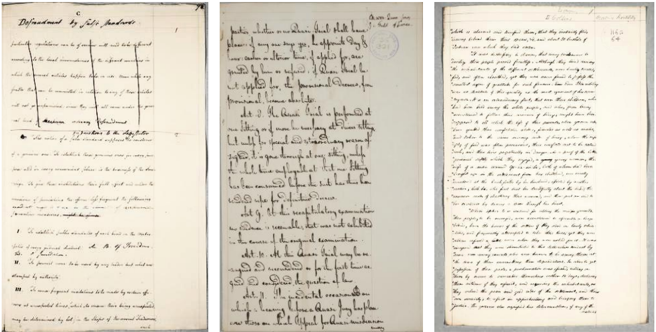
Verification
Claims the paper makes
The claims and statistics of this paper haven’t been checked yet.
Run the check — free, no account needed. It reads the open-access text and checks the sources it cites.
Claims other papers make about this one
Each is checked against this paper’s own text: does it say what the citing paper says it does?
In the citing paper
“Measuring WER and CER in automatically transcribed documents is especially difficult with historical documents (Vidal et al 2023).”
From Unlocking the archives: Using large language models to transcribe handwritten historical documents (2025) · cites this paper as Vidal et al 2023
Self-check
Percentages, sums and reported differences re-computed from the paper’s own numbers.
The self-check needs the paper’s full text.
Citations
Cites
No references could be resolved yet.
Research works printed but not linked: 15
- Clausner, 2020, Flexible character accuracy measure for reading-order-independent evaluation, Pattern Recognit. Lett., 131, 390, 10.1016/j.patrec.2020.02.003 · DOI
- Kendall, 1938, A new measure of rank correlation, Biometrika, 30, 81, 10.2307/2332226 · DOI
- Kuhn, 1955, The hungarian method for the assignment problem, Naval Res. Logist. Quarter., 2, 83, 10.1002/nav.3800020109 · DOI · Paper page
- C.-Y. Lee, C.-L. Li, C. Wang, R. Wang, Y. Fujii, S. Qin, A. Popat, T. Pfister, Rope: reading order equivariant positional encoding for graph-based document information extraction, 2021, (????). ArXiv preprint arXiv:2106.10786. · DOI
- Liang, 2019, Reassembling shredded document stripes using word-path metric and greedy composition optimal matching solver, IEEE Trans. Multimed., 22, 1168, 10.1109/TMM.2019.2941777 · DOI
- Liu, 2002, Optimal matching problem in detection and recognition performance evaluation, Pattern Recognit., 35, 2125, 10.1016/S0031-3203(01)00204-7 · DOI
- Marti, 2002, The IAM-database: an english sentence database for offline handwriting recognition, Int. J. Doc. Anal. Recogn., 5, 39, 10.1007/s100320200071 · DOI
- Muehlberger, 2019, Transforming scholarship in the archives through handwritten text recognition: transkribus as a case study, J. Document., 10.1108/JD-07-2018-0114 · DOI · Paper page
- Ney, 2000, Algorithms for statistical translation of spoken language, IEEE Trans. Speech Audio Process., 8, 24, 10.1109/89.817451 · DOI
- Popović, 2011, Towards automatic error analysis of machine translation output, Comput. Linguist., 37, 657, 10.1162/COLI_a_00072 · DOI
- L. Quirós, E. Vidal, Evaluation of a region proposal architecture for multi-task document layout analysis, 2021, (????). CoRR. arXiv: 2106.11797 · arXiv
- Sánchez, 2019, A set of benchmarks for handwritten text recognition on historical documents, Pattern Recognit, 94, 122, 10.1016/j.patcog.2019.05.025 · DOI
- A.H. Toselli, E. Vidal, Revisiting Bag-of-Word metrics to assess end-to-end text image recognition results, 2023, (????). To be published. · DOI
- Wagner, 1974, The string-to-string correction problem, J. ACM (JACM), 21, 168, 10.1145/321796.321811 · DOI
- Yin, 2009, Handwritten chinese text line segmentation by clustering with distance metric learning, Pattern Recognit., 42, 3146, 10.1016/j.patcog.2008.12.013 · DOI
Cited by
Unlocking the archives: Using large language models to transcribe handwritten historical documents
Humphries, M., Leddy, L. C., Downton, Q., Legace, M., McConnell, J., Murray, I., & Spence, E. (2025) · Historical Methods: A Journal of Quantitative and Interdisciplinary History · doi:10.1080/01615440.2025.2500309 · Cited by 72
Metadata
- Authors
- Vidal, E., Toselli, A. H., Ríos-Vila, A., & Calvo-Zaragoza, J.
- ORCID
- Vidal, Enrique
- Venue
- Pattern Recognition
- Publisher
- Elsevier BV
- Published
- 2023-10
- Volume
- 142
- Pages
- 109695
- ISSN
- 0031-3203
- Cited by
- 32
- References
- 0
- Language
- en
About these checks
Registry, retraction, Cites and statistics results are computed, not judged, with one exception: a printed reference that no index lists is read once by a model before it counts as a citation error. Claims are extracted by a model and kept only when their quote appears verbatim in the text; each cited source is then checked, with a model’s help, for whether it says what the claim relies on. Those verdicts can be wrong — read the claim’s quote and the cited source before relying on one.
Statistics and arithmetic are recomputed, not judged.
Confidence bands are shown only for fields calibrated on our annotated test set. None is calibrated yet, so no band is shown.
What counts as a claim ›How we measure confidence ›How we check this ›
Are you an author, or do you see a problem with this page? Request a review
Data sources
Bibliographic data: Semantic Scholar, OpenAlex, Crossref.
Contains information from the Semantic Scholar Academic Graph Datasets, made available under the ODC Attribution License (ODC-BY 1.0).
Semantic Scholar’s data is described in: Kinney, R., et al. (2023). The Semantic Scholar Open Data Platform. arXiv:2301.10140.
