

The DOI matches its Crossref record.
Closed-system behaviour of the intra-crystalline fraction of amino acids in mollusc shells
Overview
The claims and statistics of this paper haven’t been checked yet.
Run the check — free, no account needed. It reads the open-access text and checks the sources it cites.
Integrity signals
Registry
Cites
Statistics
Figures
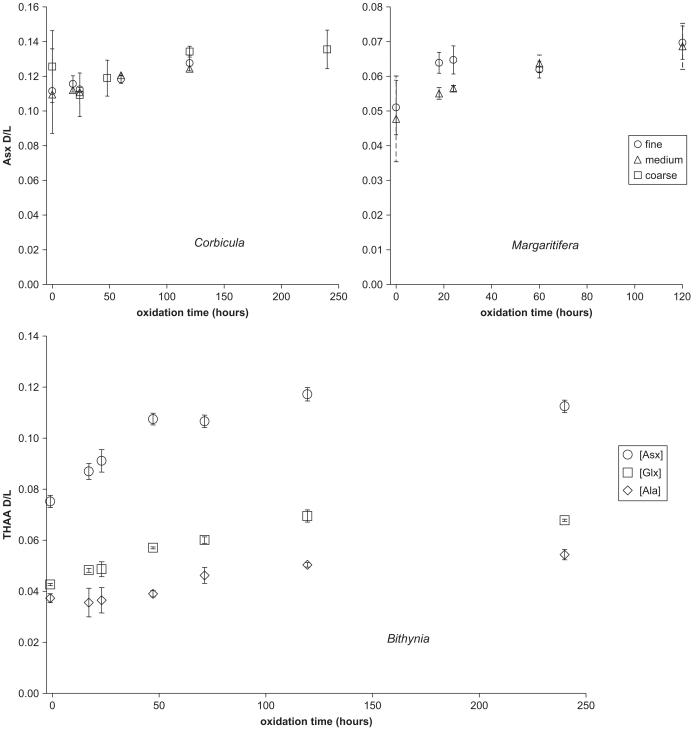
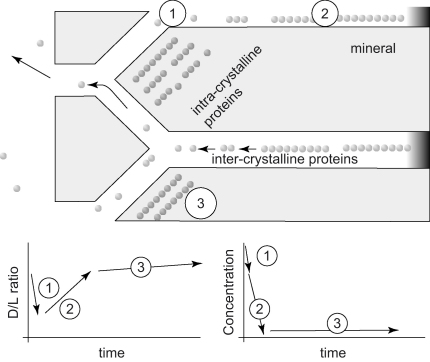
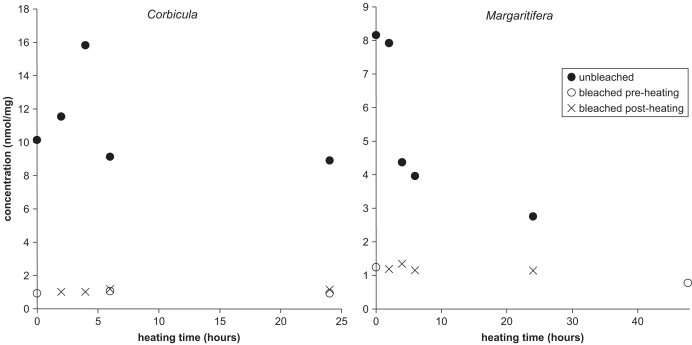
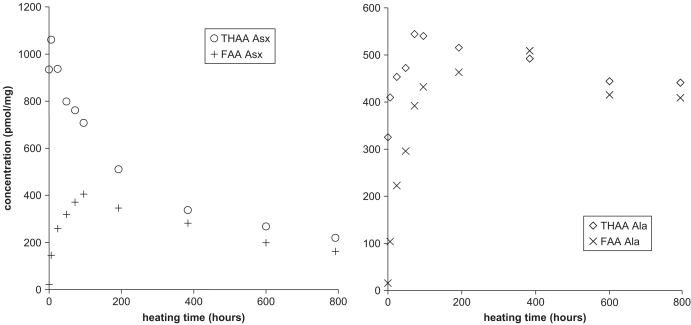
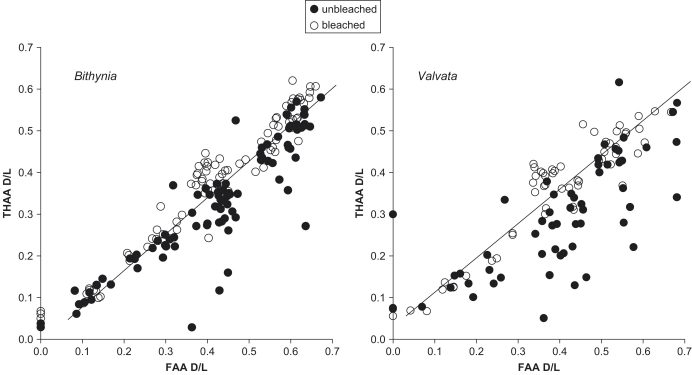
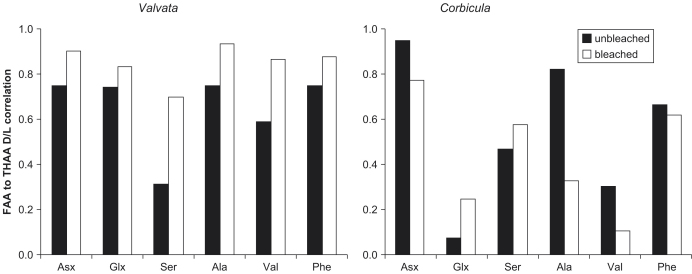
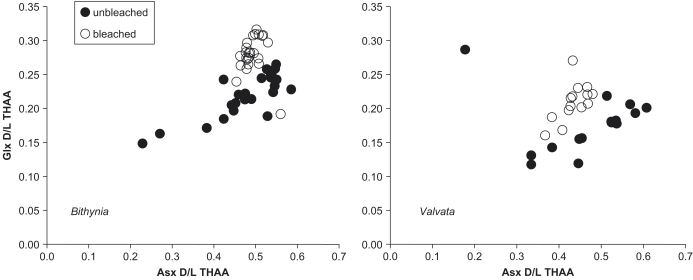
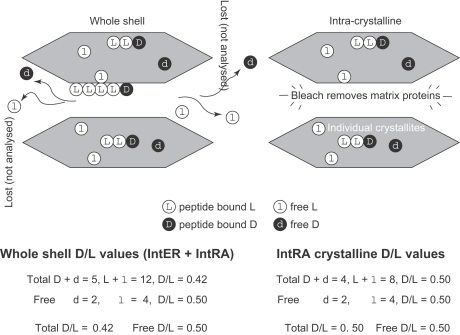
Verification
Claims the paper makes
The claims and statistics of this paper haven’t been checked yet.
Run the check — free, no account needed. It reads the open-access text and checks the sources it cites.
Claims other papers make about this one
Each is checked against this paper’s own text: does it say what the citing paper says it does?
The cited source says what the claim attributes to it.
In the citing paper
“However, AAR has seen particular success in highly mineralized substrates that act as closed systems (26). Such substrates for analyses include mollusk and avian shell (11, 26, 27) as well as tooth enamel (13, 28), which are substrates where intracrystalline amino acids should remain endogenous and predictable.”
From Ancient protein analysis in archaeology (2021) · cites this paper as [26]
Self-check
Percentages, sums and reported differences re-computed from the paper’s own numbers.
The self-check needs the paper’s full text.
Citations
Cites
No references could be resolved yet.
Research works printed but not linked: 54
- Abelson, 1971, Reactions of amino acids with natural and artificial humus and kerogens, Carnegie Institute of Washington Year Book, 69, 327
- Anderson, 1963, An improved pretreatment for mineralogical analysis of samples containing organic matter, Clays and Clay Minerals, 10, 380, 10.1346/CCMN.1961.0100134 · DOI
- Berman, 1993, Biological-control of crystal texture—a widespread strategy for adapting crystal properties to function, Science, 259, 776, 10.1126/science.259.5096.776 · DOI
- Bourrat, X., Rousseau, M., Lopez, E., Couté, A., Mascarel, G., Smith, D.C., Stempflé, P., 2005. Nano-composite structure of nacre biocrystal. BioMin 2005, Ninth International Symposium on Biomineralization, 6–9 December 2005 Pucón, Chile.
- Bowen, 1989, Land-sea correlations in the Pleistocene based on isoleucine epimerization in non-marine mollusks, Nature, 340, 49, 10.1038/340049a0 · DOI
- Brooks, 1990, Dating Pleistocene archaeological sites by protein diagenesis in ostrich eggshell, Science, 248, 60, 10.1126/science.248.4951.60 · DOI
- Collins, 1991, Macromolecules in brachiopod shells: Characterisation and diagenesis, Lethaia, 24, 387, 10.1111/j.1502-3931.1991.tb01491.x · DOI
- Collins, 1992, Experimental evidence for condensation reactions between sugars and proteins in carbonate skeletons, Geochimica et Cosmochimica Acta, 56, 1539, 10.1016/0016-7037(92)90223-6 · DOI
- Crenshaw, 1972, The soluble matrix from Mercenaria mercenaria shell, Biomineralisation, 6, 6
- Cuif, 2005, The environmental recording unit in coral skeletons—a synthesis of structural and chemical evidences for a biochemically driven, stepping-growth process in fibres, Biogeosciences, 2, 61, 10.5194/bg-2-61-2005 · DOI
- Dauphin, 2001, Nanostructures de la nacre des tests de cephalopods actuels, Paläontologische Zeitschrift, 75, 113, 10.1007/BF03022601 · DOI
- Endo, 1995, Fossil intra-crystalline biomolecules of Brachiopod shells: Diagenesis and preserved geo-biological information, Organic Geochemistry, 23, 661, 10.1016/0146-6380(95)00042-D · DOI
- Engel, 1986, Stable isotope evaluation of the origins of amino acids in fossils, Nature, 323, 531, 10.1038/323531a0 · DOI
- Engel, 1994, Indigeneity of organic-matter in fossils-a test using stable-isotope analysis of amino-acid enantiomers in Quaternary mollusk shells, Proceedings of the National Academy of Sciences of the United States of America, 91, 10475, 10.1073/pnas.91.22.10475 · DOI
- Falini, 2003, Chitin-silk fibroin interactions: Relevance to calcium carbonate formation in invertebrates, Calcified Tissue International, 72, 548, 10.1007/s00223-002-1055-0 · DOI · Paper page
- Gaffey, 1988, Water in skeletal carbonates, Journal of Sedimentary Petrology, 58, 397
- Hare, 1971, Effect of hydrolysis on racemization rate of amino acids, Carnegie Institute Washington Yearbook, 70, 801
- Hare, 1969, Laboratory simulation of amino acid diagenesis in fossils, Carnegie Institute Washington Yearbook, 67, 205
- Herriott, 1947, Reaction of native proteins with chemical reagents, Advances in Protein Chemistry, 3, 169, 10.1016/S0065-3233(08)60080-7 · DOI
- Hill, 1965, Hydrolysis of proteins, Advances in Protein Chemistry, 20, 37, 10.1016/S0065-3233(08)60388-5 · DOI
- Kaufman, 2006, Temperature senstitivity of aspartic and glutamic acid racemization in the foraminifera Pulleniatina, Quaternary Geochronology, 1, 188, 10.1016/j.quageo.2006.06.008 · DOI
- Kaufman, 1998, A new procedure for determining DL amino acid ratios in fossils using reverse phase liquid chromatography, Quaternary Science Reviews, 17, 987, 10.1016/S0277-3791(97)00086-3 · DOI
- Kimber, 1987, Further evidence of the complexity of the racemization process in fossil shells with implications for amino acid racemization dating, Geochimica et Cosmochimica Acta, 51, 839, 10.1016/0016-7037(87)90097-4 · DOI
- Kriausakul, 1978, Isoleucine epimerization in peptides and proteins: kinetic factors and application to fossil proteins, Science, 201, 1011, 10.1126/science.201.4360.1011 · DOI
- Langford, 2007, Age-estimate evidence for Middle-Late Pleistocene aggradation of River Nene 1st Terrace deposits at Whittlesey, eastern England, Proceedings of the Geologists’ Association, 118, 283, 10.1016/S0016-7878(07)80029-0 · DOI
- Lecuyer, 1993, Stable isotope compositions of fluid inclusions in biogenic carbonates, Geochimica et Cosmochimica Acta, 58, 353, 10.1016/0016-7037(94)90469-3 · DOI
- Levi-Kalisman, 2001, Structure of the nacreous organic matrix of a bivalve mollusk shell examined in the hydrated state using cryo-TEM, Journal of Structural Biology, 135, 8, 10.1006/jsbi.2001.4372 · DOI
- Marin, 2005, Molluscan biomineralization: the proteinaceous shell constituents of Pinna nobilis L, Materials Science and Engineering: C, 25, 105, 10.1016/j.msec.2005.01.003 · DOI
- McCoy, 1987, The precision of amino acid geochronology and palaeothermometry, Quaternary Science Reviews, 6, 43, 10.1016/0277-3791(87)90016-3 · DOI
- Miller, 1989, Amino acid geochronology: resolution and precision in carbonate fossils, Quaternary International, 1, 111, 10.1016/1040-6182(89)90011-6 · DOI
- Miller, 1979, Aminostratigraphy of UK Pleistocene deposits, Nature, 281, 539, 10.1038/281539a0 · DOI
- Miller, 1992, Pleistocene geochronology and palaeothermometry from protein diagenesis in ostrich eggshells: implications for the evolution of modern humans, Philosophical Transactions of the Royal Society, London B, 337, 149, 10.1098/rstb.1992.0092 · DOI
- Mitterer, 1984, Comparison of rates and degrees of isoleucine epimerisation in dipeptides and tripeptides, Organic Chemistry, 7, 91
- Murray-Wallace, 1995, Aminostratigraphy of Quaternary coastal sequences in southern Australia—an overview, Quaternary International, 26, 69, 10.1016/1040-6182(94)00048-A · DOI
- Nickl, 1969, Growth of calcite crystals in gels, Journal of the Electrochemical Society, 116, 1258, 10.1149/1.2412292 · DOI
- Oaki, 2006, Bridged nanocrystals in biominerals and their biomimetics: classical yet modern crystal growth on the nanoscale, Advanced Functional Materials, 16, 1633, 10.1002/adfm.200600262 · DOI
- Pardieck, 1992, Hydrogen-peroxide use to increase oxidant capacity for in situ bioremediation of contaminated soils and aquifers: A review, Journal of Contaminant Hydrology, 9, 221, 10.1016/0169-7722(92)90006-Z · DOI
- Penkman, K.E.H., 2005. Amino acid geochronology: a closed system approach to test and refine the UK model. Unpublished Ph.D. Thesis, University of Newcastle.
- Penkman, K.E.H., Preece, R.C., Keen, D.H., Maddy, D., Schreve, D.S., Collins, M.J. 2007. Testing the aminostratigraphy of fluvial archives: the evidence from intra-crystalline proteins within freshwater shells. Quaternary Science Reviews, in press, doi:10.1016/j.quasicirev.2007.06.034. · DOI
- Pereira-Mouries, 2002, Soluble silk-like organic matrix in the nacreous layer of the bivalve Pinctada maxima: A new insight in the biomineralization field, European Journal of Biochemistry, 269, 4994, 10.1046/j.1432-1033.2002.03203.x · DOI
- Preece, 2005, Molluscan assemblages and amino acid dating of the Lower Palaeolithic site at East Farm, Barnham, Suffolk, Proceedings of the Geologists’ Association, 116, 363, 10.1016/S0016-7878(05)80053-7 · DOI
- Roof, 1997, Comparison of isoleucine epimerization and leaching potential in the molluskan genera Astarte, Macoma, and Mya, Geochimica et Cosmochimica Acta, 61, 5325, 10.1016/S0016-7037(97)00294-9 · DOI
- Schreve, 2002, Sedimentology, palaeontology and archaeology of late Middle Pleistocene River Thames terrace deposits at Purfleet, Essex, UK, Quaternary Science Reviews, 21, 1423, 10.1016/S0277-3791(01)00100-7 · DOI
- Stathoplos, 1993, Bleach removes labile amino acids from deep sea planktonic foraminiferal shells, Journal of Foraminiferal Research, 23, 102, 10.2113/gsjfr.23.2.102 · DOI
- Stern, 1999, Development and comparison of different methods for the extraction of biomineral associated lipids, Ancient Biomolecules, 3, 321
- Stolarski, 2005, Nanostructure of biogenic versus abiogenic calcium carbonate crystals, Acta Palaeontologica Polonica, 50, 847
- Sykes, 1995, The significance of a geochemically isolated intracrystalline fraction within biominerals, Organic Geochemistry, 23, 1059, 10.1016/0146-6380(95)00086-0 · DOI · Paper page
- Tan, 1989, Temporal variation in microstructure of the inner shell surface of Corbicula fluminea (Bivalvia: Heterodonta), American Malacological Bulletin, 7, 65
- Thompson, 1966, Low molecular weight hydrocarbons in Recent and fossil shells, Geochimica et Cosmochimica Acta, 30, 1137, 10.1016/0016-7037(66)90034-2 · DOI
- Towe, 1972, The structure of some bivalve shell carbonates prepared by ion-beam thinning, Calcified Tissue Research, 10, 38, 10.1007/BF02012534 · DOI
- Walton, 1998, Degradation of intracrystalline proteins and amino acids in fossil brachiopods, Organic Geochemistry, 28, 389, 10.1016/S0146-6380(97)90126-1 · DOI
- Wehmiller, 1984, Interlaboratory comparison of amino acid enantiomeric ratios in fossil Pleistocene molluscs, Quaternary Research, 22, 109, 10.1016/0033-5894(84)90010-3 · DOI
- Wehmiller, 1971, Racemization of amino acids in marine sediments, Science, 173, 907, 10.1126/science.173.4000.907 · DOI
- Wilmot, 1992, Electron microscopy of molluscan crossed-lamellar microstructure, Philosophical Transactions of the Royal Society, London B, 337, 21, 10.1098/rstb.1992.0080 · DOI
Cited by
Sorted by citations
A guide to ancient protein studies
Hendy, J., Welker, F., Demarchi, B., Speller, C., Warinner, C., & Collins, M. J. (2018) · Nature Ecology & Evolution · doi:10.1038/s41559-018-0510-x · Cited by 291
Self-citationAncient protein analysis in archaeology
Hendy, J. (2021) · Science Advances · doi:10.1126/sciadv.abb9314 · Cited by 161
Is amino acid racemization a useful tool for screening for ancient DNA in bone?
Collins, M. J., Penkman, K. E. H., Rohland, N., Shapiro, B., Dobberstein, R. C., Ritz-Timme, S., & Hofreiter, M. (2009) · Proceedings of the Royal Society B: Biological Sciences · doi:10.1098/rspb.2009.0563 · Cited by 82
Self-citationCrisp, M., Demarchi, B., Collins, M., Morgan-Williams, M., Pilgrim, E., & Penkman, K. (2013) · Quaternary Geochronology · doi:10.1016/j.quageo.2012.09.002 · Cited by 54
Self-citationA new method for enamel amino acid racemization dating: a closed system approach
Dickinson, M. R., Lister, A. M., & Penkman, K. E. H. (2019) · Quaternary Geochronology · doi:10.1016/j.quageo.2018.11.005 · Cited by 50
Self-citationEarly Pleistocene enamel proteome sequences from Dmanisi resolve Stephanorhinus phylogeny
Cappellini, E., Welker, F., Pandolfi, L., Madrigal, J. R., Fotakis, A. K., Lyon, D., Moreno Mayar, V. J., Bukhsianidze, M., Jersie-Christensen, R. R., Mackie, M., et al. (2018) · doi:10.1101/407692 · Cited by 20
Self-citation
Metadata
- Authors
- Penkman, K. E. H., Kaufman, D. S., Maddy, D., & Collins, M. J.
- Venue
- Quaternary Geochronology
- Publisher
- Elsevier BV
- Published
- 2008-02
- Volume
- 3
- Issue
- 1-2
- Pages
- 2-25
- ISSN
- 1871-1014
- PMC
- PMC2727006
- Cited by
- 205
- References
- 0
- Language
- en
About these checks
Registry, retraction, Cites and statistics results are computed, not judged, with one exception: a printed reference that no index lists is read once by a model before it counts as a citation error. Claims are extracted by a model and kept only when their quote appears verbatim in the text; each cited source is then checked, with a model’s help, for whether it says what the claim relies on. Those verdicts can be wrong — read the claim’s quote and the cited source before relying on one.
Statistics and arithmetic are recomputed, not judged.
Confidence bands are shown only for fields calibrated on our annotated test set. None is calibrated yet, so no band is shown.
What counts as a claim ›How we measure confidence ›How we check this ›
Are you an author, or do you see a problem with this page? Request a review
