

The DOI matches its Crossref record.
Assessment of physicochemical properties of water and their seasonal variation in an urban river in Bangladesh
Overview
The claims and statistics of this paper haven’t been checked yet.
Run the check — free, no account needed. It reads the open-access text and checks the sources it cites.
Integrity signals
Registry
Cites
Statistics
Figures
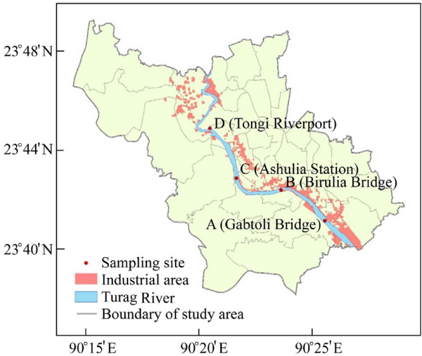
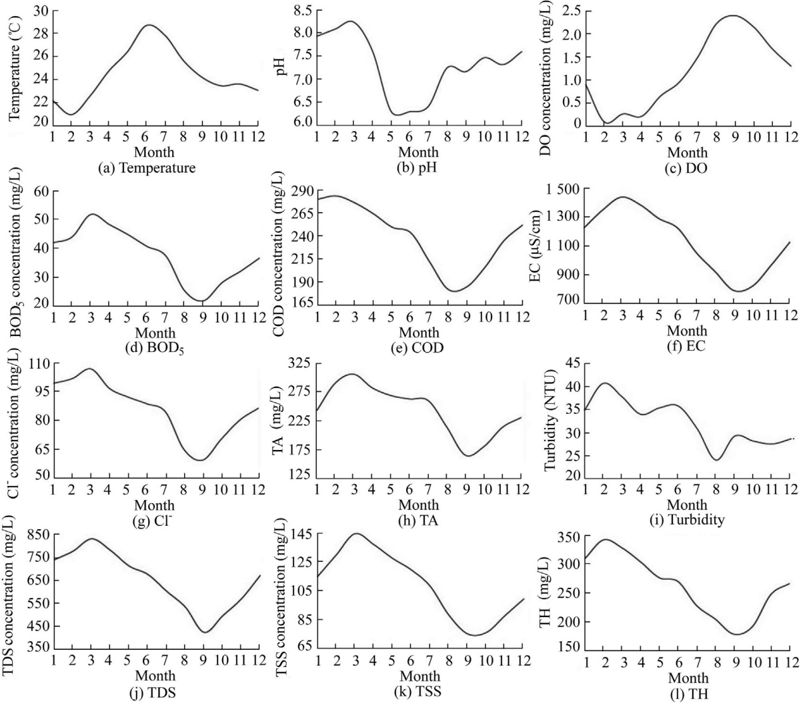
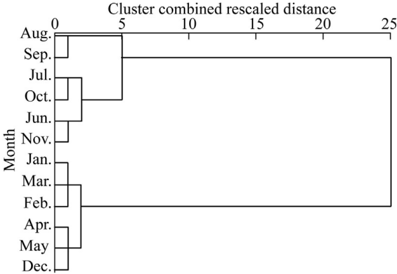
Verification
Claims the paper makes
The claims and statistics of this paper haven’t been checked yet.
Run the check — free, no account needed. It reads the open-access text and checks the sources it cites.
Claims other papers make about this one
Each is checked against this paper’s own text: does it say what the citing paper says it does?
The source backs part of the claim, not all of it — or backs it for a different population, condition or comparison.
In the citing paper
“EC is the measurement of dissolved minerals, salts, and ionic compounds; therefore, it is frequently measured as a water quality parameter that presents a very strong positive correlation with the TS, TDS, and minerals (Cl -) [45,56,57].”
From Multivariate analysis of water quality in the Dhaleshwari River, Bangladesh: identifying pollution sources and environmental implications (2024) · cites this paper as [45]
Experimental — accuracy not yet measured
Self-check
Percentages, sums and reported differences re-computed from the paper’s own numbers.
The self-check needs the paper’s full text.
Citations
Cites
No references could be resolved yet.
Research works printed but not linked: 31
- Afrin, 2015, Status of water pollution in respect of physicochemical parameters and anions in the Turag River of Bangladesh, Bangladesh J. Environ. Sci., 28, 113
- Ahmed, 2016, Assessment on the level of contamination of Turag River at Tongi area in Dhaka, Bangladesh J. Sci. Ind. Res., 51, 193, 10.3329/bjsir.v51i3.29431 · DOI
- Aktar, 2017, Assessment of water quality status of Turag River due to industrial effluent, Int. J. Eng. Inform. Syst., 1, 105
- Banu, 2013, Contamination and ecological risk assessment of heavy metal in the sediment of Turag River, Bangladesh: An index analysis approach, J. Water Resour. Protect., 5, 239, 10.4236/jwarp.2013.52024 · DOI
- Barakat, 2016, Assessment of spatial and seasonal water quality variation of Oum Er Rbia River (Morocco) using multivariate statistical techniques, Int. Soil Water Conserv. Res., 4, 284, 10.1016/j.iswcr.2016.11.002 · DOI
- Bhuiyan, 2011, Surface water quality assessment in the central part of Bangladesh using multivariate analysis, KSCE J. Civ. Eng., 15, 995, 10.1007/s12205-011-1079-y · DOI
- Brar, 2017, Photoautotrophic microorganisms and bioremediation of industrial effluents: Current status and future prospects, Biotech, 7, 18
- Dewan, 2012, Dynamics of land use/cover changes and the analysis of landscape fragmentation in Dhaka Metroploitan, Bangladesh, GeoJournal, 77, 315, 10.1007/s10708-010-9399-x · DOI
- Hafizur, 2017, Investigation of physicochemical parameters, heavy metals in Turag River water and adjacent industrial effluent in Bangladesh, J. Sci. Technol. Environ. Inform., 5, 347, 10.18801/jstei.050117.37 · DOI
- Hasan, 2019, Water pollution in Bangladesh and its impact on public health, Heliyon, 5, 10.1016/j.heliyon.2019.e02145 · DOI
- Hossain, 2012, Present status of water quality of the Bangshi River, Savar, Dhaka, Bangladesh, Bangladesh J. Environ. Res., 10, 17
- Islam, 2018, Hydro-environmental pollution of Turag River in Bangladesh, Bangladesh J. Sci. Ind. Res., 53, 161, 10.3329/bjsir.v53i3.38261 · DOI
- Islam, 2013, Effects of solid waste and industrial effluents on water quality of Turag River at Konabari industrial area, Gazipur, Bangladesh, J. Environ. Sci. Nat. Resour., 5, 213
- Islam, 2015, Alteration of water pollution level with the seasonal changes in mean daily discharge in three main rivers around Dhaka City, Bangladesh, Environments, 2, 280, 10.3390/environments2030280 · DOI
- Islam, 2019, Investigation of surface water quality of the Buriganga River Bangladesh: Laboratory and spatial analysis approaches, Dhaka Univ. J. Biol. Sci., 28, 147, 10.3329/dujbs.v28i2.46501 · DOI
- Jin, 2020, Mitigation of impact of a major benzene spill into a river through flow control and in-situ activated carbon absorption, Water Res., 172, 10.1016/j.watres.2020.115489 · DOI
- Jin, 2020, Response of sediments and phosphorus to catchment characteristics and human activities under different rainfall patterns with Bayesian Networks, J. Hydrol., 584, 10.1016/j.jhydrol.2020.124695 · DOI
- Jirka, 1975, USEPA reactor digestion method for COD analysis, Anal. Chem., 47, 1397, 10.1021/ac60358a004 · DOI
- Jolly, 2018, Appraisal of metal pollution in the aquatic environment of Shitalakhya River, Bangladesh and its ecological risk assessment, J. Nat. Sci. Sustain. Technol., 12, 289
- Kant, 2012, Textile dyeing industry an environmental hazard, Nat. Sci., 4, 22
- Klein, 1979, Graphical method for calculating biochemical oxygen demand, J. Water Pollut. Control Fed., 51, 2257
- Machender, 2013, Hydrogeochemical characteristics of surface water (SW) and groundwater (GW) of the Chinnaeru River Basin, northern part of Nalgonda District, Andhra Pradesh, India, Environ. Earth Sci., 71, 2885, 10.1007/s12665-013-2665-8 · DOI
- Moniruzzaman, 2009, Study on temporal variation of physicochemical parameters of Buriganga River water through GIS (Geographical Information System) technology, Bangladesh J. Sci. Ind. Res., 44, 327, 10.3329/bjsir.v44i3.4406 · DOI
- Parker, 1992, Waterfowl distribution relative to freshwater wetland acidity, J. Wildl. Manag., 56, 268, 10.2307/3808822 · DOI
- Sarkar, 2016, Pollution and ecological risk assessment for the environmentally impacted Turag River. Bangladesh, J. Mater. Environ. Sci., 7, 2295
- Sayed, 2016, Evaluation of flooding risk in greater Dhaka District using satellite data and geomorphological land classification map, J. Geosci. Environ. Protect., 4, 110, 10.4236/gep.2016.49009 · DOI
- Tahmina, 2018, Assessment of surface water quality of the Turag River in Bangladesh, Res. J. Chem. Environ., 22, 49
- Uddin, 2021, Urban river pollution in Bangladesh during last 40 years: Potential public health and ecological risk, present policy, and future prospects toward smart water management, Heliyon, 7, 10.1016/j.heliyon.2021.e06107 · DOI
- Vega, 1998, Assessment of seasonal and polluting effects on the quality of river water by exploratory data analysis, Water Res., 32, 3581, 10.1016/S0043-1354(98)00138-9 · DOI · Paper page
- Whitehead, 2009, A review of the potential impacts of climate change on surface water quality, Hydrol. Sci. J., 54, 101, 10.1623/hysj.54.1.101 · DOI
- Whitehead, 2018, Restoring water quality in the polluted Turag-Tongi-Balu river system, Dhaka: Modelling nutrient and total coliform intervention strategies, Sci. Total Environ., 631–632, 223, 10.1016/j.scitotenv.2018.03.038 · DOI
Cited by
Sorted by citations
Ali, M. S., Begum, S., Rabbi, F. M., Sumaia, Hasan, M. K., Rahman, M. A., Rahman, M. M., & Rahaman, M. H. (2024) · Water Practice & Technology · doi:10.2166/wpt.2024.251 · Cited by 13
Tamrakar, A., Upadhyay, K., & Bajpai, S. (2022) · IOP Conference Series: Earth and Environmental Science · doi:10.1088/1755-1315/1032/1/012034 · Cited by 6
Metadata
- Authors
- Rahman, A., Jahanara, I., & Jolly, Y. N.
- Venue
- Water Science and Engineering
- Publisher
- Elsevier BV
- Published
- 2021-06
- Volume
- 14
- Issue
- 2
- Pages
- 139-148
- ISSN
- 1674-2370
- Cited by
- 168
- References
- 0
- Language
- en
About these checks
Registry, retraction, Cites and statistics results are computed, not judged, with one exception: a printed reference that no index lists is read once by a model before it counts as a citation error. Claims are extracted by a model and kept only when their quote appears verbatim in the text; each cited source is then checked, with a model’s help, for whether it says what the claim relies on. Those verdicts can be wrong — read the claim’s quote and the cited source before relying on one.
Statistics and arithmetic are recomputed, not judged.
Confidence bands are shown only for fields calibrated on our annotated test set. None is calibrated yet, so no band is shown.
What counts as a claim ›How we measure confidence ›How we check this ›
Are you an author, or do you see a problem with this page? Request a review
