Cited by 114Gut microbiota and healthClostridium difficile and Clostridium perfringens researchGastrointestinal motility and disorders

The DOI matches its Crossref record; 102 of the 103 references it cites were found in a registry or an index, and 1 are not checked yet.

Identification of clinical and ecological determinants of strain engraftment after fecal microbiota transplantation using metagenomics

Open access

Published version of a preprint

Abstract

ABSTRACT Fecal microbiota transplantation (FMT) is both a promising therapeutic approach to treat microbiota-associated pathologies and an experimental tool to establish a causal role of microbiome dysbiosis in human pathologies. Although clearly efficacious in resolving recurrent Clostridioides difficile infection (rCDI), the therapeutic value of FMT in other pathologies is not yet established, and our mechanistic and ecological understanding of how FMT alters the microbiome in patients is incomplete. Here, we assembled the most comprehensive FMT trial microbiota dataset to date, including new and previously generated fecal metagenomes from FMT trials in rCDI, inflammatory bowel disease (IBD), metabolic syndrome (MetS), drug-resistant pathogen colonization (MDR), and resistance to immune checkpoint inhibitor anti-tumor therapy (ICI). We characterized post-FMT microbiota assembly in the recipients by establishing the origin of the detected strains, and we identified the clinical and ecological factors that determine the engraftment of donor strains. Our findings showed little coexistence of donor and recipient strains and linked the magnitude of donor strain engraftment to dysbiosis of the recipient microbiome. Dysbiosis and strain engraftment were low in pathologies other than rCDI but could be enhanced through pretreatment with antibiotics and lavage. Using generalized linear mixed-effects models, we demonstrate that both ecological (low recipient and high donor ɑ-diversity and relative species abundance) and clinical (antibiotic pretreatment, bowel lavage, multiple rounds of FMT) variables are associated with increased donor microbiota engraftment, and that donor strain engraftment events are predictable for individual patients and strains. Overall donor strain engraftment was not linked to FMT outcome in IBD patients but was higher in ICI patients that responded to immunotherapy after FMT. Our findings provide an ecological framework for post-FMT microbiota assembly that can predict donor strain engraftment and determine its importance for clinical outcomes, informing more targeted and personalized approaches to increase the therapeutic benefits of FMTs.

Overview

The claims and statistics of this paper haven’t been checked yet.

Run the check — free, no account needed. It reads the open-access text and checks the sources it cites.

A few free checks a day · papers already verified open instantly · results are public

Integrity signals

Registry

Crossref · 10.1016/j.xcrm.2022.100711

Cites

102 of 103 references verified0 citation errors · 0 not checkable

Statistics

Figures

Graphical abstract
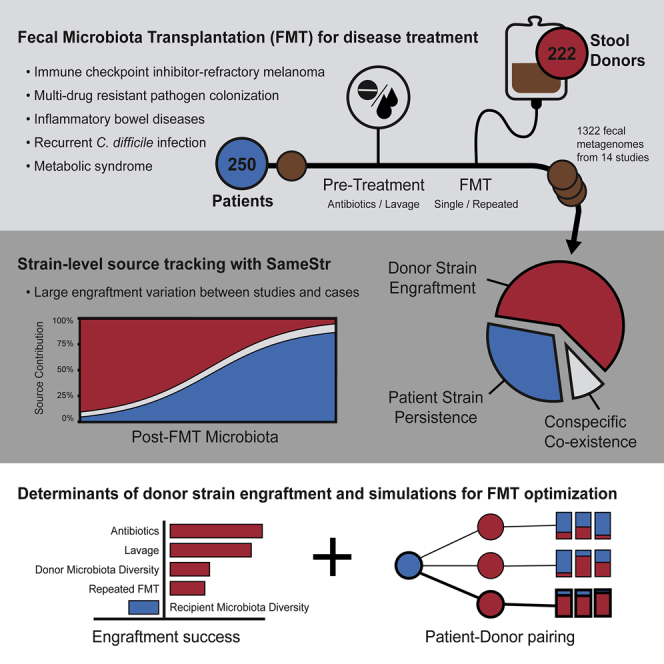
Graphical abstract CC BY · PubMed Central
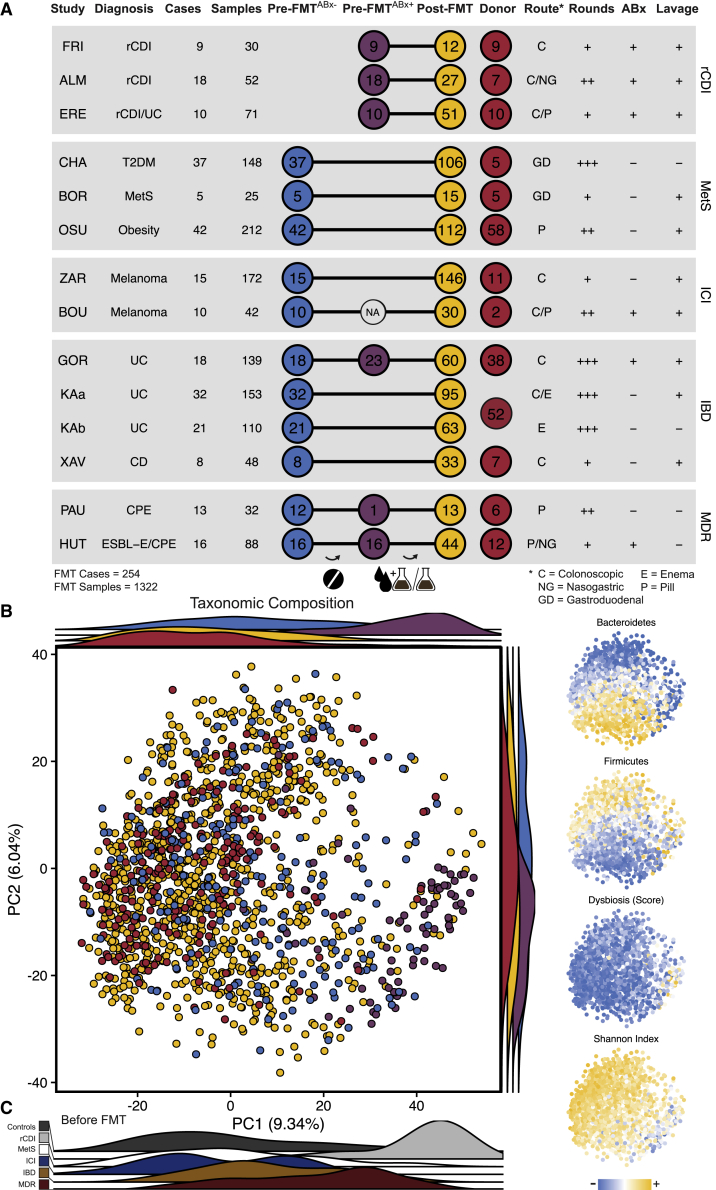
Figure 1 Overview and taxonomic microbiota composition of the FMT meta-cohort (A) Overview of treatment modalities, number and distribution of cases, and samples for 13 studies (Table S1) from five conditions included in the FMT meta-cohort. (B) Taxonomic microbiota compositions based on principal-component analysis (PCA) of centered log-ratio-transformed relative species abundance. Samples in the main plot are categorized and color-coded as pre-FMTABx− (blue), antibiotically pretreated pre-FMTABx+ (purple), and post-FMT (yellow) patient and donor (red) samples. Ridgeline density plots show sample distributions along the two first principal components based on the same categories. In the small plots (right side) samples from the same PCA are color-coded based on (from top to bottom) scaled cumulative relative abundances of Bacteroidetes, Firmicutes, dysbiosis score,23 and ɑ-diversity (Shannon index). (C) Ridgeline density plots showing only pre-FMT (untreated and antibiotically pretreated) patient samples, colored by disease category. The MDR studies included patients with a history of antibiotic treatments, even before the beginning of the FMT trials.
Figure 1 Overview and taxonomic microbiota composition of the FMT meta-cohort (A) Overview of treatment modalities, number and distribution of cases, and samples for 13 studies (Table S1) from five conditions included in the FMT meta-cohort. (B) Taxonomic microbiota compositions based on principal-component analysis (PCA) of centered log-ratio-transformed relative species abundance. Samples in the main plot are categorized and color-coded as pre-FMTABx− (blue), antibiotically pretreated pre-FMTABx+ (purple), and post-FMT (yellow) patient and donor (red) samples. Ridgeline density plots show sample distributions along the two first principal components based on the same categories. In the small plots (right side) samples from the same PCA are color-coded based on (from top to bottom) scaled cumulative relative abundances of Bacteroidetes, Firmicutes, dysbiosis score,23 and ɑ-diversity (Shannon index). (C) Ridgeline density plots showing only pre-FMT (untreated and antibiotically pretreated) patient samples, colored by disease category. The MDR studies included patients with a history of antibiotic treatments, even before the beginning of the FMT trials.CC BY · PubMed Central
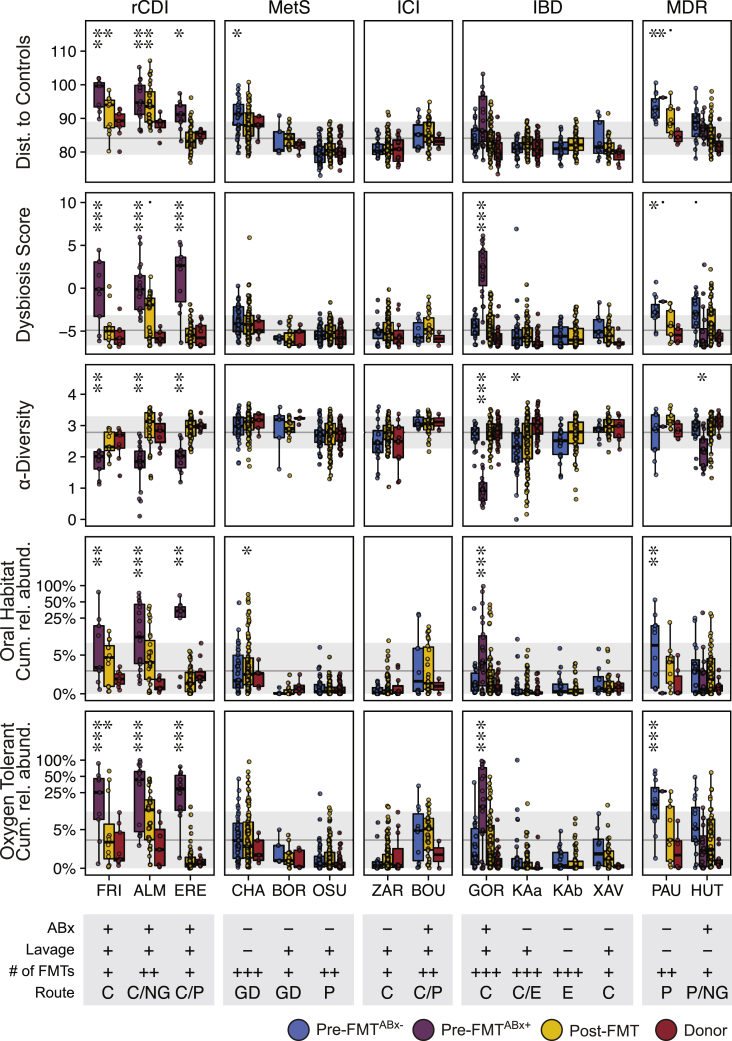
Figure 2 Taxonomic and functional microbiota comparison of FMT recipients, with or without antibiotic treatment, post-FMT patients, and donors in the different studies Generalized linear mixed-effects models (GLMM, see STAR Methods) highlight differences in taxonomic and functional microbiota metrics between pre-FMTABx− (blue), pretreated pre-FMTABx+ (purple), Post-FMT (yellow), and donor (red) samples relative to a reference cohort of 739 healthy adults (gray line and area denote mean ± SD, respectively), based on the average distance to healthy control samples (β-diversity, Aitchison distance), the dysbiosis score,23 α-Diversity (Shannon index), and the cumulative relative abundance of oxygen-tolerant or oral bacterial species. Metadata abbreviations indicate pretreatment with ABx and lavage (+/−); single (+), two (++), or multiple (+++) FMTs; colonoscopic (C), nasogastric (NG), or gastroduodenal (GD) FMT route, enema (E), and pill/capsule (P) administration. Sample sizes (see STAR Methods for the reference cohort) are as shown in Figure 1A, excluding post-FMT samples from patients who have been exposed to antibiotics after FMT (OSU = 9, ZAR = 5, PAU = 4). Significant differences of the different sample types from healthy controls were determined for each metric and study separately with GLMMs. Asterisks denote significance thresholds: ˙p ≤ 0.1, ∗p ≤ 0.01, ∗∗p ≤ 0.001, ∗∗∗p ≤ 0.0001.
Figure 2 Taxonomic and functional microbiota comparison of FMT recipients, with or without antibiotic treatment, post-FMT patients, and donors in the different studies Generalized linear mixed-effects models (GLMM, see STAR Methods) highlight differences in taxonomic and functional microbiota metrics between pre-FMTABx− (blue), pretreated pre-FMTABx+ (purple), Post-FMT (yellow), and donor (red) samples relative to a reference cohort of 739 healthy adults (gray line and area denote mean ± SD, respectively), based on the average distance to healthy control samples (β-diversity, Aitchison distance), the dysbiosis score,23 α-Diversity (Shannon index), and the cumulative relative abundance of oxygen-tolerant or oral bacterial species. Metadata abbreviations indicate pretreatment with ABx and lavage (+/−); single (+), two (++), or multiple (+++) FMTs; colonoscopic (C), nasogastric (NG), or gastroduodenal (GD) FMT route, enema (E), and pill/capsule (P) administration. Sample sizes (see STAR Methods for the reference cohort) are as shown in Figure 1A, excluding post-FMT samples from patients who have been exposed to antibiotics after FMT (OSU = 9, ZAR = 5, PAU = 4). Significant differences of the different sample types from healthy controls were determined for each metric and study separately with GLMMs. Asterisks denote significance thresholds: ˙p ≤ 0.1, ∗p ≤ 0.01, ∗∗p ≤ 0.001, ∗∗∗p ≤ 0.0001.CC BY · PubMed Central
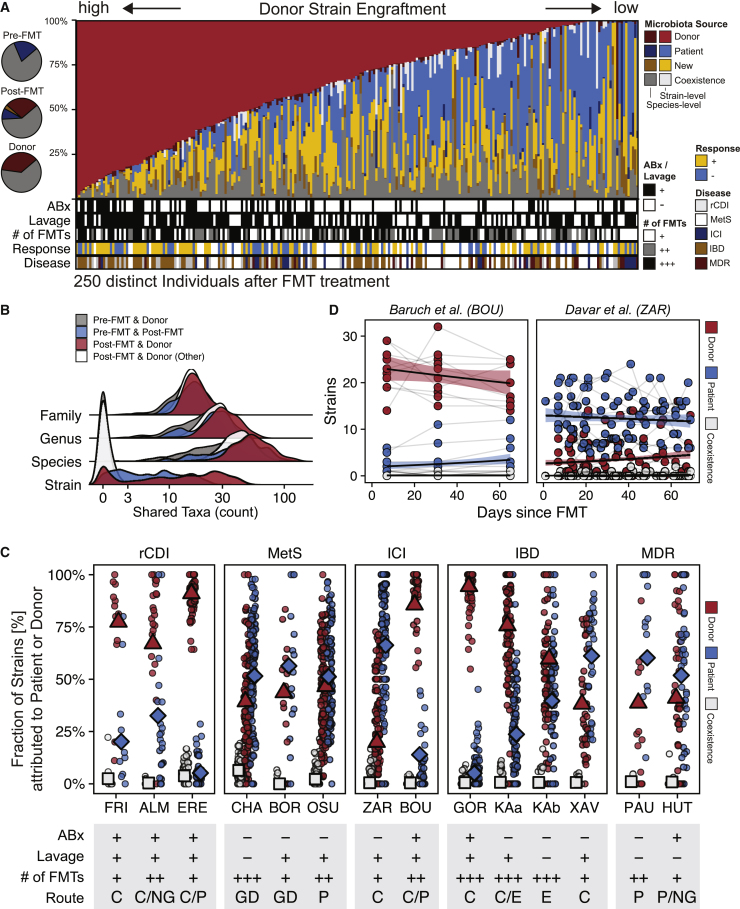
Figure 3 Strain profiling in FMT recipients showed substantial variation in donor strain engraftment between studies that are linked to FMT treatment modalities (A) Post-FMT microbiota relative abundance fractions contributed from donor (red), patient (blue), new (yellow), or coexisting (gray) strains, as detected in the last available post-FMT sample per patient. Darker colors refer to species-level relative abundance fractions if strains could not be resolved. Left: Circle chart showing average cumulative relative abundances of shared species in pre- and post-FMT patient and donor samples (gray) and between pre- and post-FMT patient (blue) and post-FMT patient and donor (red) samples. (B) Validation of SameStr’s specificity to infer donor strain engraftment from shared strain detection. Very few shared strains were identified between pre-FMT patient and donor (gray) and between unrelated post-FMT patient and donor (white) sample pairs, whereas strain sharing is frequent between pre- and post-FMT patient (blue) and between post-FMT patient and corresponding donor (red) sample pairs. The microbiota compositions of all sample pairs overlapped widely at higher taxonomic levels (family, genus, species). (C) Comparison of donor-derived (red), recipient-derived (blue), and coexisting (gray) strain fractions in post-FMT patient samples (of the sum of donor and recipient-derived strains) between disease groups and individual studies from the meta-cohort. Symbols denote the mean value of the latest available post-FMT sample per patient and across all cases of a study. Study metadata are shown as follows: Antibiotic (ABx) and bowel lavage patient pretreatment: Yes (+), No (−); Number of FMTs: single (+), two (++), or multiple (+++) rounds; FMT application: by colon (C), nasogastric (NG), or gastroduodenal (GD) endoscopy, enema (E), or pill/capsule (P). (D) Longitudinal comparison of donor-derived (red), patient-derived (blue), and coexisting (white) strain fractions in post-FMT samples from antibiotically pretreated (BOU) and non-pretreated (ZAR) ICI-refractory melanoma patients.
Figure 3 Strain profiling in FMT recipients showed substantial variation in donor strain engraftment between studies that are linked to FMT treatment modalities (A) Post-FMT microbiota relative abundance fractions contributed from donor (red), patient (blue), new (yellow), or coexisting (gray) strains, as detected in the last available post-FMT sample per patient. Darker colors refer to species-level relative abundance fractions if strains could not be resolved. Left: Circle chart showing average cumulative relative abundances of shared species in pre- and post-FMT patient and donor samples (gray) and between pre- and post-FMT patient (blue) and post-FMT patient and donor (red) samples. (B) Validation of SameStr’s specificity to infer donor strain engraftment from shared strain detection. Very few shared strains were identified between pre-FMT patient and donor (gray) and between unrelated post-FMT patient and donor (white) sample pairs, whereas strain sharing is frequent between pre- and post-FMT patient (blue) and between post-FMT patient and corresponding donor (red) sample pairs. The microbiota compositions of all sample pairs overlapped widely at higher taxonomic levels (family, genus, species). (C) Comparison of donor-derived (red), recipient-derived (blue), and coexisting (gray) strain fractions in post-FMT patient samples (of the sum of donor and recipient-derived strains) between disease groups and individual studies from the meta-cohort. Symbols denote the mean value of the latest available post-FMT sample per patient and across all cases of a study. Study metadata are shown as follows: Antibiotic (ABx) and bowel lavage patient pretreatment: Yes (+), No (−); Number of FMTs: single (+), two (++), or multiple (+++) rounds; FMT application: by colon (C), nasogastric (NG), or gastroduodenal (GD) endoscopy, enema (E), or pill/capsule (P). (D) Longitudinal comparison of donor-derived (red), patient-derived (blue), and coexisting (white) strain fractions in post-FMT samples from antibiotically pretreated (BOU) and non-pretreated (ZAR) ICI-refractory melanoma patients.CC BY · PubMed Central
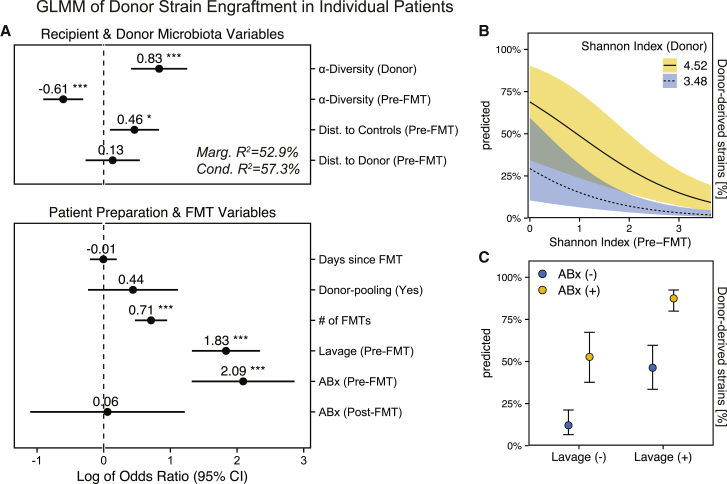
Figure 4 For individual patients, donor microbiota engraftment after FMT is dependent on patient and donor microbiota characteristics and clinical modalities of the FMT treatment (A) Forest plot showing the relevance of microbiota and clinical parameters for donor-derived strain fractions in post-FMT patients in the FMT meta-cohort, as determined with a generalized linear mixed model. The model is based on data from 254 clinical FMT cases, including samples from post-FMT patients (samples n = 801; FRI = 12, ALM = 24, ERE = 51, CHA = 105, BOR = 15, OSU = 112, ZAR = 146, BOU = 30, GOR = 58, KAa = 95, KAb = 63, XAV = 33, PAU = 13, HUT = 44), their respective donors (n = 140), and earliest available pre-FMT samples (n = 254). (B) Simulations with this model to determine the marginal effects of α-diversity on donor strain engraftment, i.e., using real values in combination with the minimum or maximum Shannon index detected in any donor in the FMT cohort (min/max within 95% confidence intervals), indicate a disproportionate impact of high-α-diversity donors on low-α-diversity FMT recipients. (C) Similar simulations predict independent marginal effects of ABx and lavage pretreatment on donor strain engraftment. Shaded areas and bars denote the 95% confidence intervals (Wald). Asterisks denote significance thresholds: ∗p ≤ 0.01, ∗∗p ≤ 0.001, ∗∗∗p ≤ 0.0001.
Figure 4 For individual patients, donor microbiota engraftment after FMT is dependent on patient and donor microbiota characteristics and clinical modalities of the FMT treatment (A) Forest plot showing the relevance of microbiota and clinical parameters for donor-derived strain fractions in post-FMT patients in the FMT meta-cohort, as determined with a generalized linear mixed model. The model is based on data from 254 clinical FMT cases, including samples from post-FMT patients (samples n = 801; FRI = 12, ALM = 24, ERE = 51, CHA = 105, BOR = 15, OSU = 112, ZAR = 146, BOU = 30, GOR = 58, KAa = 95, KAb = 63, XAV = 33, PAU = 13, HUT = 44), their respective donors (n = 140), and earliest available pre-FMT samples (n = 254). (B) Simulations with this model to determine the marginal effects of α-diversity on donor strain engraftment, i.e., using real values in combination with the minimum or maximum Shannon index detected in any donor in the FMT cohort (min/max within 95% confidence intervals), indicate a disproportionate impact of high-α-diversity donors on low-α-diversity FMT recipients. (C) Similar simulations predict independent marginal effects of ABx and lavage pretreatment on donor strain engraftment. Shaded areas and bars denote the 95% confidence intervals (Wald). Asterisks denote significance thresholds: ∗p ≤ 0.01, ∗∗p ≤ 0.001, ∗∗∗p ≤ 0.0001.CC BY · PubMed Central
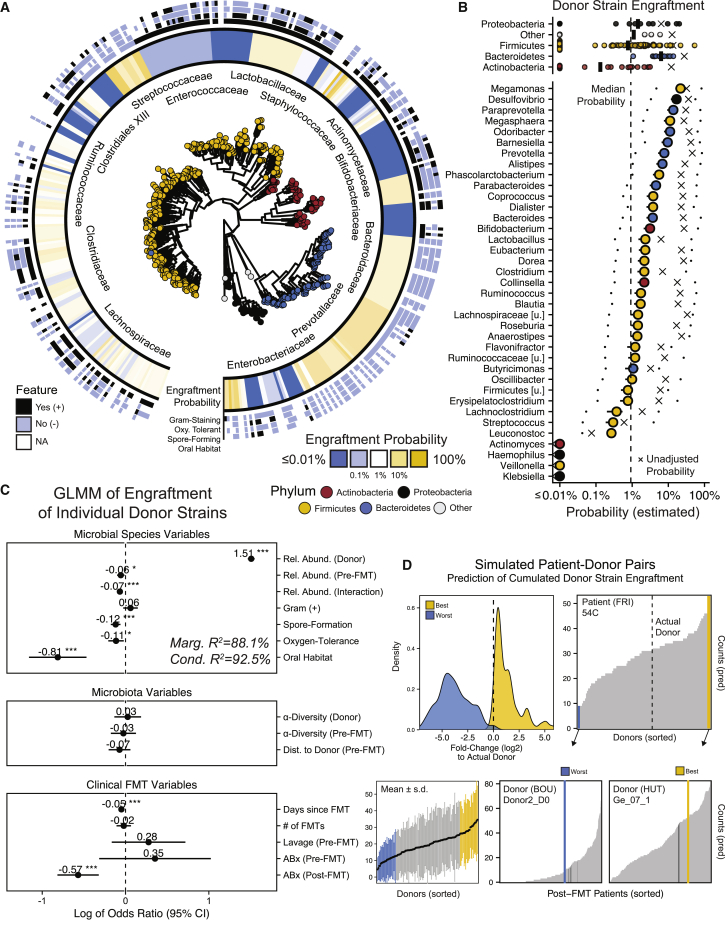
Figure 5 Donor strain engraftment probabilities for individual strains (A) GLMM-based estimated donor strain engraftment probabilities in relation to phylogeny and microbial species features (Gram-staining, spore formation, oxygen tolerance, oral habitat). (B) Median donor strain engraftment probabilities for different phyla (top) and genera (bottom), together with the estimated minimum and maximum probabilities, when using the lowest and highest species relative abundances that were detected in the meta-cohort as alternative input variables to the model. Crosses denote the donor strain engraftment probabilities without GLMM adjustments for the estimated influence of microbial, microbiota, and clinical FMT variables (see Figure 5C). (C) Species features (patient and donor), microbiota parameters, and clinical FMT variables with relevance for the engraftment of individual donor strains based on the GLMM. Bars denote 95% confidence intervals (Wald). Asterisks denote significance thresholds: ∗p ≤ 0.01, ∗∗p ≤ 0.001, ∗∗∗p ≤ 0.0001. (D) Total numbers of donor-derived strains in post-FMT patients, based on GLMM predictions for individual donor strains, vary substantially depending on recipient/donor pairing. Top left: They deviate ± 5-fold (log2) for the worst (blue) and best (yellow) simulated donor pair, relative to the actual recipient/donor pairs. Bottom left: Variations between different recipient/donor pairs for one donor (y axis range) generally exceed variations between different donors (x axis range). Black dots and bars: mean values ±SD. Top right, bottom middle, and right: Using patient 54C as an example, the predicted engraftment varies between <10 and >40 strains for different donors, but the worst (blue) and best (yellow) donors for this patient are predicted to also result in a broad range of engrafted donor strains in pairings with other patients. Dark lines indicate observations from actual recipient/donor pairings.
Figure 5 Donor strain engraftment probabilities for individual strains (A) GLMM-based estimated donor strain engraftment probabilities in relation to phylogeny and microbial species features (Gram-staining, spore formation, oxygen tolerance, oral habitat). (B) Median donor strain engraftment probabilities for different phyla (top) and genera (bottom), together with the estimated minimum and maximum probabilities, when using the lowest and highest species relative abundances that were detected in the meta-cohort as alternative input variables to the model. Crosses denote the donor strain engraftment probabilities without GLMM adjustments for the estimated influence of microbial, microbiota, and clinical FMT variables (see Figure 5C). (C) Species features (patient and donor), microbiota parameters, and clinical FMT variables with relevance for the engraftment of individual donor strains based on the GLMM. Bars denote 95% confidence intervals (Wald). Asterisks denote significance thresholds: ∗p ≤ 0.01, ∗∗p ≤ 0.001, ∗∗∗p ≤ 0.0001. (D) Total numbers of donor-derived strains in post-FMT patients, based on GLMM predictions for individual donor strains, vary substantially depending on recipient/donor pairing. Top left: They deviate ± 5-fold (log2) for the worst (blue) and best (yellow) simulated donor pair, relative to the actual recipient/donor pairs. Bottom left: Variations between different recipient/donor pairs for one donor (y axis range) generally exceed variations between different donors (x axis range). Black dots and bars: mean values ±SD. Top right, bottom middle, and right: Using patient 54C as an example, the predicted engraftment varies between <10 and >40 strains for different donors, but the worst (blue) and best (yellow) donors for this patient are predicted to also result in a broad range of engrafted donor strains in pairings with other patients. Dark lines indicate observations from actual recipient/donor pairings.CC BY · PubMed Central
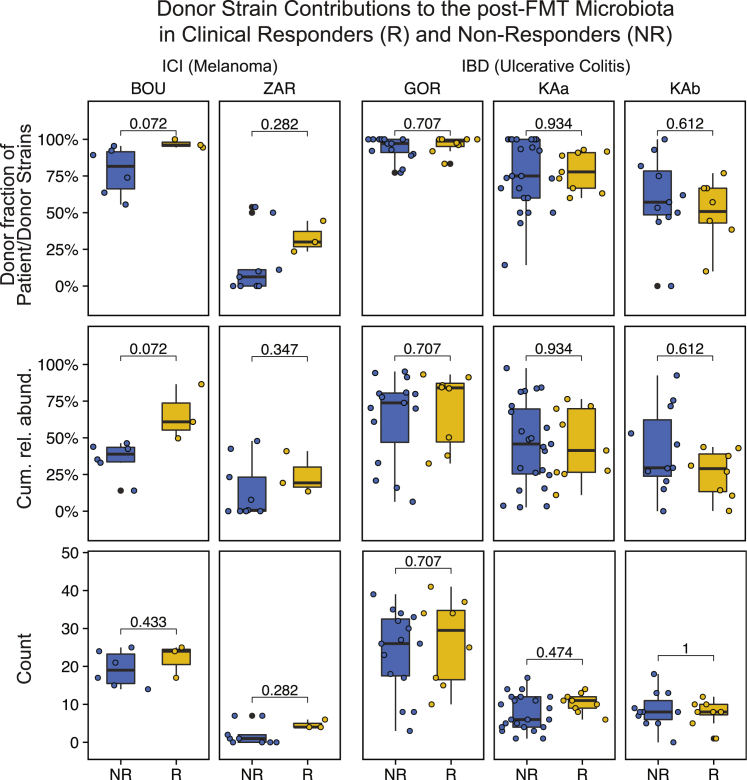
Figure 6 Donor microbiota engraftment and clinical response to FMT Responders (R, yellow) and non-responders (NR, blue) from two FMT trials to overcome resistance to anti-PD-1 therapy in ICI-refractory melanoma patients and two FMT trials to induce remission in IBD patients were compared based on donor-derived strain fractions (of recipient and donor-derived strains), cumulative relative abundances of species represented by donor-derived strains and total numbers of donor-derived strains in post-FMT samples (last available sample within ≤4 months after FMT). See STAR Methods for a description of R/NR numbers and definitions. IBD patients from the two study branches of Paramsothy et al.29, which applied different FMT protocols resulting in different levels of donor microbiota engraftment (Figure 3C), were compared separately; p-values based on the Wilcoxon test with false discovery rate (Benjamini-Hochberg) correction for multiple hypothesis testing within studies.
Figure 6 Donor microbiota engraftment and clinical response to FMT Responders (R, yellow) and non-responders (NR, blue) from two FMT trials to overcome resistance to anti-PD-1 therapy in ICI-refractory melanoma patients and two FMT trials to induce remission in IBD patients were compared based on donor-derived strain fractions (of recipient and donor-derived strains), cumulative relative abundances of species represented by donor-derived strains and total numbers of donor-derived strains in post-FMT samples (last available sample within ≤4 months after FMT). See STAR Methods for a description of R/NR numbers and definitions. IBD patients from the two study branches of Paramsothy et al.29, which applied different FMT protocols resulting in different levels of donor microbiota engraftment (Figure 3C), were compared separately; p-values based on the Wilcoxon test with false discovery rate (Benjamini-Hochberg) correction for multiple hypothesis testing within studies.CC BY · PubMed Central

Verification

Claims the paper makes

The claims and statistics of this paper haven’t been checked yet.

Run the check — free, no account needed. It reads the open-access text and checks the sources it cites.

A few free checks a day · papers already verified open instantly · results are public

Claims other papers make about this one

Each is checked against this paper’s own text: does it say what the citing paper says it does?

Self-check

Percentages, sums and reported differences re-computed from the paper’s own numbers.

The self-check needs the paper’s full text.

Citations

Cites

Show all 103 references

Research works printed but not linked: 3

  1. Watson, 2021, Adaptive ecological processes and metabolic independence drive microbial colonization and resilience in the human gut, bioRxiv
  2. Lê, 2008, FactoMineR: AnRPackage for multivariate analysis, J. Stat. Softw., 25
  3. Bates, 2015, Fitting linear mixed-effects models Usinglme4, J. Stat. Softw., 67

Cited by

Sorted by citations

Items 101–114 of 114

Metadata

Authors
Podlesny, D., Durdevic, M., Paramsothy, S., Kaakoush, N. O., Högenauer, C., Gorkiewicz, G., Walter, J., & Fricke, W. F.
Affiliations
  • University of Hohenheim (DE)
  • The University of Sydney (AU)
  • UNSW Sydney (AU)
  • Medical University of Graz (AT)
  • University College Cork (IE)
Corresponding author
  • Podlesny, Daniel
  • Fricke, W. Florian
Venue
Cell Reports Medicine
Publisher
Elsevier BV
Published
2022-08
Volume
3
Issue
8
Pages
100711
ISSN
2666-3791 (ISSN-L)
OpenAlex
W4289835872
Cited by
111
References
103
Citations by year
2026: 19 · 2025: 41 · 2024: 37 · 2023: 10 · 2022: 4
FWCI
7.76
Type
journal article
Language
en
Open access
Locations
  • Cell Reports Medicine (publishedVersion, cc-by)
  • medRxiv (acceptedVersion, cc-by-nd)
  • PubMed Central (publishedVersion, cc-by)
  • PubMed (publishedVersion)
Funders
  • Deutsche Forschungsgemeinschaft (316130265)
  • Austrian Science Fund (DK-MOLIN W1241)
Topics
  • Life Sciences › Biochemistry, Genetics and Molecular Biology › Molecular Biology › Gut microbiota and health
  • Health Sciences › Medicine › Infectious Diseases › Clostridium difficile and Clostridium perfringens research
  • Health Sciences › Medicine › Gastroenterology › Gastrointestinal motility and disorders
Keywords
fecal microbiota transplantation, microbiome assembly, dysbiosis, antibiotic pretreatment, alpha diversity, strain coexistence, oral microbiota, Gram-positive bacteria, oxygen tolerance
MeSH terms
Gastrointestinal Microbiome, Fecal Microbiota Transplantation, Clostridium Infections, Humans, Metagenomics, Dysbiosis

About these checks

Registry, retraction, Cites and statistics results are computed, not judged, with one exception: a printed reference that no index lists is read once by a model before it counts as a citation error. Claims are extracted by a model and kept only when their quote appears verbatim in the text; each cited source is then checked, with a model’s help, for whether it says what the claim relies on. Those verdicts can be wrong — read the claim’s quote and the cited source before relying on one.

Statistics and arithmetic are recomputed, not judged.

Confidence bands are shown only for fields calibrated on our annotated test set. None is calibrated yet, so no band is shown.

What counts as a claim ›How we measure confidence ›How we check this ›

Are you an author, or do you see a problem with this page? Request a review