

The DOI matches its Crossref record; 2 of the 2 references it cites were found in a registry or an index.
A high-throughput biocatalytic platform for screening isomeric kainoid natural products
Open accessPublished version of a preprint
Abstract
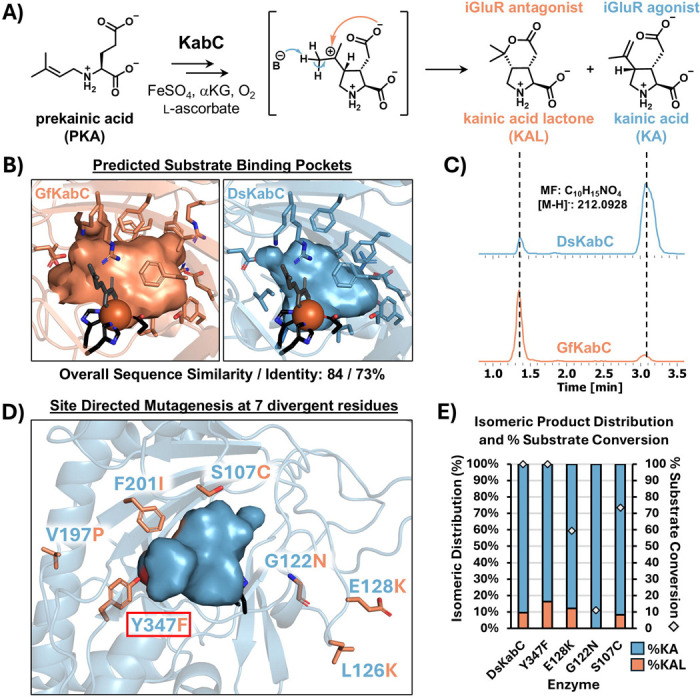
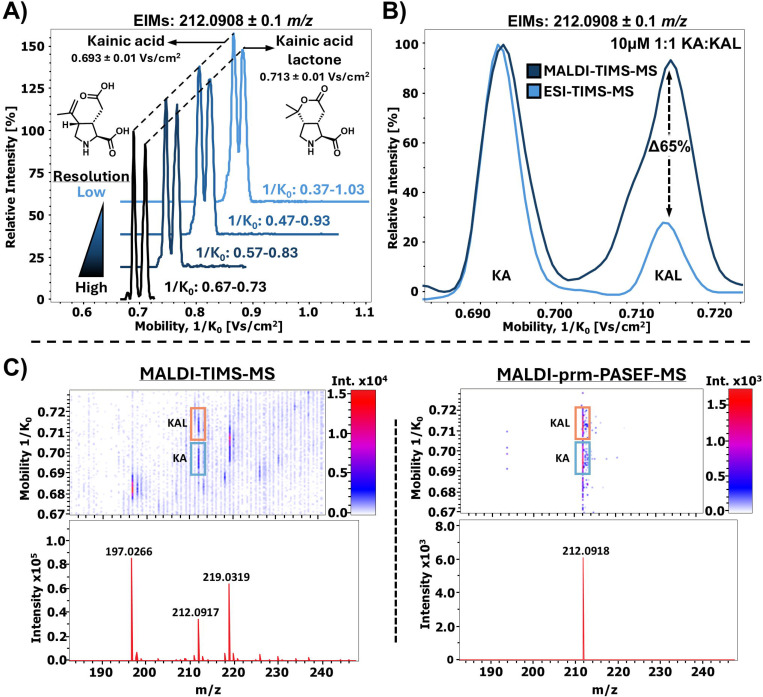
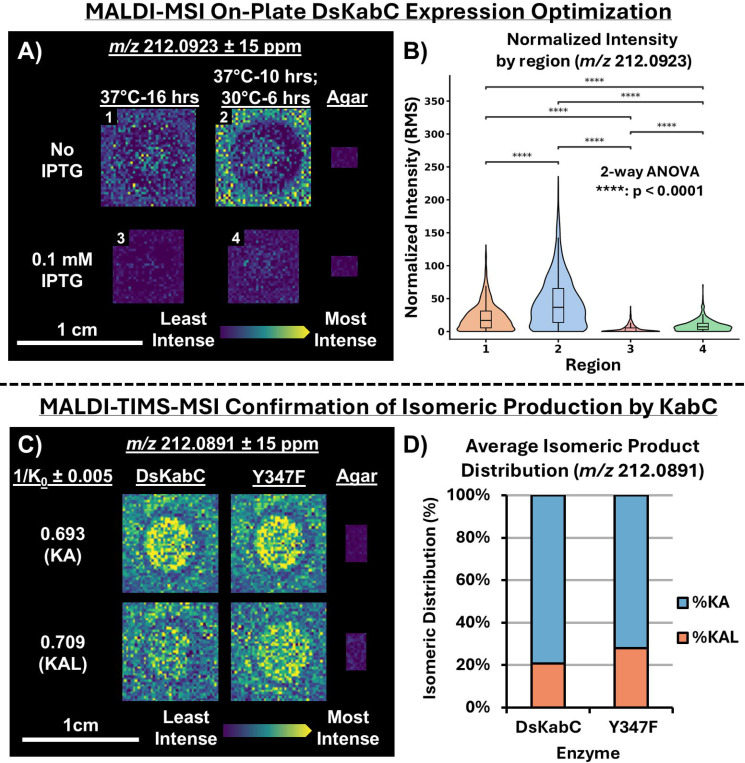
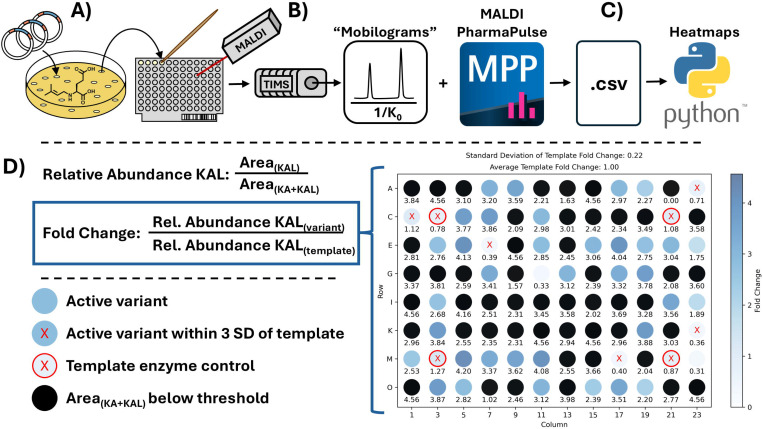
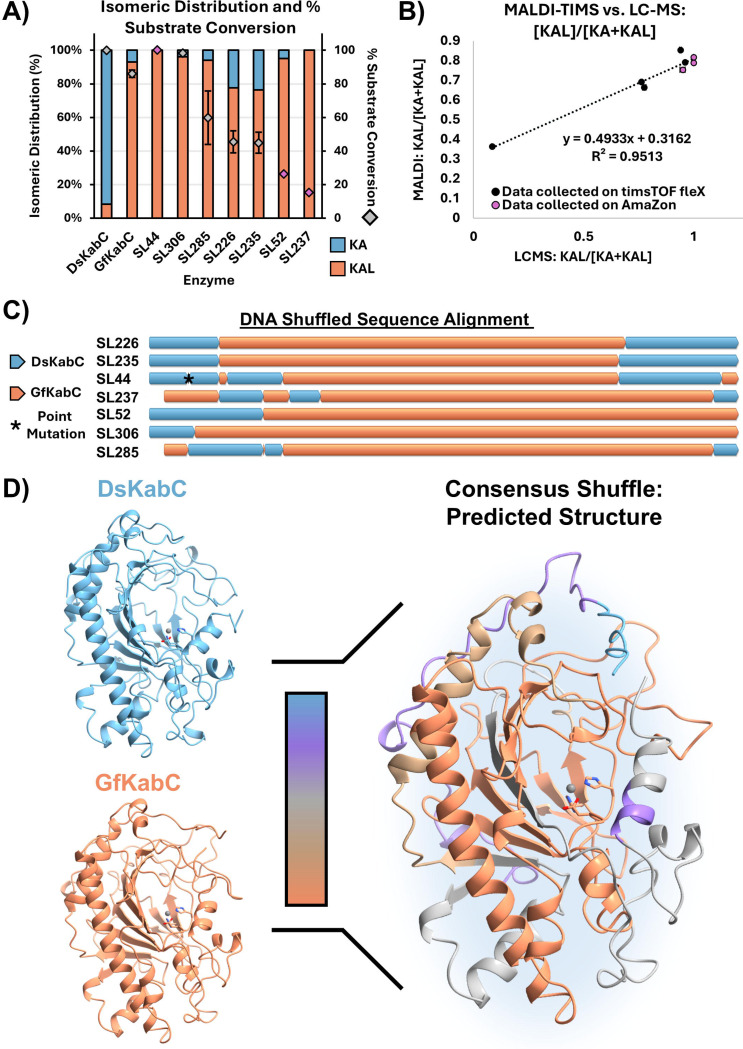
Random mutagenesis generates large, diverse enzyme libraries, however high-throughput screening is challenging when transformations yield isomeric small molecule products. We developed a matrix-assisted laser desorption/ionization-trapped ion mobility spectrometry-mass spectrometry (MALDI-TIMS-MS) platform for rapid, label-free screening of libraries of kainoid synthases, Fe/αKG-dependent cyclases that produce the isomeric neurotransmitters kainic acid (KA) and kainic acid lactone (KAL). This platform achieves near-baseline separation of KA and KAL directly from microbial biomass, with parallel reaction monitoring-PASEF (PRM-PASEF) enhancing signal-to-noise for isomeric product ratio analysis. Using this workflow, we screened a 318-variant DsKabC/GfKabC DNA shuffle library in under 30 minutes, identifying seven variants with improved KAL conversion. Two variants showed a near-complete shift toward KAL production with greater substrate consumption, while retaining favorable expression profiles compared to GfKabC. These results establish MALDI-TIMS-MS as a generalizable platform for high-throughput isomeric product screening and provides new kainoid synthase variants to probe structure-function relationships for further development as biocatalysts. Importantly, this screening approach can be broadly applied to interrogate enzyme variants acting on small molecules, delivering rapid and accurate quantitative insights without reliance on chromatography, enzyme purification, or substrate derivatization.
Overview
The claims and statistics of this paper haven’t been checked yet.
Run the check — free, no account needed. It reads the open-access text and checks the sources it cites.
Integrity signals
Registry
Cites
Statistics
Figures
Verification
Claims the paper makes
The claims and statistics of this paper haven’t been checked yet.
Run the check — free, no account needed. It reads the open-access text and checks the sources it cites.
Self-check
Percentages, sums and reported differences re-computed from the paper’s own numbers.
The self-check needs the paper’s full text.
Citations
Cites
Highly accurate protein structure prediction with AlphaFold
Jumper, J., Evans, R., Pritzel, A., Green, T., Figurnov, M., Ronneberger, O., Tunyasuvunakool, K., Bates, R., Žídek, A., Potapenko, A., et al. (2021) · Nature · doi:10.1038/s41586-021-03819-2 · Cited by 43,764
Accurate structure prediction of biomolecular interactions with AlphaFold 3
Abramson, J., Adler, J., Dunger, J., Evans, R., Green, T., Pritzel, A., Ronneberger, O., Willmore, L., Ballard, A. J., Bambrick, J., et al. (2024) · Nature · doi:10.1038/s41586-024-07487-w · Cited by 15,861
Research works printed but not linked: 67
- Xiao, 2015, High Throughput Screening and Selection Methods for Directed Enzyme Evolution, Ind. Eng. Chem. Res., 54, 4011, 10.1021/ie503060a · DOI
- Sellés Vidal, 2023, A Primer to Directed Evolution: Current Methodologies and Future Directions, RSC Chem. Biol., 4, 271, 10.1039/D2CB00231K · DOI
- Kan, 2017, Genetically Programmed Chiral Organoborane Synthesis, Nature, 552, 132, 10.1038/nature24996 · DOI
- McIntosh, 2013, Enantioselective Intramolecular C-H Amination Catalyzed by Engineered Cytochrome P450 Enzymes in Vitro and in Vivo, Angew. Chem. Int. Ed. Engl., 52, 9309, 10.1002/anie.201304401 · DOI
- Caen, 2018, High-Throughput Multiplexed Fluorescence-Activated Droplet Sorting, Microsyst. Nanoeng., 4, 33, 10.1038/s41378-018-0033-2 · DOI
- Vallejo, 2019, Fluorescence-Activated Droplet Sorting for Single-Cell Directed Evolution, ACS Synth. Biol., 8, 1430, 10.1021/acssynbio.9b00103 · DOI
- Delagrave, 2001, Application of a Very High-Throughput Digital Imaging Screen to Evolve the Enzyme Galactose Oxidase, Protein Eng., 14, 261, 10.1093/protein/14.4.261 · DOI
- Koné, 2009, Digital Screening Methodology for the Directed Evolution of Transglycosidases, Protein Eng. Des. Sel., 22, 37, 10.1093/protein/gzn065 · DOI
- Behrendorff, 2013, 2,2-Diphenyl-1-Picrylhydrazyl as a Screening Tool for Recombinant Monoterpene Biosynthesis, Microb. Cell Fact., 12, 76, 10.1186/1475-2859-12-76 · DOI
- Mack, 2008, A High-Throughput Microtiter Plate-Based Screening Method for the Detection of Full-Length Recombinant Proteins, Protein Expr. Purif., 61, 92, 10.1016/j.pep.2008.05.005 · DOI
- He, 2011, A High-Throughput Screening Strategy for Nitrile-Hydrolyzing Enzymes Based on Ferric Hydroxamate Spectrophotometry, Appl. Microbiol. Biotechnol., 89, 817, 10.1007/s00253-010-2977-5 · DOI
- Samorski, 2005, Quasi-Continuous Combined Scattered Light and Fluorescence Measurements: A Novel Measurement Technique for Shaken Microtiter Plates, Biotechnol. Bioeng., 92, 61, 10.1002/bit.20573 · DOI
- Duetz, 2007, Microtiter Plates as Mini-Bioreactors: Miniaturization of Fermentation Methods, Trends Microbiol., 15, 469, 10.1016/j.tim.2007.09.004 · DOI
- Shepherd, 2025, “Need for Speed: High Throughput” - Mass Spectrometry Approaches for High-Throughput Directed Evolution Screening of Natural Product Enzymes, Nat. Prod. Rep., 42, 1037, 10.1039/D4NP00053F · DOI
- Tao, 2022, Molecular Insights into the Unusually Promiscuous and Catalytically Versatile Fe(II)/α-Ketoglutarate-Dependent Oxygenase SptF, Nat. Commun., 13, 95, 10.1038/s41467-021-27636-3 · DOI
- Gao, 2018, Recent Examples of α-Ketoglutarate-Dependent Mononuclear Non-Haem Iron Enzymes in Natural Product Biosyntheses, Nat. Prod. Rep., 35, 792, 10.1039/C7NP00067G · DOI
- Hausinger, 2004, FeII/alpha-Ketoglutarate-Dependent Hydroxylases and Related Enzymes, Crit. Rev. Biochem. Mol. Biol., 39, 21, 10.1080/10409230490440541 · DOI · Paper page
- Hopiavuori, 2023, Algal Kainoid Synthases Exhibit Substrate-Dependent Hydroxylation and Cyclization Activities, ACS Chem. Biol., 18, 2457, 10.1021/acschembio.3c00596 · DOI
- Zwick, 2023, Overview of Amino Acid Modifications by Iron- and α-Ketoglutarate-Dependent Enzymes, ACS Catal., 13, 4853, 10.1021/acscatal.3c00424 · DOI
- Wu, 2016, Ferrous Iron and α-Ketoglutarate-Dependent Dioxygenases in the Biosynthesis of Microbial Natural Products, Biochim. Biophys. Acta, 1864, 453, 10.1016/j.bbapap.2016.01.012 · DOI
- Peters, 2019, Industrial Application of 2-Oxoglutarate-Dependent Oxygenases, Catalysts, 9, 221, 10.3390/catal9030221 · DOI
- Zhou, 2024, Characterization of Aziridine-Forming α-Ketoglutarate-Dependent Oxygenase in L-Isovaline Biosynthesis, Org. Lett., 26, 724, 10.1021/acs.orglett.3c04185 · DOI
- Hopiavuori, 2024, Expression, Purification, and Biochemical Characterization of Micro- and Macroalgal Kainoid Synthases, Methods Enzymol., 704, 233, 10.1016/bs.mie.2024.05.017 · DOI
- Steele, 2022, Domoic Acid Biosynthesis in the Red Alga Chondria Armata Suggests a Complex Evolutionary History for Toxin Production, Proc. Natl. Acad. Sci. USA, 119, 10.1073/pnas.2117407119 · DOI
- Chekan, 2019, Scalable Biosynthesis of the Seaweed Neurochemical, Kainic Acid, Angew. Chem. Int. Ed. Engl., 58, 8454, 10.1002/anie.201902910 · DOI
- Brunson, 2018, Biosynthesis of the Neurotoxin Domoic Acid in a Bloom-Forming Diatom, Science, 361, 1356, 10.1126/science.aau0382 · DOI
- Zheng, 2011, Kainic Acid-Induced Neurodegenerative Model: Potentials and Limitations, J. Biomed. Biotechnol., 2011
- Ben-Ari, 1979, A New Model of Focal Status Epilepticus: Intra-Amygdaloid Application of Kainic Acid Elicits Repetitive Secondarily Generalized Convulsive Seizures, Brain Res., 163, 176, 10.1016/0006-8993(79)90163-X · DOI
- Lévesque, 2013, The Kainic Acid Model of Temporal Lobe Epilepsy, Neurosci. Biobehav. Rev., 37, 2887, 10.1016/j.neubiorev.2013.10.011 · DOI
- Goldberg, 1981, Lactones Derived from Kainic Acid: Novel Selective Antagonists of Amino Acid-Induced Na+ Fluxes in Rat Striatum Slices, Neurosci. Lett., 23, 187, 10.1016/0304-3940(81)90038-0 · DOI
- Chen, 2025, Multiple Catalytic Branch Points in the Mechanism of Pyrrolidine Formation during Kainoid Biosynthesis Leads to Diverse Reaction Outcomes, J. Am. Chem. Soc., 147, 29961, 10.1021/jacs.5c07226 · DOI
- Pluchinsky, 2020, High Throughput Screening with SAMDI Mass Spectrometry for Directed Evolution, J. Am. Chem. Soc., 142, 19804, 10.1021/jacs.0c07828 · DOI
- Zhang, 2022, Directed Evolution of a Cyclodipeptide Synthase with New Activities via Label-Free Mass Spectrometric Screening, Chem. Sci., 13, 7581, 10.1039/D2SC01637K · DOI
- Xue, 2020, Optically Guided Mass Spectrometry to Screen Microbial Colonies for Directed Enzyme Evolution, Methods Enzymol., 644, 255, 10.1016/bs.mie.2020.04.054 · DOI
- Xu, 2021, Mapping Enzyme Catalysis with Metabolic Biosensing, Nat. Commun., 12, 6803, 10.1038/s41467-021-27185-9 · DOI
- Heap, 2017, Identifying Inhibitors of Inflammation: A Novel High-Throughput MALDI-TOF Screening Assay for Salt-Inducible Kinases (SIKs), SLAS Discov., 22, 1193, 10.1177/2472555217717473 · DOI
- Enjalbal, 2005, MALDI-TOF MS Analysis of Soluble PEG Based Multi-Step Synthetic Reaction Mixtures with Automated Detection of Reaction Failure, J. Am. Soc. Mass Spectrom., 16, 670, 10.1016/j.jasms.2005.01.020 · DOI
- McLuckie, 2006, Development of a Novel Site-Specific Mutagenesis Assay Using MALDI-ToF MS (SSMA-MS), Nucleic Acids Res., 34, 10.1093/nar/gkl745 · DOI
- Xue, 2020, A Mass Spectrometry-Based High-Throughput Screening Method for Engineering Fatty Acid Synthases with Improved Production of Medium-Chain Fatty Acids, Biotechnol. Bioeng., 117, 2131, 10.1002/bit.27343 · DOI
- Choe, 2023, MALDI-MS Screening of Microbial Colonies with Isomer Resolution to Select Fatty Acid Desaturase Variants, Anal. Biochem., 672, 10.1016/j.ab.2023.115169 · DOI
- Stauber, 2010, On-Tissue Protein Identification and Imaging by MALDI-Ion Mobility Mass Spectrometry, J. Am. Soc. Mass Spectrom., 21, 338, 10.1016/j.jasms.2009.09.016 · DOI
- Heuckeroth, 2023, On-Tissue Dataset-Dependent MALDI-TIMS-MS2 Bioimaging, Nat. Commun., 14, 7495, 10.1038/s41467-023-43298-9 · DOI
- Djambazova, 2024, MALDI TIMS IMS Reveals Ganglioside Molecular Diversity within Murine S. Aureus Kidney Tissue Abscesses, J. Am. Soc. Mass Spectrom., 35, 1692, 10.1021/jasms.4c00089 · DOI
- Spraggins, 2019, High-Performance Molecular Imaging with MALDI Trapped Ion-Mobility Time-of-Flight (timsTOF) Mass Spectrometry, Anal. Chem., 91, 14552, 10.1021/acs.analchem.9b03612 · DOI
- Djambazova, 2023, MALDI TIMS IMS of Disialoganglioside Isomers─GD1a and GD1b in Murine Brain Tissue, Anal. Chem., 95, 1176
- Djambazova, 2020, Resolving the Complexity of Spatial Lipidomics Using MALDI TIMS Imaging Mass Spectrometry, Anal. Chem., 92, 13290, 10.1021/acs.analchem.0c02520 · DOI
- Valentine, 2003, A Split-Field Drift Tube for Separation and Efficient Fragmentation of Biomolecular Ions, Anal. Chem., 75, 6202, 10.1021/ac030111r · DOI
- Dodds, 2019, Ion Mobility Spectrometry: Fundamental Concepts, Instrumentation, Applications, and the Road Ahead, J. Am. Soc. Mass Spectrom., 30, 2185, 10.1007/s13361-019-02288-2 · DOI
- Borsdorf, 2006, Ion Mobility Spectrometry: Principles and Applications, Appl. Spectrosc. Rev., 41, 323, 10.1080/05704920600663469 · DOI
- Kissman, 2023, Biocatalytic Control of Site-Selectivity and Chain Length-Selectivity in Radical Amino Acid Halogenases, Proc. Natl. Acad. Sci. USA, 120, 10.1073/pnas.2214512120 · DOI
- Michelmann, 2015, Fundamentals of Trapped Ion Mobility Spectrometry, J. Am. Soc. Mass Spectrom., 26, 14, 10.1007/s13361-014-0999-4 · DOI
- Silveira, 2016, Altering the Mobility-Time Continuum: Nonlinear Scan Functions for Targeted High Resolution Trapped Ion Mobility-Mass Spectrometry, Int. J. Ion Mobil. Spectrom., 19, 87, 10.1007/s12127-016-0196-1 · DOI
- Benigni, 2018, Increasing Analytical Separation and Duty Cycle with Nonlinear Analytical Mobility Scan Functions in TIMS-FT-ICR MS, Anal. Chem., 90, 2446, 10.1021/acs.analchem.7b04053 · DOI
- Ross, 2020, Breaking down Structural Diversity for Comprehensive Prediction of Ion-Neutral Collision Cross Sections, Anal. Chem., 92, 4548, 10.1021/acs.analchem.9b05772 · DOI
- Shepherd, 2025, MALDI-TIMS-MS2 Imaging and Annotation of Natural Products in Fungal-Bacterial Coculture, Anal. Chem., 97, 18867, 10.1021/acs.analchem.5c02787 · DOI
- Packer, 2015, Methods for the Directed Evolution of Proteins, Nat. Rev. Genet., 16, 379, 10.1038/nrg3927 · DOI
- Knox, 2025, Direct Analysis of Biotransformations with Mass Spectrometry-DiBT-MS, Nat. Protoc., 20, 3295, 10.1038/s41596-025-01161-9 · DOI
- Clark, 2018, Coupling MALDI-TOF Mass Spectrometry Protein and Specialized Metabolite Analyses to Rapidly Discriminate Bacterial Function, Proc. Natl. Acad. Sci. USA, 115, 4981, 10.1073/pnas.1801247115 · DOI
- Fang, 2014, Emerging Mass Spectrometry Techniques for the Direct Analysis of Microbial Colonies, Curr. Opin. Microbiol., 19, 120, 10.1016/j.mib.2014.06.014 · DOI
- Clark, 2019, Using the Open-Source MALDI TOF-MS IDBac Pipeline for Analysis of Microbial Protein and Specialized Metabolite Data, J. Vis. Exp., 147
- Dubendorff, 1991, Controlling Basal Expression in an Inducible T7 Expression System by Blocking the Target T7 Promoter with Lac Repressor, J. Mol. Biol., 219, 45, 10.1016/0022-2836(91)90856-2 · DOI
- Neugebauer, 2022, Reaction Pathway Engineering Converts a Radical Hydroxylase into a Halogenase, Nat. Chem. Biol., 18, 171, 10.1038/s41589-021-00944-x · DOI
- Yang, 2024, Engineering the Reaction Pathway of a Non-Heme Iron Oxygenase Using Ancestral Sequence Reconstruction, J. Am. Chem. Soc., 146, 34352, 10.1021/jacs.4c08420 · DOI
- Papadopoulou, 2023, Engineering Fe(II)/α-Ketoglutarate-Dependent Halogenases and Desaturases, Biochemistry, 62, 229, 10.1021/acs.biochem.2c00115 · DOI
- Nie, 2023, Ultra-High-Throughput Mapping of the Chemical Space of Asymmetric Catalysis Enables Accelerated Reaction Discovery, Nat. Commun., 14, 6671, 10.1038/s41467-023-42446-5 · DOI
- Yang, 2012, Primer on Agar-Based Microbial Imaging Mass Spectrometry, J. Bacteriol., 194, 6023, 10.1128/JB.00823-12 · DOI
- Lusk, 2022, Home-Built Spinning Apparatus for Drying Agarose-Based Imaging Mass Spectrometry Samples, J. Am. Soc. Mass Spectrom., 33, 1325, 10.1021/jasms.2c00044 · DOI
Metadata
- Authors
- Shepherd, R. A., Ramachandra, M., Hopiavuori, A. R., Jones, M. C., Fihn, C. A., Tabag, A. J., Manjunath, A., Gad, L. Y., Whipple, C. R., McKinnie, S. M. K., & Sanchez, L. M.
- Affiliations
- University of California, Santa Cruz (US)
- Corresponding author
- McKinnie, Shaun M.K.
- Sanchez, Laura M.
- ORCID
- Venue
- Cell Reports Physical Science
- Publisher
- Elsevier BV
- Published
- 2026-02
- Volume
- 7
- Issue
- 2
- Pages
- 103092
- ISSN
- 2666-3864 (ISSN-L)
- PMC
- PMC12633004
- OpenAlex
- W7127981111
- Cited by
- 2
- References
- 2
- Citations by year
- 2026: 2
- FWCI
- 4.13
- Type
- journal article
- Language
- en
- Open access
- gold
- doi.org
- Licence
- Locations
- Cell Reports Physical Science (publishedVersion, cc-by)
- bioRxiv (Cold Spring Harbor Laboratory) (acceptedVersion, cc-by-nc-nd)
- PubMed (publishedVersion)
- PubMed Central (publishedVersion, cc-by)
- Europe PMC (PubMed Central) (submittedVersion, cc-by-nc-nd)
- Funders
- National Science Foundation Division of Integrative Organismal Systems
- National Science Foundation (IOS-2220510)
- Office of the President, University of California
- National Institutes of Health
- University of California
- National Institute of General Medical Sciences (K12GM139185, R21GM148870)
- Topics
- Life Sciences › Biochemistry, Genetics and Molecular Biology › Molecular Biology › Enzyme Catalysis and Immobilization
- Physical Sciences › Chemistry › Spectroscopy › Mass Spectrometry Techniques and Applications
- Life Sciences › Immunology and Microbiology › Applied Microbiology and Biotechnology › Microbial Natural Products and Biosynthesis
- Keywords
- kainic acid, high-throughput enzyme screening, structure-function relationship, enzyme stability
About these checks
Registry, retraction, Cites and statistics results are computed, not judged, with one exception: a printed reference that no index lists is read once by a model before it counts as a citation error. Claims are extracted by a model and kept only when their quote appears verbatim in the text; each cited source is then checked, with a model’s help, for whether it says what the claim relies on. Those verdicts can be wrong — read the claim’s quote and the cited source before relying on one.
Statistics and arithmetic are recomputed, not judged.
Confidence bands are shown only for fields calibrated on our annotated test set. None is calibrated yet, so no band is shown.
What counts as a claim ›How we measure confidence ›How we check this ›
Are you an author, or do you see a problem with this page? Request a review
How to cite
Cite CoChat for the checks on this page, and the paper for its own findings.
- This page
- CoChat. (2026). Citation check: A high-throughput biocatalytic platform for screening isomeric kainoid natural products. https://app.cochat.ai/papers/10.1016/j.xcrp.2025.103092
- The paper
- Shepherd, R. A., Ramachandra, M., Hopiavuori, A. R., Jones, M. C., Fihn, C. A., Tabag, A. J., Manjunath, A., Gad, L. Y., Whipple, C. R., McKinnie, S. M. K., & Sanchez, L. M. (2026). A high-throughput biocatalytic platform for screening isomeric kainoid natural products. Cell Reports Physical Science. https://doi.org/10.1016/j.xcrp.2025.103092
