Cited by 80

The DOI matches its Crossref record; 2 of the 2 references it cites were found in a registry or an index.

Machine-learning from Pseudomonas putida KT2440 transcriptomes reveals its transcriptional regulatory network

Lim, Hyun Gyu, Rychel, Kevin, Sastry, Anand V., Bentley, Gayle J., Mueller, Joshua, Schindel, Heidi S., Larsen, Peter E., Laible, Philip D., Guss, Adam M., Niu, Wei, Johnson, Christopher W., Beckham, Gregg T., Feist, Adam M., Palsson, Bernhard O.·2022·Metabolic Engineering

Published version of a preprint

Overview

The claims and statistics of this paper haven’t been checked yet.

Run the check — free, no account needed. It reads the open-access text and checks the sources it cites.

A few free checks a day · papers already verified open instantly · results are public

Integrity signals

Registry

Crossref · 10.1016/j.ymben.2022.04.004

Cites

2 of 2 references verified0 citation errors · 0 not checkable

Statistics

Figures

Image 1
CC-BY · From the PDF
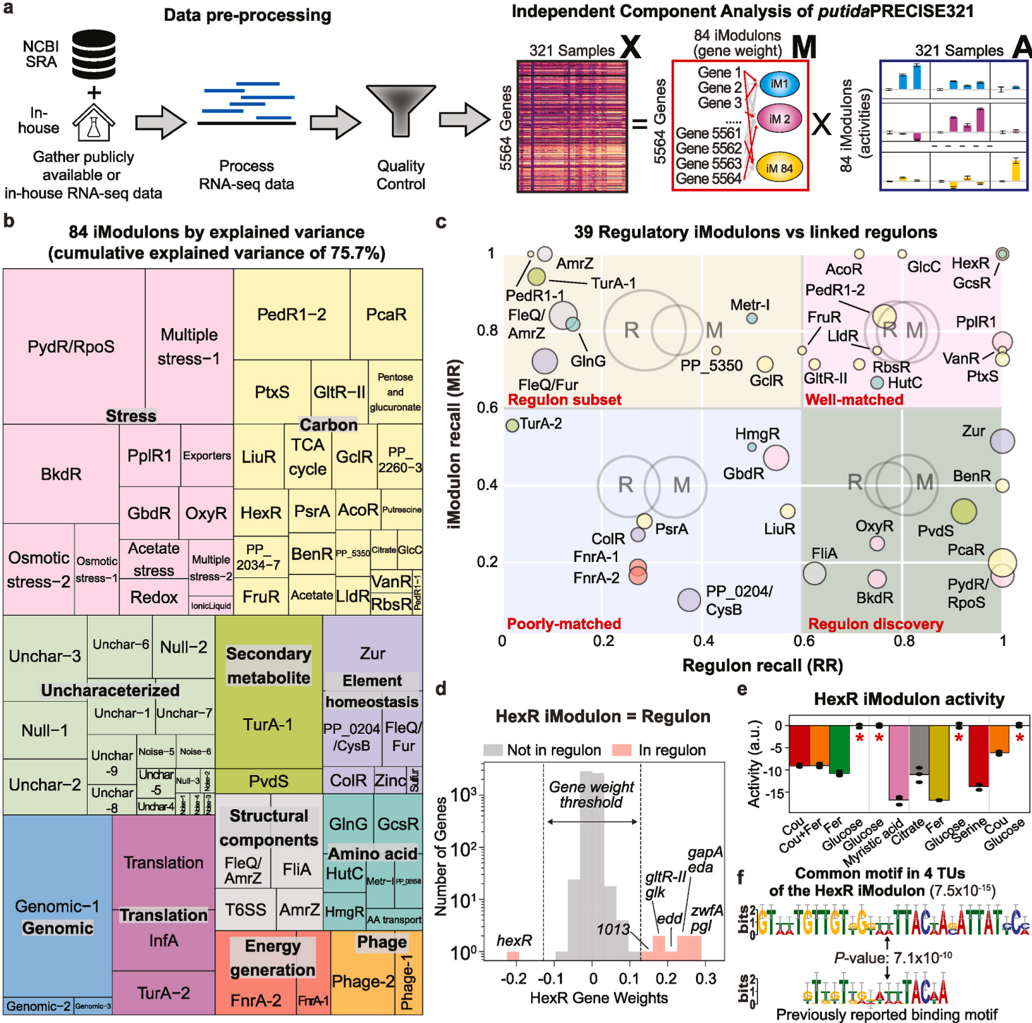
Fig. 1 Independent component analysis (ICA) of the putida PRECISE321 transcriptome compendium. (a) Overall data processing pipeline for independent component analysis (ICA) of putida PRECISE321. By performing ICA, the gene expression profiles [X] (5564 genes by 321 conditions) were deconvoluted into an [M] matrix containing weights of 5564 genes for each of the 84 iModulon identified, and an [A] matrix containing iModulon activities for each condition. A part of this diagram was adapted from Sastry et al. (2021). (b) A treemap of P. putida ' s 84 iModulons. The size of each rectangle indicates the explained variances in the data sets attributable to each iModulon. (c) Bottom-up vs top-down assessment of co-regulated genes (i.e, bio-molecular vs data-driven). The scatter plot shows Regulon Recalls (RR) and iModulon Recalls (IR) for 39 regulatory iModulons. For iModulons with names consisting of two regulators, RR and IR are the values of the first regulator. Colors indicate iModulon types. (d) An example of a well-matched case: HexR. Gene weights of the HexR iModulon. (e) Condition-dependent HexR iModulon activities with the supplementation of different carbon sources. Asterisks indicate the reference conditions (glucose minimal media). It should be noted that each project (separated by gray lines) was normalized to its unique control condition (Supplementary Data) to remove batch effects, so activity values from different projects should not be directly compared. (f) Enriched motif (top) from the upstream of HexR-regulating genes and previously reported HexR binding site (bottom, obtained from CollectTF (Kiliç et al., 2014)).
Fig. 1 Independent component analysis (ICA) of the putida PRECISE321 transcriptome compendium. (a) Overall data processing pipeline for independent component analysis (ICA) of putida PRECISE321. By performing ICA, the gene expression profiles [X] (5564 genes by 321 conditions) were deconvoluted into an [M] matrix containing weights of 5564 genes for each of the 84 iModulon identified, and an [A] matrix containing iModulon activities for each condition. A part of this diagram was adapted from Sastry et al. (2021). (b) A treemap of P. putida ' s 84 iModulons. The size of each rectangle indicates the explained variances in the data sets attributable to each iModulon. (c) Bottom-up vs top-down assessment of co-regulated genes (i.e, bio-molecular vs data-driven). The scatter plot shows Regulon Recalls (RR) and iModulon Recalls (IR) for 39 regulatory iModulons. For iModulons with names consisting of two regulators, RR and IR are the values of the first regulator. Colors indicate iModulon types. (d) An example of a well-matched case: HexR. Gene weights of the HexR iModulon. (e) Condition-dependent HexR iModulon activities with the supplementation of different carbon sources. Asterisks indicate the reference conditions (glucose minimal media). It should be noted that each project (separated by gray lines) was normalized to its unique control condition (Supplementary Data) to remove batch effects, so activity values from different projects should not be directly compared. (f) Enriched motif (top) from the upstream of HexR-regulating genes and previously reported HexR binding site (bottom, obtained from CollectTF (Kiliç et al., 2014)).CC-BY · From the PDF
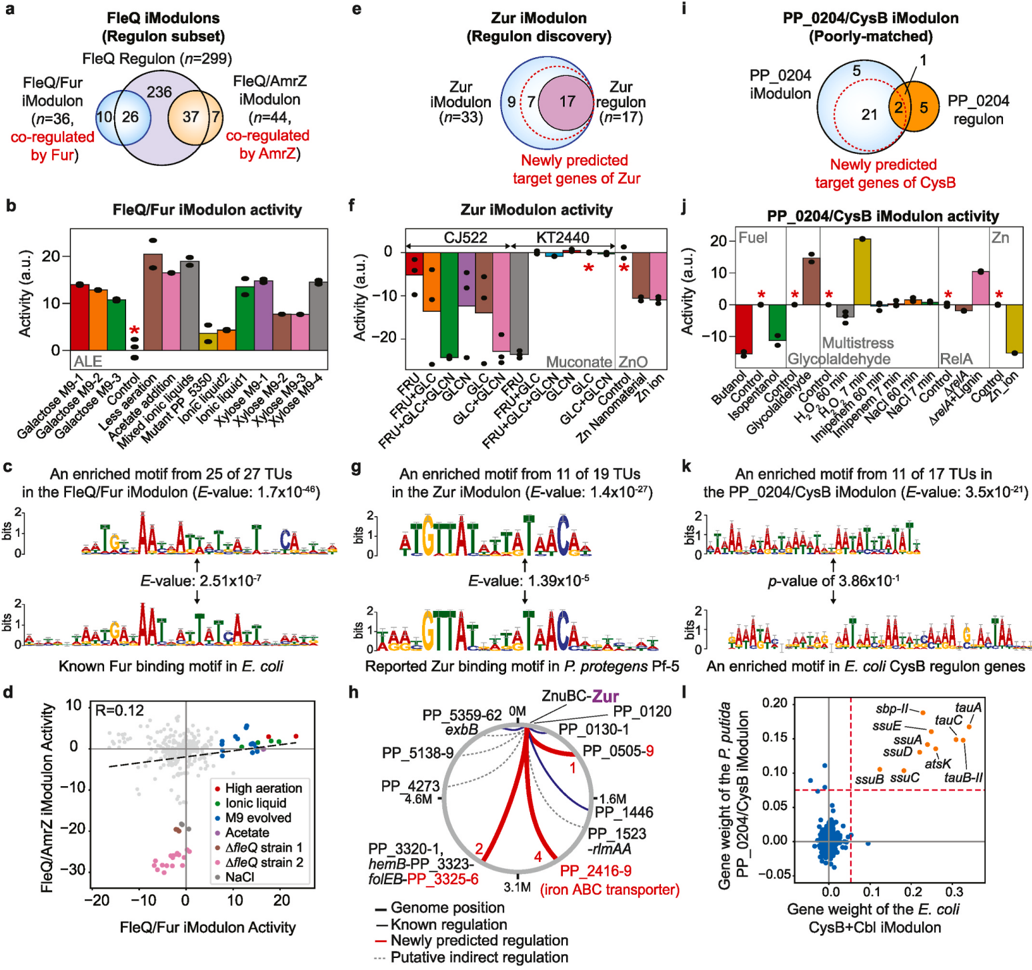
Fig. 2 iModulons allow data-driven curation of the TRN in P. putida . (a-d) Characteristics of the FleQ regulon subset iModulons. (a) A Venn diagram of the two FleQ iModulons, FleQ/Fur and FleQ/AmrZ, and the FleQ regulon. (b) An activity plot of the FleQ/Fur iModulon in selected conditions. (c) Comparison of a motif found in the upstream regions of the FleQ/Fur iModulon genes and previously known binding motifs of Fur in E. coli (obtained from CollectTF (Kiliç et al., 2014)). The common motif was enriched from 25 out of 27 TUs (94.4% of the genes) in the FleQ/Fur iModulon. (d) A scatter plot of activities of the FleQ/Fur and FleQ/AmrZ iModulons for all conditions. The Pearson correlation of the two iModulon activities was 0.12. Selected samples with high activities were colored and growth conditions were indicated in the inset. Activities of the FleQ/AmrZ iModulon changed when fl eQ was deleted or an excess amount of NaCl was added. (e -h) Characteristics of the Zur regulon discovery iModulon. (e) A Venn diagram of the Zur iModulon and related Zur regulon. (f) An activity plot of the Zur iModulon in selected conditions. High activities of the Zur iModulon were observed when zinc ion or nanomaterial was added. The CJ522 strain is an engineered P. putida KT2440 strain Δ catRBCA ::Ptac: catA Δ pcaHG ::Ptac: aroY : ecdB : asbF Δ pykA :: aroG D146N : aroY : ecdB : asbF Δ pykF Δ ppc Δ pgi -1 Δ pgi -2 Δ gcd (Johnson et al., 2019). (g) Comparison with an enriched motif from 11 TUs in the Zur iModulon (66.7% of the total genes) and a previously reported P. protegens Pf-5 Zur binding motif (obtained from CollectTF (Kiliç et al., 2014)). (h) A schematic diagram of regulation by Zur. Previously known regulations were colored in black while newly predicted regulations were colored in red. Potential indirect regulations were indicated with dashed gray lines. (i -l) Characteristics of the PP_0204 poorly-matched iModulon. (i) A Venn diagram of the PP_0204/CysB iModulon and PP_0204 regulon. (j) An activity plot of the PP_0204 iModulon in selected conditions. Asterisks indicate the reference conditions. (k) Comparison with an enriched motif from 11 TUs in the PP_0204 iModulon and an enriched motif from 14 TUs in the E. coli CysB regulon (obtained from RegulonDB (Santos-Zavaleta et al., 2019)) (l) Gene weight correlation of the PP_0204/CysB iModulon and the Cbl + CysB iModulon of E. coli. The dashed lines indicate the threshold values (0.054 and 0.075) for E. coli and P. putida to determine iModulon member genes. See Methods for the calculation. (a, e, and i) Gene numbers were shown in these diagrams. (b, f, and j) Asterisks indicate the reference conditions.
Fig. 2 iModulons allow data-driven curation of the TRN in P. putida . (a-d) Characteristics of the FleQ regulon subset iModulons. (a) A Venn diagram of the two FleQ iModulons, FleQ/Fur and FleQ/AmrZ, and the FleQ regulon. (b) An activity plot of the FleQ/Fur iModulon in selected conditions. (c) Comparison of a motif found in the upstream regions of the FleQ/Fur iModulon genes and previously known binding motifs of Fur in E. coli (obtained from CollectTF (Kiliç et al., 2014)). The common motif was enriched from 25 out of 27 TUs (94.4% of the genes) in the FleQ/Fur iModulon. (d) A scatter plot of activities of the FleQ/Fur and FleQ/AmrZ iModulons for all conditions. The Pearson correlation of the two iModulon activities was 0.12. Selected samples with high activities were colored and growth conditions were indicated in the inset. Activities of the FleQ/AmrZ iModulon changed when fl eQ was deleted or an excess amount of NaCl was added. (e -h) Characteristics of the Zur regulon discovery iModulon. (e) A Venn diagram of the Zur iModulon and related Zur regulon. (f) An activity plot of the Zur iModulon in selected conditions. High activities of the Zur iModulon were observed when zinc ion or nanomaterial was added. The CJ522 strain is an engineered P. putida KT2440 strain Δ catRBCA ::Ptac: catA Δ pcaHG ::Ptac: aroY : ecdB : asbF Δ pykA :: aroG D146N : aroY : ecdB : asbF Δ pykF Δ ppc Δ pgi -1 Δ pgi -2 Δ gcd (Johnson et al., 2019). (g) Comparison with an enriched motif from 11 TUs in the Zur iModulon (66.7% of the total genes) and a previously reported P. protegens Pf-5 Zur binding motif (obtained from CollectTF (Kiliç et al., 2014)). (h) A schematic diagram of regulation by Zur. Previously known regulations were colored in black while newly predicted regulations were colored in red. Potential indirect regulations were indicated with dashed gray lines. (i -l) Characteristics of the PP_0204 poorly-matched iModulon. (i) A Venn diagram of the PP_0204/CysB iModulon and PP_0204 regulon. (j) An activity plot of the PP_0204 iModulon in selected conditions. Asterisks indicate the reference conditions. (k) Comparison with an enriched motif from 11 TUs in the PP_0204 iModulon and an enriched motif from 14 TUs in the E. coli CysB regulon (obtained from RegulonDB (Santos-Zavaleta et al., 2019)) (l) Gene weight correlation of the PP_0204/CysB iModulon and the Cbl + CysB iModulon of E. coli. The dashed lines indicate the threshold values (0.054 and 0.075) for E. coli and P. putida to determine iModulon member genes. See Methods for the calculation. (a, e, and i) Gene numbers were shown in these diagrams. (b, f, and j) Asterisks indicate the reference conditions.CC-BY · From the PDF
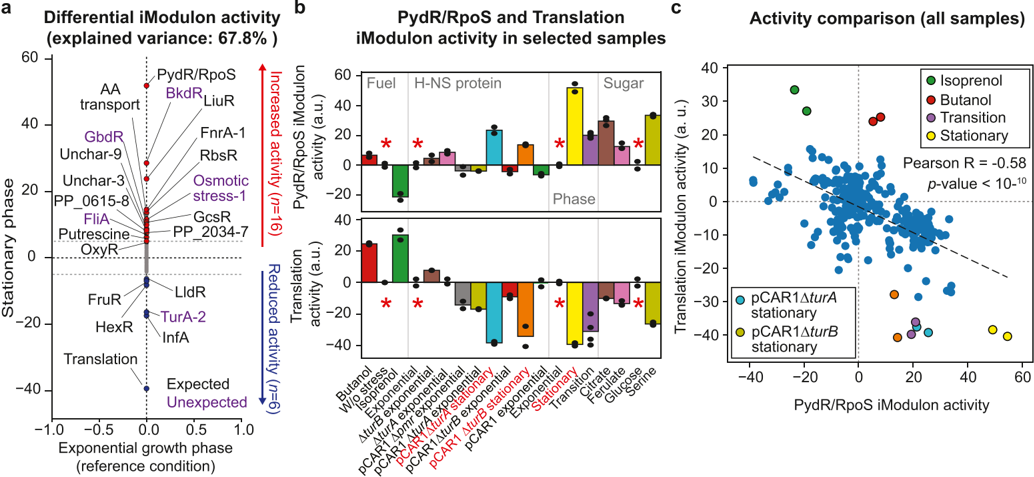
Fig. 3 iModulons describe global transcriptional changes after the transition from the growth phase to the stationary phase. (a) Differentially changed iModulon activities during the transition from the exponential growth phase to the stationary phase at a threshold of 5 and an FDR of 0.05. Unexpected changes were colored in purple. (b) Activities of the PydR/RpoS and Translation iModulons in selected samples. Project names are colored in gray. Asterisks indicate the reference conditions for each project. (c) Activity correlation of the PydR/RpoS and Translation iModulons. Activity of these two iModulons showed a negative correlation across samples (Pearson correlation coefficient R of 0.58, p -value < 1 × 10 10 ).
Fig. 3 iModulons describe global transcriptional changes after the transition from the growth phase to the stationary phase. (a) Differentially changed iModulon activities during the transition from the exponential growth phase to the stationary phase at a threshold of 5 and an FDR of 0.05. Unexpected changes were colored in purple. (b) Activities of the PydR/RpoS and Translation iModulons in selected samples. Project names are colored in gray. Asterisks indicate the reference conditions for each project. (c) Activity correlation of the PydR/RpoS and Translation iModulons. Activity of these two iModulons showed a negative correlation across samples (Pearson correlation coefficient R of 0.58, p -value < 1 × 10 10 ).CC-BY · From the PDF
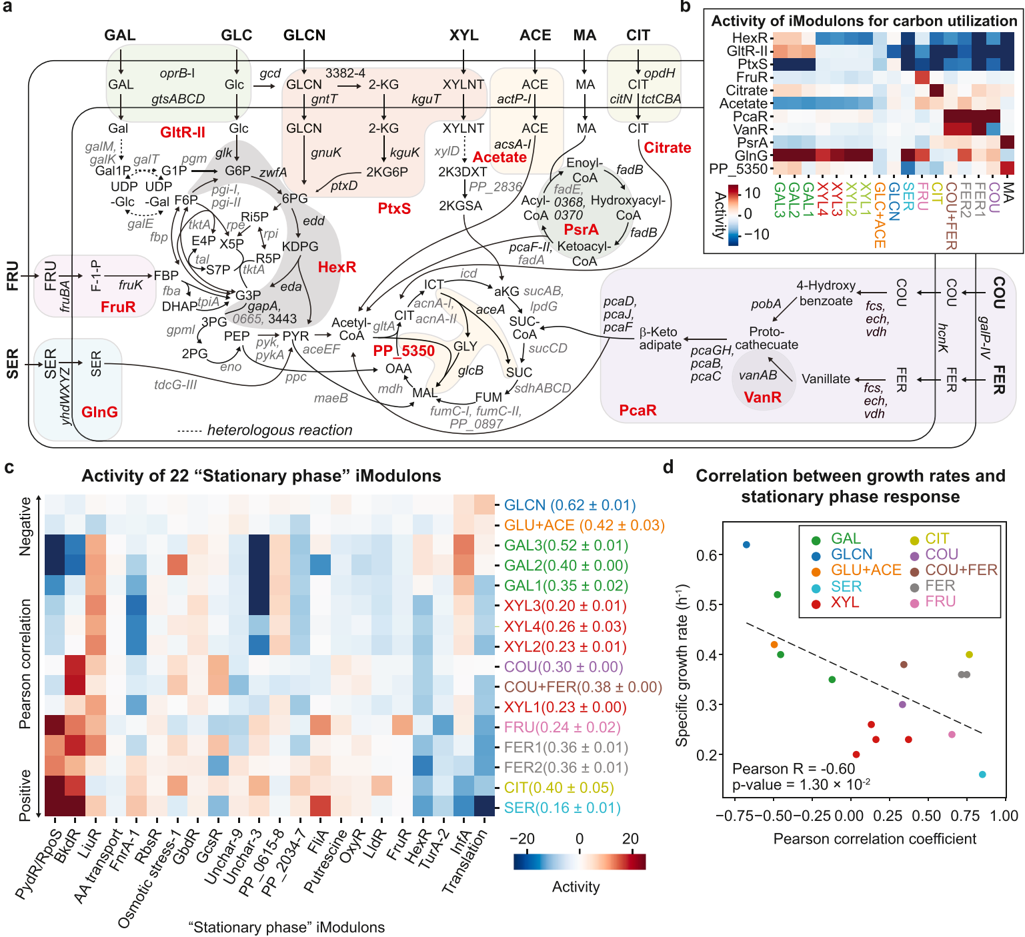
Fig. 4 iModulons show transcriptional responses to the utilization of different substrates. (a) Metabolic pathway associated with iModulons for substrate utilization in P. putida . Boundaries of iModulons (names in red) were indicated by colored rounded shapes. Names of genes belonging to iModulons were colored in black. Subcellular localization information was obtained from Pseudomonas.com (Winsor et al., 2016). (b) Activities of the carbon utilization iModulons depending on substrates. For a clear comparison, the minimum and maximum activity values were set to 15 and 15, respectively. (c) The activities of the 22 iModulons, that showed differential activities during the transition to the stationary phase from the growth phase, during utilization of each substrate. For clear visualization, the minimum and maximum activities were set to 25 and 25, respectively. (b and c) Multiple RNA-Seq samples with the same substrates were differentiated by adding numbers. iModulon activities in the glucose condition are zero. (d) A scatter plot of the growth rates and Pearson correlation coefficients of activities of the ' sta­ tionary response ' in iModulons in the group. Abbreviations: GAL, galactose; GLC, glucose; GLCN, gluconate; XYL, xylose; ACE, acetate; MA, myristic acid; CIT, citrate; FRU, fructose; SER, serine; 2-KG, 2-ketogluconate; XYLNT, xylonate; 2K3DXT, 2-keto-3-deoxyxylonate; 2KGSA, 2-keto-glutaric semialdehyde; G6P, glucose-6-phosphate (P); 6 PG, 6-phosphogluconate; 2KG6P, 2-ketogluconate-6-P; Gal1P, galactose-1-P; F-1-P, fructose-1-P; UDP-Glc, uridine diphosphate-glucose; UDP-Gal, uridine diphosphate galactose; G1P, glucose-1-P; KDPG, 2-dehydro-3-deoxy-phosphogluconate; PYR, pyruvate; G3P, glyceraldehyde-3-P; 3 PG, glycerate-3-P; 2 PG, 2-phosphoglycerate; PEP, phosphoenolpyruvate; acetyl-CoA, acetyl coenzyme A (CoA), CIT, citrate; ICT, isocitrate; α KG, α -ketoglutarate; SUC-CoA, succinyl-CoA; SUC, succinate; FUM, fumarate; MAL, malate; OAA, oxaloacetate; GLY, glyoxylate.
Fig. 4 iModulons show transcriptional responses to the utilization of different substrates. (a) Metabolic pathway associated with iModulons for substrate utilization in P. putida . Boundaries of iModulons (names in red) were indicated by colored rounded shapes. Names of genes belonging to iModulons were colored in black. Subcellular localization information was obtained from Pseudomonas.com (Winsor et al., 2016). (b) Activities of the carbon utilization iModulons depending on substrates. For a clear comparison, the minimum and maximum activity values were set to 15 and 15, respectively. (c) The activities of the 22 iModulons, that showed differential activities during the transition to the stationary phase from the growth phase, during utilization of each substrate. For clear visualization, the minimum and maximum activities were set to 25 and 25, respectively. (b and c) Multiple RNA-Seq samples with the same substrates were differentiated by adding numbers. iModulon activities in the glucose condition are zero. (d) A scatter plot of the growth rates and Pearson correlation coefficients of activities of the ' sta­ tionary response ' in iModulons in the group. Abbreviations: GAL, galactose; GLC, glucose; GLCN, gluconate; XYL, xylose; ACE, acetate; MA, myristic acid; CIT, citrate; FRU, fructose; SER, serine; 2-KG, 2-ketogluconate; XYLNT, xylonate; 2K3DXT, 2-keto-3-deoxyxylonate; 2KGSA, 2-keto-glutaric semialdehyde; G6P, glucose-6-phosphate (P); 6 PG, 6-phosphogluconate; 2KG6P, 2-ketogluconate-6-P; Gal1P, galactose-1-P; F-1-P, fructose-1-P; UDP-Glc, uridine diphosphate-glucose; UDP-Gal, uridine diphosphate galactose; G1P, glucose-1-P; KDPG, 2-dehydro-3-deoxy-phosphogluconate; PYR, pyruvate; G3P, glyceraldehyde-3-P; 3 PG, glycerate-3-P; 2 PG, 2-phosphoglycerate; PEP, phosphoenolpyruvate; acetyl-CoA, acetyl coenzyme A (CoA), CIT, citrate; ICT, isocitrate; α KG, α -ketoglutarate; SUC-CoA, succinyl-CoA; SUC, succinate; FUM, fumarate; MAL, malate; OAA, oxaloacetate; GLY, glyoxylate.CC-BY · From the PDF
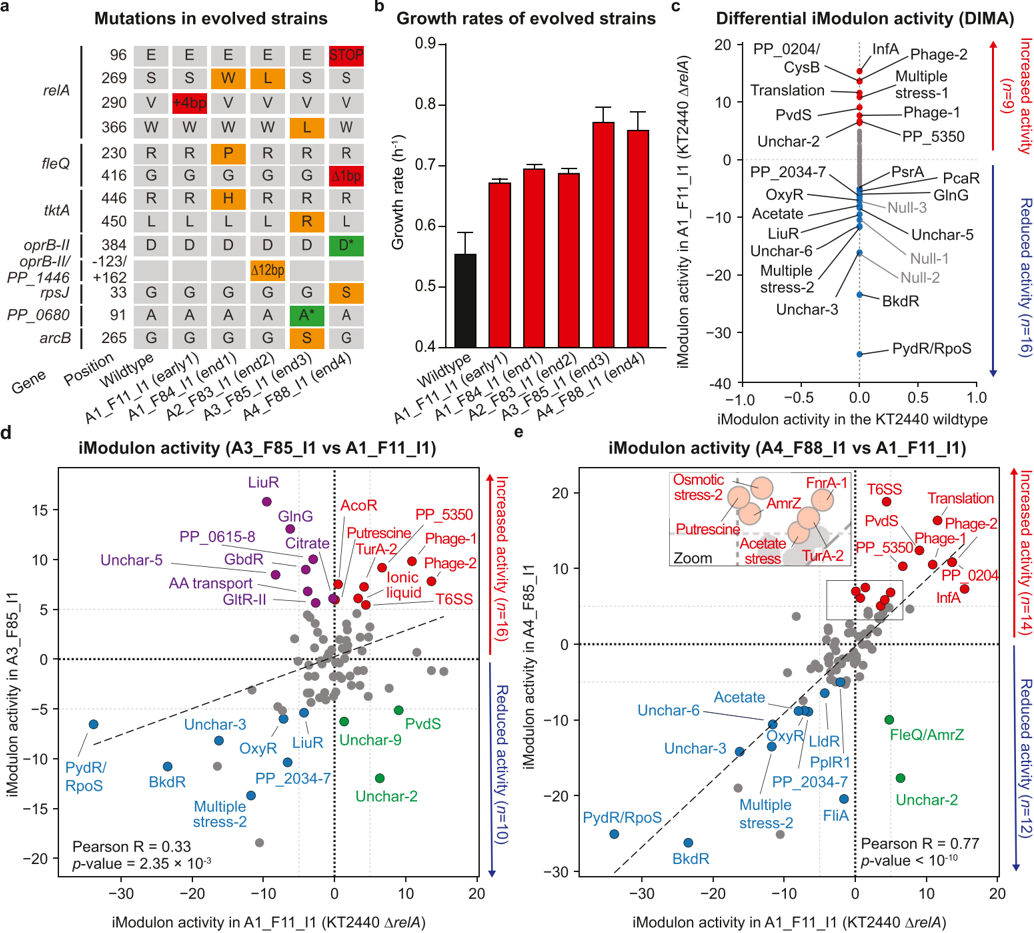
Fig. 5 Analyzing iModulon activities unveil evolutionary strategies to achieve high fitness in a glucose minimal medium condition. (a) Mutations identified in the wildtype, A1_F11_I1 (early1), A1_F84_I1 (end1), A2_F83_I1 (end2), A3_F85_I1 (end3), and A4_F88_I1 (end4) strains (Lim et al., 2020). Strain names indicate passage numbers during an evolution study (see Supplementary Note 3). Colors: orange, single amino acid changes or an in-frame deletion; green, nonsynonymous mutation; red, early termination or frame-shift mutations (b) Maximum specific rates (h 1 ) of the six strains in a glucose minimal medium. (c) Differential iModulon activity plot for the A1_F11_I1 and wildtype strains. (d and e) Differential iModulon activity plot for the A1_F11_I1 versus either (d) A3_F85_I1 or (e) A4_F88_I1 strain. iModulon activities in the non-wild type strains were inferred from the [M] matrix of the original iModulon activity. Dashed gray lines indicate a threshold value of 5 and solid gray lines indicate a 45-degree line of each plot. Null iModulons were colored in gray even with changes greater than 5.
Fig. 5 Analyzing iModulon activities unveil evolutionary strategies to achieve high fitness in a glucose minimal medium condition. (a) Mutations identified in the wildtype, A1_F11_I1 (early1), A1_F84_I1 (end1), A2_F83_I1 (end2), A3_F85_I1 (end3), and A4_F88_I1 (end4) strains (Lim et al., 2020). Strain names indicate passage numbers during an evolution study (see Supplementary Note 3). Colors: orange, single amino acid changes or an in-frame deletion; green, nonsynonymous mutation; red, early termination or frame-shift mutations (b) Maximum specific rates (h 1 ) of the six strains in a glucose minimal medium. (c) Differential iModulon activity plot for the A1_F11_I1 and wildtype strains. (d and e) Differential iModulon activity plot for the A1_F11_I1 versus either (d) A3_F85_I1 or (e) A4_F88_I1 strain. iModulon activities in the non-wild type strains were inferred from the [M] matrix of the original iModulon activity. Dashed gray lines indicate a threshold value of 5 and solid gray lines indicate a 45-degree line of each plot. Null iModulons were colored in gray even with changes greater than 5.CC-BY · From the PDF
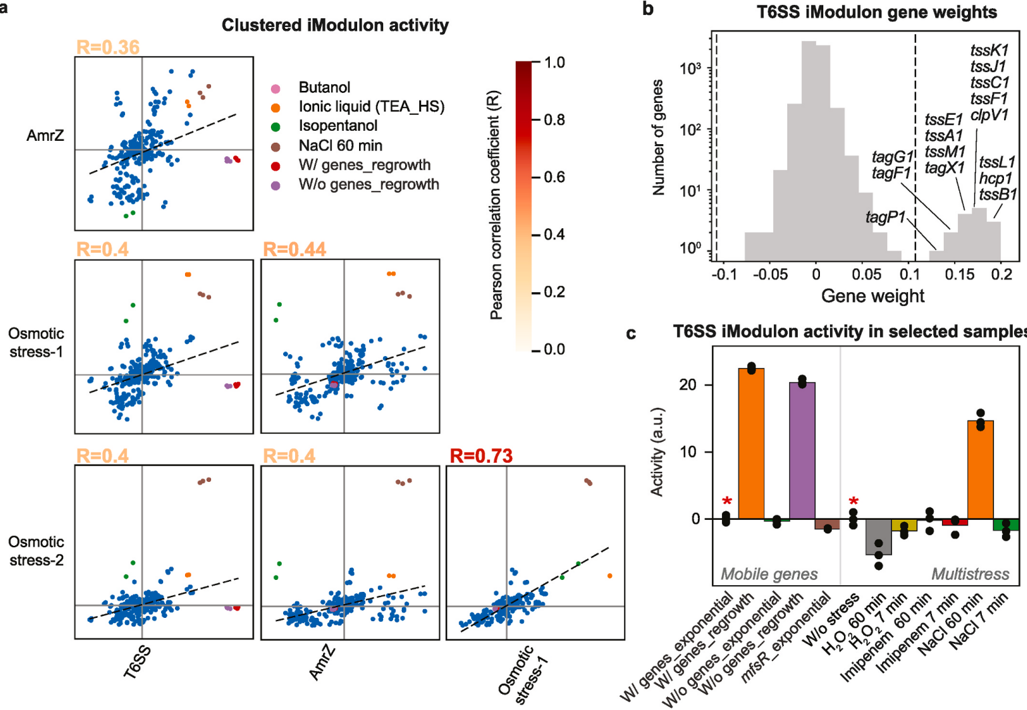
Fig. 6 Coordinated iModulon activity changes underlie the activation of the Type VI secretion system by osmotic stress and define a stimulon. (a) Activity cor­ relation of the T6SS, Osmotic stress-1, Osmotic stress-2, and AmrZ iModulons. Activities of all these four iModulons showed a positive correlation. Font colors indicate Pearson correlation coefficients. Samples displaying high activities were colored: pink (fuel:butanol); green (fuel:isopentanol), orange (ALE:IL_TEA_HS), brown (multistress:NaCl_60min), red (mobile_genes:2737_reg-w/mobile genes at the regrowth phase), and purple (mobile_genes:3227_reg-w/mobile genes at the regrowth phase). Dashed lines are the best fits on each plot. (b) Gene weights of the T6SS iModulon. The dashed line indicates a threshold value of 0.11 (See Methods). (c) T6SS iModulon activities in selected samples from projects: mobile genes and multistress (Bojanovi ˇ c et al., 2017). See Supplementary Data for details of the experimental conditions. Asterisks indicate the reference conditions.
Fig. 6 Coordinated iModulon activity changes underlie the activation of the Type VI secretion system by osmotic stress and define a stimulon. (a) Activity cor­ relation of the T6SS, Osmotic stress-1, Osmotic stress-2, and AmrZ iModulons. Activities of all these four iModulons showed a positive correlation. Font colors indicate Pearson correlation coefficients. Samples displaying high activities were colored: pink (fuel:butanol); green (fuel:isopentanol), orange (ALE:IL_TEA_HS), brown (multistress:NaCl_60min), red (mobile_genes:2737_reg-w/mobile genes at the regrowth phase), and purple (mobile_genes:3227_reg-w/mobile genes at the regrowth phase). Dashed lines are the best fits on each plot. (b) Gene weights of the T6SS iModulon. The dashed line indicates a threshold value of 0.11 (See Methods). (c) T6SS iModulon activities in selected samples from projects: mobile genes and multistress (Bojanovi ˇ c et al., 2017). See Supplementary Data for details of the experimental conditions. Asterisks indicate the reference conditions.CC-BY · From the PDF

Verification

Claims the paper makes

The claims and statistics of this paper haven’t been checked yet.

Run the check — free, no account needed. It reads the open-access text and checks the sources it cites.

A few free checks a day · papers already verified open instantly · results are public

Claims other papers make about this one

Each is checked against this paper’s own text: does it say what the citing paper says it does?

Self-check

Percentages, sums and reported differences re-computed from the paper’s own numbers.

The self-check needs the paper’s full text.

Citations

Cites

Research works printed but not linked: 65

  1. Bailey, 2009, MEME SUITE: tools for motif discovery and searching, Nucleic Acids Res., 37, W202, 10.1093/nar/gkp335 · DOI · Paper page
  2. Barbosa, 2019, Insights into Klebsiella pneumoniae type VI secretion system transcriptional regulation, BMC Genom., 20, 506, 10.1186/s12864-019-5885-9 · DOI
  3. Bartlett, 2017, Mapping genome-wide transcription-factor binding sites using DAP-seq, Nat. Protoc., 12, 1659, 10.1038/nprot.2017.055 · DOI
  4. Bentley, 2020, Engineering glucose metabolism for enhanced muconic acid production in Pseudomonas putida KT2440, Metab. Eng., 59, 64, 10.1016/j.ymben.2020.01.001 · DOI
  5. Bernal, 2017, The Pseudomonas putida T6SS is a plant warden against phytopathogens, ISME J., 11, 972, 10.1038/ismej.2016.169 · DOI
  6. Blanco-Romero, 2018, Genome-wide analysis of the FleQ direct regulon in Pseudomonas fluorescens F113 and Pseudomonas putida KT2440, Sci. Rep., 8, 13145, 10.1038/s41598-018-31371-z · DOI
  7. Bojanovič, 2017, Global transcriptional responses to osmotic, oxidative, and imipenem stress conditions in Pseudomonas putida, Appl. Environ. Microbiol., 83, 10.1128/AEM.03236-16 · DOI
  8. Chang, 2007, Alginate production by Pseudomonas putida creates a hydrated microenvironment and contributes to biofilm architecture and stress tolerance under water-limiting conditions, J. Bacteriol., 189, 8290, 10.1128/JB.00727-07 · DOI
  9. Chauhan, 2021, Machine learning uncovers a data-driven transcriptional regulatory network for the Crenarchaeal Thermoacidophile Sulfolobus acidocaldarius, Front. Microbiol., 12, 753521, 10.3389/fmicb.2021.753521 · DOI
  10. Checovich, 1995, Fluorescence polarization--a new tool for cell and molecular biology, Nature, 375, 254, 10.1038/375254a0 · DOI
  11. Chen, 2020, Type VI secretion system of Pseudomonas aeruginosa is associated with biofilm formation but not environmental adaptation, Microbiol. Open, 9, e991, 10.1002/mbo3.991 · DOI
  12. Comon, 1994, Independent component analysis, A new concept?, Signal Process., 36, 287, 10.1016/0165-1684(94)90029-9 · DOI
  13. Daddaoua, 2009, Regulation of glucose metabolism in Pseudomonas: the phosphorylative branch and entner-doudoroff enzymes are regulated by a repressor containing a sugar isomerase domain, J. Biol. Chem., 284, 21360, 10.1074/jbc.M109.014555 · DOI
  14. Del Castillo, 2008, A set of activators and repressors control peripheral glucose pathways in Pseudomonas putida to yield a common central intermediate, J. Bacteriol., 190, 2331, 10.1128/JB.01726-07 · DOI
  15. Di Tommaso, 2017, Nextflow enables reproducible computational workflows, Nat. Biotechnol., 35, 316, 10.1038/nbt.3820 · DOI · Paper page
  16. Diez, 2020, The alarmones (p)ppGpp directly regulate translation initiation during entry into quiescence, Proc. Natl. Acad. Sci. U.S.A., 117, 15565, 10.1073/pnas.1920013117 · DOI
  17. Ester, 1996, A Density-Based Algorithm for Discovering Clusters in Large Spatial Databases with Noise, In Proceedings of 2nd International Conference on KDD, 226
  18. Ewels, 2016, MultiQC: summarize analysis results for multiple tools and samples in a single report, Bioinformatics, 32, 3047, 10.1093/bioinformatics/btw354 · DOI · Paper page
  19. Galperin, 2015, Expanded microbial genome coverage and improved protein family annotation in the COG database, Nucleic Acids Res., 43, D261, 10.1093/nar/gku1223 · DOI
  20. Gao, 2021, Unraveling the functions of uncharacterized transcription factors in Escherichia coli using ChIP-exo, Nucleic Acids Res., 49, 9696, 10.1093/nar/gkab735 · DOI
  21. Guo, 1999, PcaR-mediated activation and repression of pca genes from Pseudomonas putida are propagated by its binding to both the -35 and the -10 promoter elements, Mol. Microbiol., 32, 253, 10.1046/j.1365-2958.1999.01342.x · DOI
  22. Gupta, 2007, Quantifying similarity between motifs, Genome Biol., 8, R24, 10.1186/gb-2007-8-2-r24 · DOI · Paper page
  23. Hellman, 2007, Electrophoretic mobility shift assay (EMSA) for detecting protein-nucleic acid interactions, Nat. Protoc., 2, 1849, 10.1038/nprot.2007.249 · DOI
  24. Herrgård, 2004, Reconstruction of microbial transcriptional regulatory networks, Curr. Opin. Biotechnol., 15, 70, 10.1016/j.copbio.2003.11.002 · DOI
  25. Hervás, 2009, NtrC-dependent regulatory network for nitrogen assimilation in Pseudomonas putida, J. Bacteriol., 191, 6123, 10.1128/JB.00744-09 · DOI
  26. Huang, 2019, An integrated genomic regulatory network of virulence-related transcriptional factors in Pseudomonas aeruginosa, Nat. Commun., 10, 2931, 10.1038/s41467-019-10778-w · DOI
  27. Huerta-Cepas, 2019, eggNOG 5.0: a hierarchical, functionally and phylogenetically annotated orthology resource based on 5090 organisms and 2502 viruses, Nucleic Acids Res., 47, D309, 10.1093/nar/gky1085 · DOI
  28. Hyvärinen, 1999, Fast and robust fixed-point algorithms for independent component analysis, IEEE Trans. Neural Network., 10, 626, 10.1109/72.761722 · DOI
  29. Jayakody, 2018, Thermochemical wastewater valorization via enhanced microbial toxicity tolerance, Energy Environ. Sci., 11, 1625, 10.1039/C8EE00460A · DOI
  30. Johnson, 2019, Innovative chemicals and materials from bacterial aromatic catabolic pathways, Joule, 10.1016/j.joule.2019.05.011 · DOI
  31. Karp, 2019, The BioCyc collection of microbial genomes and metabolic pathways, Briefings Bioinf., 20, 1085, 10.1093/bib/bbx085 · DOI
  32. Kiliç, 2014, CollecTF: a database of experimentally validated transcription factor-binding sites in Bacteria, Nucleic Acids Res., 42, D156, 10.1093/nar/gkt1123 · DOI
  33. Lamoureux, 2021, PRECISE 2.0: an expanded high-quality RNA-seq compendium for Escherichia coli K-12 reveals high-resolution transcriptional regulatory structure, bioRxiv
  34. Langmead, 2009, Ultrafast and memory-efficient alignment of short DNA sequences to the human genome, Genome Biol., 10, R25, 10.1186/gb-2009-10-3-r25 · DOI · Paper page
  35. Lei, 2020, Determining the different mechanisms used by pseudomonas species to cope with minimal inhibitory concentrations of zinc via comparative transcriptomic analyses, Front. Microbiol., 11, 573857, 10.3389/fmicb.2020.573857 · DOI
  36. Liao, 2014, featureCounts: an efficient general purpose program for assigning sequence reads to genomic features, Bioinformatics, 30, 923, 10.1093/bioinformatics/btt656 · DOI · Paper page
  37. Liebermeister, 2002, Linear modes of gene expression determined by independent component analysis, Bioinformatics, 18, 51, 10.1093/bioinformatics/18.1.51 · DOI
  38. Lim, 2013, The effect of zinc limitation on the transcriptome of Pseudomonas protegens Pf-5, Environ. Microbiol., 15, 702, 10.1111/j.1462-2920.2012.02849.x · DOI
  39. Lim, 2021, Generation of Pseudomonas putida KT2440 strains with efficient utilization of xylose and galactose via adaptive laboratory evolution, ACS Sustain. Chem. Eng., 9, 11512, 10.1021/acssuschemeng.1c03765 · DOI
  40. Lim, 2020, Generation of ionic liquid tolerant Pseudomonas putida KT2440 strains via adaptive laboratory evolution, Green Chem., 22, 5677, 10.1039/D0GC01663B · DOI
  41. Lundblad, 1996, Fluorescence polarization analysis of protein-DNA and protein-protein interactions, Mol. Endocrinol., 10, 607
  42. McConn, 2021, Optimal dimensionality selection for independent component analysis of transcriptomic data, BMC Bioinf., 22, 584, 10.1186/s12859-021-04497-7 · DOI
  43. Miyazaki, 2018, Physiological and transcriptome changes induced by Pseudomonas putida acquisition of an integrative and conjugative element, Sci. Rep., 8, 5550, 10.1038/s41598-018-23858-6 · DOI
  44. Molina-Henares, 2017, FleQ of Pseudomonas putida KT2440 is a multimeric cyclic diguanylate binding protein that differentially regulates expression of biofilm matrix components, Res. Microbiol., 168, 36, 10.1016/j.resmic.2016.07.005 · DOI
  45. Nakamura, 2020, H-NS family proteins drastically change their targets in response to the horizontal transfer of the catabolic plasmid pCAR1, Front. Microbiol., 11, 1099, 10.3389/fmicb.2020.01099 · DOI
  46. Nielsen, 2011, Cell-cell and cell-surface interactions mediated by cellulose and a novel exopolysaccharide contribute to Pseudomonas putida biofilm formation and fitness under water-limiting conditions, Environ. Microbiol., 13, 1342, 10.1111/j.1462-2920.2011.02432.x · DOI
  47. Nikel, 2018, Pseudomonas putida as a functional chassis for industrial biocatalysis: from native biochemistry to trans-metabolism, Metab. Eng., 50, 142, 10.1016/j.ymben.2018.05.005 · DOI · Paper page
  48. Pedregosa, 2011, Scikit-learn: machine learning in Python, J. Mach. Learn. Res., 12, 2825
  49. Pobre, 2020, Prediction of novel non-coding RNAs relevant for the growth of Pseudomonas putida in a bioreactor, Microbiology, 166, 149, 10.1099/mic.0.000875 · DOI
  50. Poudel, 2020, Revealing 29 sets of independently modulated genes in Staphylococcus aureus, their regulators, and role in key physiological response, Proc. Natl. Acad. Sci. U.S.A., 117, 17228, 10.1073/pnas.2008413117 · DOI
  51. Rajput, 2021, Machine Learning of Pseudomonas aeruginosa transcriptomes identifies independently modulated sets of genes associated with known transcriptional regulators, bioRxiv
  52. Rinas, 1995, Entry of Escherichia coli into stationary phase is indicated by endogenous and exogenous accumulation of nucleobases, Appl. Environ. Microbiol., 61, 4147, 10.1128/aem.61.12.4147-4151.1995 · DOI
  53. Rychel, 2021, iModulonDB: a knowledgebase of microbial transcriptional regulation derived from machine learning, Nucleic Acids Res., 49, D112, 10.1093/nar/gkaa810 · DOI
  54. Rychel, 2020, Machine learning uncovers independently regulated modules in the Bacillus subtilis transcriptome, Nat. Commun., 11, 6338, 10.1038/s41467-020-20153-9 · DOI
  55. Saelens, 2018, A comprehensive evaluation of module detection methods for gene expression data, Nat. Commun., 9, 1090, 10.1038/s41467-018-03424-4 · DOI
  56. Santos-Zavaleta, 2019, RegulonDB v 10.5: tackling challenges to unify classic and high throughput knowledge of gene regulation in E. coli K-12, Nucleic Acids Res., 47, D212, 10.1093/nar/gky1077 · DOI
  57. Sastry, 2019, The Escherichia coli transcriptome mostly consists of independently regulated modules, Nat. Commun., 10, 5536, 10.1038/s41467-019-13483-w · DOI
  58. Sastry, 2021, Mining all publicly available expression data to compute dynamic microbial transcriptional regulatory networks, bioRxiv
  59. Smith, 2010, Economical evolution: microbes reduce the synthetic cost of extracellular proteins, mBio, 1, 10.1128/mBio.00131-10 · DOI
  60. Szklarczyk, 2019, STRING v11: protein-protein association networks with increased coverage, supporting functional discovery in genome-wide experimental datasets, Nucleic Acids Res., 47, D607, 10.1093/nar/gky1131 · DOI · Paper page
  61. Wackett, 2003, Pseudomonas putida--a versatile biocatalyst, Nat. Biotechnol., 21, 136, 10.1038/nbt0203-136 · DOI
  62. Wang, 2012, RSeQC: quality control of RNA-seq experiments, Bioinformatics, 28, 2184, 10.1093/bioinformatics/bts356 · DOI
  63. Winsor, 2016, Enhanced annotations and features for comparing thousands of Pseudomonas genomes in the Pseudomonas genome database, Nucleic Acids Res., 44, D646, 10.1093/nar/gkv1227 · DOI
  64. Xiao, 2018, FinR regulates expression of nicC and nicX operons, involved in nicotinic acid degradation in Pseudomonas putida KT2440, Appl. Environ. Microbiol., 84, 10.1128/AEM.01210-18 · DOI
  65. Yoo, 2022, Machine learning of all Mycobacterium tuberculosis H37Rv RNA-seq data reveals a structured interplay between metabolism, stress response, and infection, mSphere, 10.1128/msphere.00033-22 · DOI

Cited by

Metadata

Authors
Lim, H. G., Rychel, K., Sastry, A. V., Bentley, G. J., Mueller, J., Schindel, H. S., Larsen, P. E., Laible, P. D., Guss, A. M., Niu, W., Johnson, C. W., Beckham, G. T., Feist, A. M., & Palsson, B. O.
Venue
Metabolic Engineering
Publisher
Elsevier BV
Published
2022-07
Volume
72
Pages
297-310
ISSN
1096-7176
Cited by
80
References
2
Language
en
Funders
  • Office of Energy Efficiency and Renewable Energy (DE-AC36-08GO28308)
  • University of Nebraska-Lincoln Nebraska Center for Energy Sciences Research
  • US Department of Energy Office of Science (DE-AC02-05CH11231, DE-AC05-00OR22725)
  • Biological and Environmental Research
  • U.S. Department of Energy
  • Bioenergy Technologies Office
  • National Renewable Energy Laboratory

About these checks

Registry, retraction, Cites and statistics results are computed, not judged, with one exception: a printed reference that no index lists is read once by a model before it counts as a citation error. Claims are extracted by a model and kept only when their quote appears verbatim in the text; each cited source is then checked, with a model’s help, for whether it says what the claim relies on. Those verdicts can be wrong — read the claim’s quote and the cited source before relying on one.

Statistics and arithmetic are recomputed, not judged.

Confidence bands are shown only for fields calibrated on our annotated test set. None is calibrated yet, so no band is shown.

What counts as a claim ›How we measure confidence ›How we check this ›

Are you an author, or do you see a problem with this page? Request a review