

The DOI matches its Crossref record; 18 of the 18 references it cites were found in a registry or an index.
Mapping the burden of cholera in sub-Saharan Africa and implications for control: an analysis of data across geographical scales
Open accessAbstract
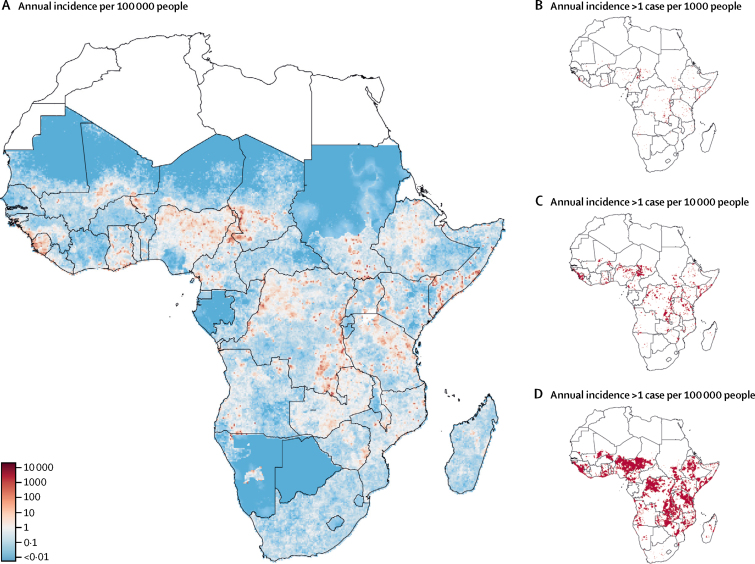
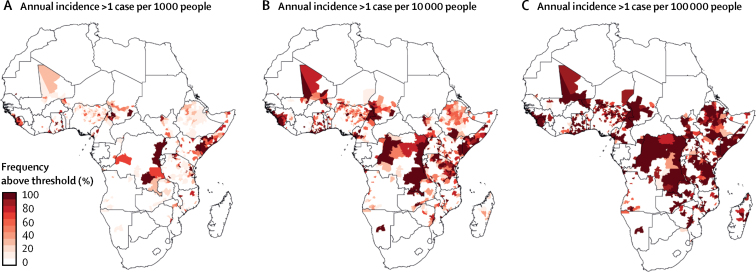
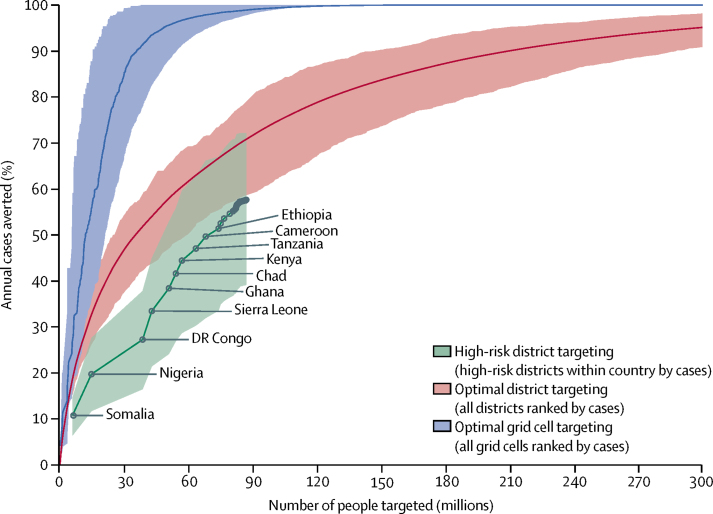
BACKGROUND: Cholera remains a persistent health problem in sub-Saharan Africa and worldwide. Cholera can be controlled through appropriate water and sanitation, or by oral cholera vaccination, which provides transient (∼3 years) protection, although vaccine supplies remain scarce. We aimed to map cholera burden in sub-Saharan Africa and assess how geographical targeting could lead to more efficient interventions. METHODS: We combined information on cholera incidence in sub-Saharan Africa (excluding Djibouti and Eritrea) from 2010 to 2016 from datasets from WHO, Médecins Sans Frontières, ProMED, ReliefWeb, ministries of health, and the scientific literature. We divided the study region into 20 km × 20 km grid cells and modelled annual cholera incidence in each grid cell assuming a Poisson process adjusted for covariates and spatially correlated random effects. We combined these findings with data on population distribution to estimate the number of people living in areas of high cholera incidence (>1 case per 1000 people per year). We further estimated the reduction in cholera incidence that could be achieved by targeting cholera prevention and control interventions at areas of high cholera incidence. FINDINGS: We included 279 datasets covering 2283 locations in our analyses. In sub-Saharan Africa (excluding Djibouti and Eritrea), a mean of 141 918 cholera cases (95% credible interval [CrI] 141 538-146 505) were reported per year. 4·0% (95% CrI 1·7-16·8) of districts, home to 87·2 million people (95% CrI 60·3 million to 118·9 million), have high cholera incidence. By focusing on the highest incidence districts first, effective targeted interventions could eliminate 50% of the region's cholera by covering 35·3 million people (95% CrI 26·3 million to 62·0 million), which is less than 4% of the total population. INTERPRETATION: Although cholera occurs throughout sub-Saharan Africa, its highest incidence is concentrated in a small proportion of the continent. Prioritising high-risk areas could substantially increase the efficiency of cholera control programmes. FUNDING: The Bill & Melinda Gates Foundation.
Overview
The claims and statistics of this paper haven’t been checked yet.
Run the check — free, no account needed. It reads the open-access text and checks the sources it cites.
Integrity signals
Registry
Cites
Statistics
Figures
Verification
Claims the paper makes
The claims and statistics of this paper haven’t been checked yet.
Run the check — free, no account needed. It reads the open-access text and checks the sources it cites.
Claims other papers make about this one
Each is checked against this paper’s own text: does it say what the citing paper says it does?
The source backs part of the claim, not all of it — or backs it for a different population, condition or comparison.
In the citing paper
“In SSA, cholera is still endemic and is responsible for 141,918 infections per year (95% CI 141,538-146,505).52”
From Antimicrobial Resistance Rates and Surveillance in Sub-Saharan Africa: Where Are We Now? (2022) · cites this paper as [52]
Experimental — accuracy not yet measured
Self-check
Percentages, sums and reported differences re-computed from the paper’s own numbers.
The self-check needs the paper’s full text.
Citations
Cites
Inference from iterative simulation using multiple sequences
Gelman, A., & Rubin, D. B. (1992) · Statistical Science · doi:10.1214/ss/1177011136 · Cited by 16,627
MODIS Collection 5 global land cover: Algorithm refinements and characterization of new datasets
Friedl, M. A., Sulla‐Menashe, D., Tan, B., Schneider, A., Ramankutty, N., Sibley, A. M., & Huang, X. (2009) · Remote Sensing of Environment · doi:10.1016/j.rse.2009.08.016 · Cited by 3,501
raster: Geographic Data Analysis and Modeling
Hijmans, R. J. (2010) · doi:10.32614/cran.package.raster · Cited by 3,012
(2017) · The SHAFR Guide Online · doi:10.1163/2468-1733_shafr_sim010030025 · Cited by 2,357
WorldPop, open data for spatial demography
Tatem, A. J. (2017) · Scientific Data · doi:10.1038/sdata.2017.4 · Cited by 1,182
World Development Indicators 2015
Bank, W. (2015) · World Bank, Washington, DC eBooks · doi:10.1596/978-1-4648-0440-3 · Cited by 738
World Development Indicators 2016
Bank, W. (2016) · The World Bank Open Knowledge Repository (World Bank) · doi:10.1596/978-1-4648-0683-4 · Cited by 733
Pullan, R. L., Freeman, M. C., Gething, P. W., & BROOKER, S. J. (2014) · PLoS Medicine · doi:10.1371/journal.pmed.1001626 · Cited by 225
Bi, Q., Ferreras, E., Pezzoli, L., Legros, D., Ivers, L. C., Date, K., Qadri, F., Digilio, L., Sack, D. A., Ali, M., et al. (2017) · The Lancet Infectious Diseases · doi:10.1016/s1473-3099(17)30359-6 · Cited by 172
Self-citationAlam, M., Hasan, N. A., Sadique, A., Bhuiyan, N. A., Ahmed, K. U., Nusrin, S., Nair, G. B., Siddique, A., Sack, R. B., Sack, D. A., et al. (2006) · Applied and Environmental Microbiology · doi:10.1128/aem.00066-06 · Cited by 133
Cited by
Sorted by citations
The environmental footprint of health care: a global assessment
Lenzen, M., Malik, A., Li, M., Fry, J., Weisz, H., Pichler, P., Chaves, L. S. M., Capon, A. G., & Pencheon, D. C. (2020) · The Lancet Planetary Health · doi:10.1016/s2542-5196(20)30121-2 · Cited by 1,327
Antimicrobial Resistance Rates and Surveillance in Sub-Saharan Africa: Where Are We Now?
Kariuki, S., Kering, K., Wairimu, C., Onsare, R., & Mbae, C. (2022) · Infection and Drug Resistance · doi:10.2147/idr.s342753 · Cited by 245
Deen, J. L., Mengel, M. A., & Clemens, J. D. (2019) · Vaccine · doi:10.1016/j.vaccine.2019.07.078 · Cited by 251
Self-citationGlobal Cholera Epidemiology: Opportunities to Reduce the Burden of Cholera by 2030
Legros, D. (2018) · The Journal of Infectious Diseases · doi:10.1093/infdis/jiy486 · Cited by 198
Self-citationEmerging infectious diseases in Africa in the 21st century
Fenollar, F., & Mediannikov, O. (2018) · New Microbes and New Infections · doi:10.1016/j.nmni.2018.09.004 · Cited by 192
Metadata
- Authors
- Lessler, J., Moore, S. M., Luquero, F. J., McKay, H. S., Grais, R., Henkens, M., Mengel, M., Dunoyer, J., M'bangombe, M., Lee, E. C., Djingarey, M. H., Sudre, B., Bompangue, D., Fraser, R. S. M., Abubakar, A., Perea, W., Legros, D., & Azman, A. S.
- Affiliations
- Johns Hopkins University (US)
- University of Notre Dame (US)
- Epicentre (FR)
- Médecins Sans Frontières (BE)
- Agence de Médecine Préventive (FR)
- United Nations Children's Fund (US)
- World Health Organization Regional Office for Africa (CG)
- Ministry of Public Health (CD)
- International Federation of Red Cross and Red Crescent Societies (CH)
- World Health Organization Regional Office for the Eastern Mediterranean (EG)
- World Health Organization (CH)
- Corresponding author
- Lessler, Justin
- ORCID
- Venue
- The Lancet
- Publisher
- Elsevier BV
- Published
- 2018-05
- Volume
- 391
- Issue
- 10133
- Pages
- 1908-1915
- ISSN
- 0099-5355 (ISSN-L)
- 0140-6736
- PMC
- PMC5946088
- OpenAlex
- W2792363855
- Cited by
- 192
- References
- 17
- Citations by year
- 2026: 12 · 2025: 24 · 2024: 33 · 2023: 27 · 2022: 22 · 2021: 21 · 2020: 22 · 2019: 20 · 2018: 11
- FWCI
- 13.14
- Type
- journal article
- Language
- en
- Open access
- hybrid
- doi.org
- Licence
- Locations
- The Lancet (publishedVersion, cc-by)
- Europe PMC (PubMed Central) (publishedVersion, other-oa)
- PubMed Central (publishedVersion, cc-by)
- PubMed (publishedVersion)
- HAL (submittedVersion)
- Medecins Sans Frontieres Field Research (Medecins Sans Frontieres) (submittedVersion)
- Greater South Information System
- Funders
- Bill and Melinda Gates Foundation (OPP10892431, OPP1171700, OPP1127318)
- Topics
- Life Sciences › Immunology and Microbiology › Microbiology › Vibrio bacteria research studies
- Life Sciences › Agricultural and Biological Sciences › Food Science › Salmonella and Campylobacter epidemiology
- Life Sciences › Immunology and Microbiology › Microbiology › Bacterial Infections and Vaccines
- Keywords
- cholera, cholera incidence, sub-Saharan Africa, targeted interventions, cholera control, water and sanitation, spatially correlated random effects
- MeSH terms
- Cholera, Demography, Humans, Markov Chains, Population Density, Sanitation, Vaccination, Incidence, Africa South of the Sahara, Mass Vaccination
About these checks
Registry, retraction, Cites and statistics results are computed, not judged, with one exception: a printed reference that no index lists is read once by a model before it counts as a citation error. Claims are extracted by a model and kept only when their quote appears verbatim in the text; each cited source is then checked, with a model’s help, for whether it says what the claim relies on. Those verdicts can be wrong — read the claim’s quote and the cited source before relying on one.
Statistics and arithmetic are recomputed, not judged.
Confidence bands are shown only for fields calibrated on our annotated test set. None is calibrated yet, so no band is shown.
What counts as a claim ›How we measure confidence ›How we check this ›
Are you an author, or do you see a problem with this page? Request a review
