

Constructing Collective Variables Using Invariant Learned Representations
Open accessThe DOI matches its Crossref record; 50 of the 50 references it cites were found in a registry or an index.
Abstract
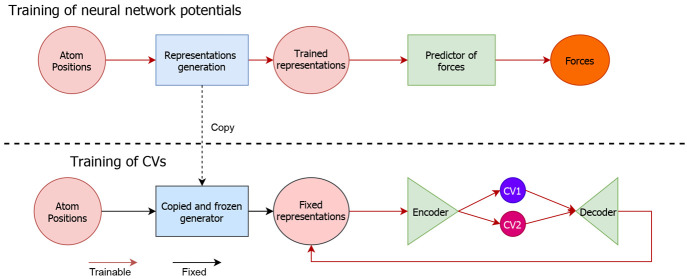
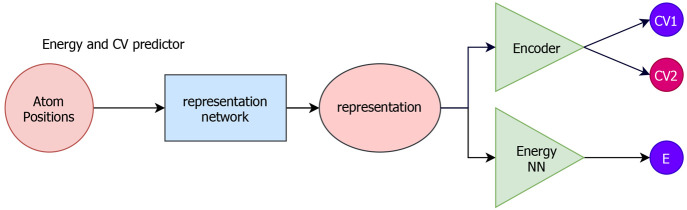
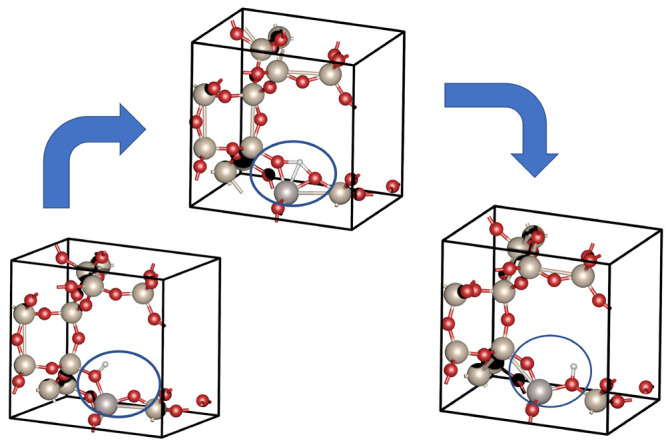
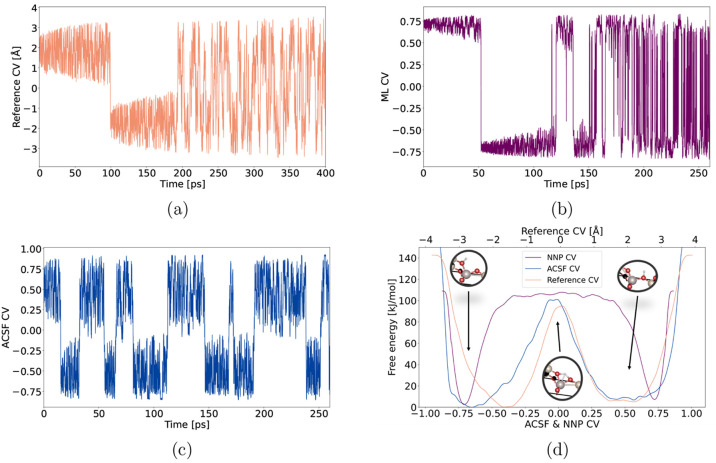
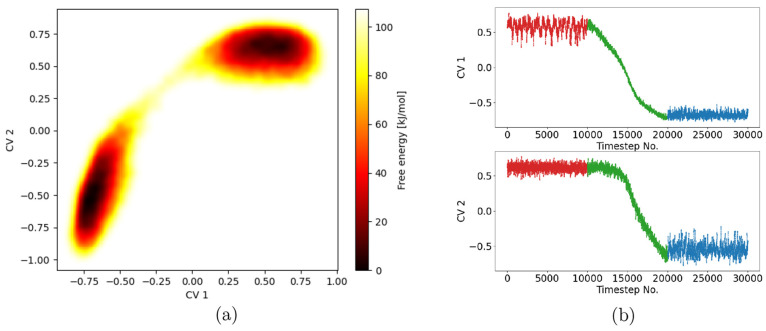
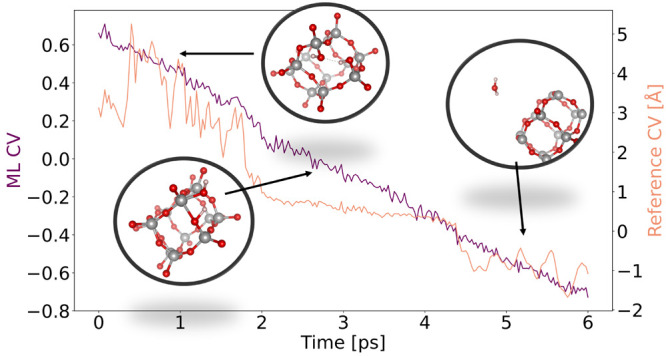
On the time scales accessible to atomistic numerical modeling, chemical reactions are considered rare events. Therefore, the atomistic simulations are commonly biased along a low-dimensional representation of a chemical reaction in an atomic structure space, i.e., along the collective variables. However, suitable collective variables are often complicated to guess a priori . We propose a novel method of collective variable discovery based on dimensionality reduction of the atomic representation vectors. These linear-scaling and invariant representations can be either fixed (untrained) or learned by supervised training of the end-to-end machine learning potential. The learned representations are expected to reflect not only the structural but also the energetic features of the system that are transferable to all of the reactive transformation covered by the machine learning potential. We demonstrate our approach on four high-barrier reactions ranging from a simple gas-phase hydrogen jump reaction to complex reactions in periodic models of industrially relevant heterogeneous catalysts. High data efficiency, automatized feature extraction, favorable scaling, and retention of inherent invariances are all properties that are expected to enable fast and largely automatic construction of suitable collective variables even in highly complex reactive scenarios such as reactive/catalytic transformations at solid–liquid interfaces.
Overview
The claims and statistics of this paper haven’t been checked yet.
Free: it reads the open-access text and checks the first 5 claims that cite a source we can check. Create a free account to check every claim.
Integrity signals
Registry
Cites
Statistics
Figures
Verification
Claims the paper makes
The claims and statistics of this paper haven’t been checked yet.
Free: it reads the open-access text and checks the first 5 claims that cite a source we can check. Create a free account to check every claim.
Claims other papers make about this one
Each is checked against this paper’s own text: does it say what the citing paper says it does?
The source backs part of the claim, not all of it — or backs it for a different population, condition or comparison.
In the citing paper
“We showed previously that learned ML-CVs coupled with the baseline NNP enable efficient sampling of the free energy surface for a proton jump and Si-O bond hydrolysis in CHA zeolite34.”
From A reactive neural network framework for water-loaded acidic zeolites (2024) · cites this paper as [34]
Experimental — accuracy not yet measuredThe cited source says what the claim attributes to it.
In the citing paper
“Our recent work34 shows how the end-to-end learned atomic representations of our baseline NNP model can be used to automatically generate robust machine-learned CVs (ML-CVs).”
From A reactive neural network framework for water-loaded acidic zeolites (2024) · cites this paper as [34]
Self-check
Percentages, sums and reported differences re-computed from the paper’s own numbers.
The self-check needs the paper’s full text.
Citations
Cites
Generalized Gradient Approximation Made Simple
Perdew, J. P., Burke, K., & Ernzerhof, M. (1996) · Physical Review Letters · doi:10.1103/physrevlett.77.3865 · Cited by 215,824
Projector augmented-wave method
Blöchl, P. E. (1994) · Physical Review B · doi:10.1103/physrevb.50.17953 · Cited by 92,732 · cited 1×
“…structures were performed using density functional theory as implemented in the VASP 5.4. code, 50 with the Perdew − Burke − Ernzerhof exchange − correlation functional, 51 the projector augmented-wave (PAW) method, 52,53 and the D3 dispersion correction 54 along with Becke − Johnson damping.”
MethodInfluentialFrom ultrasoft pseudopotentials to the projector augmented-wave method
Kresse, G., & Joubert, D. (1999) · Physical Review B · doi:10.1103/physrevb.59.1758 · Cited by 85,307
Grimme, S., Antony, J., Ehrlich, S., & Krieg, H. (2010) · The Journal of Chemical Physics · doi:10.1063/1.3382344 · Cited by 59,686
Ab initio molecular dynamics for liquid metals
Kresse, G., & Hafner, J. (1993) · Physical Review B · doi:10.1103/physrevb.47.558 · Cited by 45,727
Effect of the damping function in dispersion corrected density functional theory
Grimme, S., Ehrlich, S., & Goerigk, L. (2011) · Journal of Computational Chemistry · doi:10.1002/jcc.21759 · Cited by 28,221
Auto-Encoding Variational Bayes
Kingma, D. P., & Welling, M. (2013) · arXiv · doi:10.48550/arxiv.1312.6114 · Cited by 20,067
Nonphysical sampling distributions in Monte Carlo free-energy estimation: Umbrella sampling
Torrie, G. M., & Valleau, J. P. (1977) · Journal of Computational Physics · doi:10.1016/0021-9991(77)90121-8 · Cited by 6,091
Laio, A., & Parrinello, M. (2002) · Proceedings of the National Academy of Sciences · doi:10.1073/pnas.202427399 · Cited by 5,626
Generalized Neural-Network Representation of High-Dimensional Potential-Energy Surfaces
Behler, J., & Parrinello, M. (2007) · Physical Review Letters · doi:10.1103/physrevlett.98.146401 · Cited by 5,010
Research works printed but not linked: 5
- Duvenaud D., 2015, 28th Conference on Neural Information Processing Systems (NIPS 2015), 2224
- Schütt K., 2017, 31st Conference on Neural Information Processing Systems (NIPS 2017)
- Schütt K. T., 2021, Proc. Mach. Learn. Res., 139, 9377
- Huang H., 2018, 32nd Conference on Neural Information Processing Systems (NeurIPS 2018)
- Gebauer N. W. A., 2019, 33rd Conference on Neural Information Processing Systems (NeurIPS 2019), 7566
Cited by
Speybroeck, V. V., Bocus, M., Cnudde, P., & Vanduyfhuys, L. (2023) · ACS Catalysis · doi:10.1021/acscatal.3c01945 · Cited by 95
Enhanced Sampling in the Age of Machine Learning: Algorithms and Applications
Zhu, K., Trizio, E., Zhang, J., Hu, R., Jiang, L., Hou, T., & Bonati, L. (2025) · Chemical Reviews · doi:10.1021/acs.chemrev.5c00700 · Cited by 75
The future of computational catalysis
Sauer, J. (2024) · Journal of Catalysis · doi:10.1016/j.jcat.2024.115482 · Cited by 50
A reactive neural network framework for water-loaded acidic zeolites
Erlebach, A., Šípka, M., Saha, I., Nachtigall, P., Heard, C. J., & Grajciar, L. (2024) · Nature Communications · doi:10.1038/s41467-024-48609-2 · Cited by 47
Self-citationDescriptor-Free Collective Variables from Geometric Graph Neural Networks
Zhang, J., Bonati, L., Trizio, E., Zhang, O., Kang, Y., Hou, T., & Parrinello, M. (2024) · Journal of Chemical Theory and Computation · doi:10.1021/acs.jctc.4c01197 · Cited by 34
“Our results clearly demonstrate that GNN-based MLCVs can precisely capture the key features of various atomistic processes.”
Metadata
- Authors
- Šípka, M., Erlebach, A., & Grajciar, L.
- Affiliations
- Charles University (CZ)
- Corresponding author
- Šípka, Martin
- Grajciar, Lukáš
- Venue
- Journal of Chemical Theory and Computation
- Publisher
- American Chemical Society (ACS)
- Published
- 2023-01-25
- Volume
- 19
- Issue
- 3
- Pages
- 887-901
- ISSN
- 1549-9618 (ISSN-L)
- 1549-9626
- PMC
- PMC9940718
- OpenAlex
- W4318021309
- Cited by
- 21
- References
- 49
- Citations by year
- 2026: 3 · 2025: 3 · 2024: 13 · 2023: 2
- FWCI
- 1.55
- Type
- journal article
- Language
- en
- Open access
- hybrid
- doi.org
- Licence
- Locations
- Journal of Chemical Theory and Computation (publishedVersion, cc-by-nc-nd)
- PubMed Central (publishedVersion, cc-by-nc-nd)
- PubMed (publishedVersion)
- Funders
- Ministerstvo ?kolstvÃ, Mláde?e a Telovýchovy (90140)
- Grantová Agentura ?eské Republiky (20-26767Y)
- Univerzita Karlova v Praze (CZ.02.1.01/0.0/0.0/15 003/0000417, PRIMUS/20/SCI/004)
- Topics
- Physical Sciences › Materials Science › Materials Chemistry › Machine Learning in Materials Science
- Physical Sciences › Physics and Astronomy › Atomic and Molecular Physics, and Optics › Advanced Chemical Physics Studies
- Physical Sciences › Chemistry › Physical and Theoretical Chemistry › Advanced Physical and Chemical Molecular Interactions
- Keywords
- collective variables, invariant representations, learned representations, dimensionality reduction, rare events, machine learning interatomic potentials, atomistic simulation, heterogeneous catalysis, periodic systems, solid-liquid interface, data efficiency
About these checks
Registry, retraction, Cites and statistics results are computed, not judged, with one exception: a printed reference that no index lists is read once by a model before it counts as a citation error. Claims are extracted by a model and kept only when their quote appears verbatim in the text; each cited source is then checked, with a model’s help, for whether it says what the claim relies on. Those verdicts can be wrong — read the claim’s quote and the cited source before relying on one.
Statistics and arithmetic are recomputed, not judged.
Confidence bands are shown only for fields calibrated on our annotated test set. None is calibrated yet, so no band is shown.
What counts as a claim ›How we measure confidence ›How we check this ›
Are you an author, or do you see a problem with this page? Request a review
How to cite
Cite CoChat for the checks on this page, and the paper for its own findings.
- This page
- CoChat. (2026). Citation check: Constructing Collective Variables Using Invariant Learned Representations. https://app.cochat.ai/papers/10.1021/acs.jctc.2c00729
- The paper
- Šípka, M., Erlebach, A., & Grajciar, L. (2023). Constructing Collective Variables Using Invariant Learned Representations. Journal of Chemical Theory and Computation. https://doi.org/10.1021/acs.jctc.2c00729
Data sources
Bibliographic data: Semantic Scholar, OpenAlex, Crossref.
Contains information from the Semantic Scholar Academic Graph Datasets, made available under the ODC Attribution License (ODC-BY 1.0).
Semantic Scholar’s data is described in: Kinney, R., et al. (2023). The Semantic Scholar Open Data Platform. arXiv:2301.10140.
