

Exploring Microphase Separation in Semi-Fluorinated Diblock Copolymers: A Combined Experimental and Modeling Investigation
Open accessThe DOI matches its Crossref record; 72 of the 72 references it cites were found in a registry or an index.
Abstract
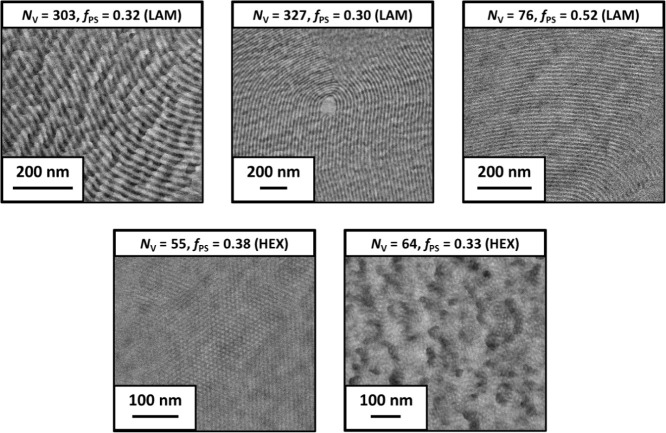
High Resolution Image Download MS PowerPoint Slide We report the combined experimental and theoretical study of the bulk self-assembly behavior of polystyrene- block -poly(2,3,4,5,6-pentafluorostyrene) diblock copolymers. These block copolymers were designed to create highly antagonistic blocks (with a high Flory–Huggins interaction parameter, χ) with minimum disruption to the molecular construct (i.e., only replacing five hydrogen atoms with five fluorine atoms). A large library of diblock copolymers (41 samples) was synthesized by reversible addition–fragmentation chain transfer (RAFT) polymerization to map out a major portion of the phase space. All block copolymers exhibited narrow molecular weight distributions with dispersity ( D ) values between 1.07 and 1.32, and subsequent thermal annealing revealed phase separation into well-defined nanoscale morphologies depending on their molecular composition, as determined from small-angle X-ray scattering and transmission electron microscopy analyses, with an experimental phase diagram being constructed. The χ value at 25 °C for this block copolymer was estimated to be 0.2 using strong segregation theory, based on trends in phase-separated domain spacing and interfacial width. When applying theoretical approaches, the majority of the domain spacing data trends were captured by a coil–coil diblock copolymer model; however, a better fit to the data for samples with shorter fluorinated blocks was obtained with a rod–coil model, indicating that the chains in these fluorinated blocks likely have a higher inherent stiffness and were thus rod-like. This observation demonstrates that, due to the very high value of χ, a transition from coil–coil to rod–coil behavior can be obtained purely by reducing the length of the stiffer of the two blocks and without varying temperature or the chemical composition of the polymers. This work showcases the presence of strong microphase separation within AB diblock copolymers despite the relatively similar chemical composition of the constituent “A” and “B” units, with a clear transition from rod–coil to coil–coil segregation behavior.
Overview
CoChat Summary
## TL;DR
This paper combines synthesis, scattering, microscopy, and strong segregation theory to study bulk self-assembly in 41 PS-b-PPFS diblock copolymers. It finds well-defined lamellar and hexagonally packed cylinder morphologies, estimates χ ≈ 0.2 at 25 °C, and shows a coil–coil to rod–coil crossover as the fluorinated block gets shorter.
## Key findings
- A library of 41 PS-b-PPFS diblock copolymers was synthesized by RAFT polymerization, with Đ = 1.07–1.32 and N_V = 25–327; the corresponding f_PS = 0.14–0.83 is reported in the conclusions.
- SAXS and TEM showed that thermally annealed samples formed well-defined nanoscale morphologies, specifically lamellae (LAM), hexagonally packed cylinders (HEX), and disordered (DIS) states; in some samples, 7 or 8 SAXS peaks were observed.
- Using SST applied to SAXS/XRR data, the authors estimated χ ≈ 0.2 at 22–25 °C; a refined estimate from the XRR/SST analysis gave χ_eff = 0.16 ± 0.05 over N_V = 53–327.
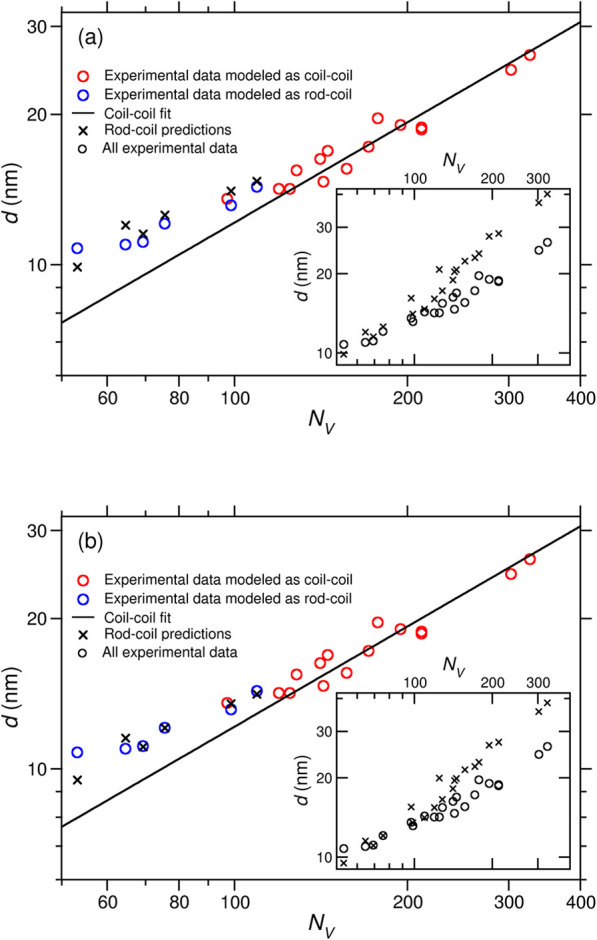
- Domain spacing followed coil–coil behavior at higher N_V, but for shorter PPFS blocks the data were better described by a rod–coil model, indicating a crossover driven by reducing PPFS length rather than changing temperature or chemical composition.
## Methods
- Design: Combined experimental and theoretical study of bulk self-assembly in semifluorinated diblock copolymers; PS-b-PPFS samples were synthesized, annealed, and then characterized by NMR, GPC, TGA, SAXS, TEM, and XRR, with SST used for modeling.
- Sample/data: A large series of 41 PS-b-PPFS copolymers was prepared via two-step RAFT polymerization in toluene; bulk films were thermally annealed before structural characterization.
- Main analysis: Morphologies were assigned primarily from SAXS peak sequences and supported by TEM; SST was fit to domain spacing and interfacial width data to estimate χ and to compare coil–coil versus rod–coil behavior.
## Limitations
- The paper states that SST predictions for interfacial width have a smaller region of validity than those for domain spacing, and that the small N_V values and small interfacial widths in this study may violate SST assumptions.
- The authors note that some χ_eff variation with N_V is likely an artifact of the small-N_V regime and possible coil–coil to rod–coil deviations, rather than a true dependence of χ on composition; this is stated in the paper.
- Evident from the text: the study relies on mean-field assumptions and on a limited set of mapped compositions, so the phase diagram may not capture all possible morphologies; the authors explicitly note that spherical or gyroid phases were not observed, but could exist outside the sampled region.
Model-written summary. Check it against the paper before relying on it.
Integrity signals
Registry
Cites
Statistics
Figures




Verification
Claims the paper makes
0 Valid · 3 Not valid · 1 Not checked · 86 Own results and interpretations
A result the paper reports from its own data — it cites no other source for it, so there is none to check. The quote shows it is in the paper.
In the paper
“In the sample with the longest PPFS block to be treated as a rod (N PPFS = 29), the size of the PPFS domain was measured by XRR to be 5.3 nm.”
§ Exploring Microphase Separation in Semi-Fluorinated Diblock Copolymers: A Combined Experimental and Modeling Investigation > Results and Discussion > Modeling of Domain Spacings and Estimation of χ Using SST
plainSingle case- Asserted: passes — The authors put it forward as true.
- Checkable: passes — It can be checked against evidence.
- Load-bearing: passes — The paper’s conclusions depend on it.
- Based: passes — The paper gives a reason why it holds.
A result the paper reports from its own data — it cites no other source for it, so there is none to check. The quote shows it is in the paper.
In the paper
“At higher values of N V, this log–log plot shows the standard behavior for coil–coil polymers, with the points lying close to a straight line with a slope of approximately 2/3.”
§ Exploring Microphase Separation in Semi-Fluorinated Diblock Copolymers: A Combined Experimental and Modeling Investigation > Results and Discussion > Modeling of Domain Spacings and Estimation of χ Using SST
plainstates an association- Asserted: passes — The authors put it forward as true.
- Checkable: passes — It can be checked against evidence.
- Load-bearing: passes — The paper’s conclusions depend on it.
- Based: passes — The paper gives a reason why it holds.
A result the paper states — it cites no source for it, so there is none to check. The quote shows it is in the paper.
In the paper
“apart from at lower values of N PPFS, there is no connection between the scatter in the experimental data and the scatter predicted by eq with a longer persistence length for PPFS (so that ϵ < 1)”
§ Exploring Microphase Separation in Semi-Fluorinated Diblock Copolymers: A Combined Experimental and Modeling Investigation > Results and Discussion > Modeling of Domain Spacings and Estimation of χ Using SST
plain- Asserted: passes — The authors put it forward as true.
- Checkable: passes — It can be checked against evidence.
- Load-bearing: unclear — It is unclear whether the paper’s conclusions depend on it.
- Based: passes — The paper gives a reason why it holds.
A result the paper reports from its own data — it cites no other source for it, so there is none to check. The quote shows it is in the paper.
In the paper
“1H NMR spectroscopy analyses (see Figure S1a) confirmed that intermediate styrene monomer conversions between 50% and 73% were achieved after 8 h for these syntheses”
§ Exploring Microphase Separation in Semi-Fluorinated Diblock Copolymers: A Combined Experimental and Modeling Investigation > Results and Discussion > Block Copolymer Synthesis and Characterization
plain- Asserted: passes — The authors put it forward as true.
- Checkable: passes — It can be checked against evidence.
- Load-bearing: passes — The paper’s conclusions depend on it.
- Based: passes — The paper gives a reason why it holds.
A result the paper reports from its own data — it cites no other source for it, so there is none to check. The quote shows it is in the paper.
In the paper
“Over the range of N V tested (53–327), χeff had an average of 0.16 ± 0.05.”
§ Exploring Microphase Separation in Semi-Fluorinated Diblock Copolymers: A Combined Experimental and Modeling Investigation > Results and Discussion > Estimation of χ Using SAXS and XRR
plain- Asserted: passes — The authors put it forward as true.
- Checkable: passes — It can be checked against evidence.
- Load-bearing: passes — The paper’s conclusions depend on it.
- Based: passes — The paper gives a reason why it holds.
- Rests on an assumption not shown here.
44 more claims
Create a free account to see all 90 claims and every source verdict.
- It may state two separate claims as one. 29
- Probably not a substantial claim. 13
Self-check
Percentages, sums and reported differences re-computed from the paper’s own numbers.
Each contradiction between two passages listed here was confirmed by an independent check.
Rated minor: it would not touch a result — a value no result rests on, a p-value that stays on the same side of the significance level, or a conflict that is clerical, resolved elsewhere in the paper, or outside its own findings.
In the paper
§ Exploring Microphase Separation in Semi-Fluorinated Diblock Copolymers: A Combined Experimental and Modeling Investigation > Abstract
“The χ value at 25 °C for this block copolymer was estimated to be 0.2 using strong segregation theory, based on trends in phase-separated domain spacing and interfacial width.”
§ Exploring Microphase Separation in Semi-Fluorinated Diblock Copolymers: A Combined Experimental and Modeling Investigation > Conclusions
“The χ value for PS-b-PPFS was then estimated to be 0.2 at 22 °C by applying the strong segregation theory to both SAXS and XRR data using calculated d and t i information, respectively.”
Citations
Cites
Chiefari, J., Chong, Y. K. (., Ercole, F., Krstina, J., Jeffery, J., Le, T. P. T., Mayadunne, R. T. A., Meijs, G. F., Moad, C. L., Moad, G., et al. (1998) · Macromolecules · doi:10.1021/ma9804951 · Cited by 5,147
Wang, J.-S., & Matyjaszewski, K. (1995) · Journal of the American Chemical Society · doi:10.1021/ja00125a035 · Cited by 4,622
Block Copolymer Thermodynamics: Theory and Experiment
Bates, F. S., & Fredrickson, G. H. (1990) · Annual Review of Physical Chemistry · doi:10.1146/annurev.pc.41.100190.002521 · Cited by 3,960
Theory of Microphase Separation in Block Copolymers
Leibler, L. (1980) · Macromolecules · doi:10.1021/ma60078a047 · Cited by 3,903
Block Copolymers—Designer Soft Materials
Bates, F. S., & Fredrickson, G. H. (1999) · Physics Today · doi:10.1063/1.882522 · Cited by 3,219 · cited 4×
“This experimental phase diagram aligns with classical predicted phase diagrams for AB diblock copolymers reported widely in the literature, 7 with large phase space occupied by lamellar morphologies, underneath which exists a narrow phase space for hexagonally packed cylinders, then a broad space…”
InfluentialKato, M., Kamigaito, M., Sawamoto, M., & Higashimura, T. (1995) · Macromolecules · doi:10.1021/ma00109a056 · Cited by 3,046
Unifying Weak- and Strong-Segregation Block Copolymer Theories
Matsen, M. W., & Bates, F. S. (1996) · Macromolecules · doi:10.1021/ma951138i · Cited by 1,839
Nitroxide-mediated polymerization
Nicolas, J., Guillaneuf, Y., Lefay, C., Bertin, D., Gigmes, D., & Charleux, B. (2013) · Progress in Polymer Science · doi:10.1016/j.progpolymsci.2012.06.002 · Cited by 1,380
Polyisoprene-Polystyrene Diblock Copolymer Phase Diagram near the Order-Disorder Transition
Khandpur, A. K., Foerster, S., Bates, F. S., Hamley, I. W., Ryan, A. J., Bras, W., Almdal, K., & Mortensen, K. (1995) · Macromolecules · doi:10.1021/ma00130a012 · Cited by 1,056
The standard Gaussian model for block copolymer melts
Matsen, M. W. (2002) · Journal of Physics: Condensed Matter · doi:10.1088/0953-8984/14/2/201 · Cited by 657
Research works printed but not linked: 1
- Semenov A. N., 1985, Zh. Eksp. Teor. Fiz., 88, 1242
Cited by
Atomic-Scale Imaging Reveals Polar-π Interactions in Two-Dimensional Molecular Superlattices
Lee, Y. J., Butterfoss, G. L., Luo, X., et al. (2026) · Journal of the American Chemical Society · doi:10.1021/jacs.5c19396
Metadata
- Authors
- Semsarilar, M., Greenall, M. J., Balzer, A. H., Sarkar, A. K., Gomri, C., Benkhaled, B. T., Höhme, A.-L., Held, M., Abetz, V., Hutchins-Crawford, H. J., Maitland, G. L., Patel, A., Epps, T. H., Topham, P. D., & Derry, M. J.
- Affiliations
- École Nationale Supérieure de Chimie de Montpellier (FR)
- University of Lincoln (GB)
- University of Delaware (US)
- Aston University (GB)
- Institut Européen des Membranes (IEM), CNRS, ENSCM
- Helmholtz-Zentrum Hereon (DE)
- Universität Hamburg (DE)
- Corresponding author
- Semsarilar, Mona
- Greenall, Martin J.
- Derry, Matthew J.
- ORCID
- Venue
- ACS Polymers Au
- Publisher
- American Chemical Society (ACS)
- Published
- 2025-10-10
- Volume
- 5
- Issue
- 6
- Pages
- 919-929
- ISSN
- 2694-2453 (ISSN-L)
- PMC
- PMC12874174
- OpenAlex
- W4415021326
- Semantic Scholar
- 71e4552b5b58d12a679d334344e3a0974e589361
- Cited by
- 1
- References
- 72
- Citations by year
- 2026: 1
- FWCI
- 0.19
- Type
- journal article
- Language
- en
- Open access
- gold
- doi.org
- Licence
- Locations
- ACS Polymers Au (publishedVersion, cc-by)
- Europe PMC (PubMed Central) (publishedVersion, cc-by)
- PubMed (publishedVersion)
- Library, Museums and Press - UDSpace (University of Delaware) (submittedVersion, cc-by)
- HAL (submittedVersion, cc-by)
- Aston Publications Explorer (Aston University) (submittedVersion)
- DOAJ (DOAJ: Directory of Open Access Journals) (submittedVersion, cc-by-sa)
- Figshare (submittedVersion, cc-by)
- Funders
- Engineering and Physical Sciences Research Council (EP/T518128/1)
- UK Research and Innovation (EP/X021386/1)
- Basic Energy Sciences (DE SC0021166)
- British Council (1169015801, 815382180)
- Research England (Aston Institute for Membrane Excellence)
- Topics
- Physical Sciences › Materials Science › Materials Chemistry › Block Copolymer Self-Assembly
- Physical Sciences › Chemistry › Organic Chemistry › Advanced Polymer Synthesis and Characterization
- Physical Sciences › Materials Science › Polymers and Plastics › Polymer crystallization and properties
- Keywords
- microphase separation, block copolymer self-assembly, Flory-Huggins interaction parameter, phase diagram, domain spacing, chain stiffness, RAFT polymerization, nanoscale morphology, interfacial width
About these checks
Registry, retraction, Cites and statistics results are computed, not judged, with one exception: a printed reference that no index lists is read once by a model before it counts as a citation error. Claims are extracted by a model and kept only when their quote appears verbatim in the text; each cited source is then checked, with a model’s help, for whether it says what the claim relies on. Those verdicts can be wrong — read the claim’s quote and the cited source before relying on one.
A language model drew the claims from the paper on 2026-10-09, under version 3 of the claim definition (model deepseek-v4.1-flash, prompt extract-v3).
A second model labelled each claim on 2026-10-09 (model jev-1.13-20260917, definition revision gold-guideline-v0.2).
Statistics and arithmetic are recomputed, not judged.
Confidence bands are shown only for fields calibrated on our annotated test set. None is calibrated yet, so no band is shown.
What counts as a claim ›How we measure confidence ›How we check this ›
Are you an author, or do you see a problem with this page? Request a review
Data sources
Bibliographic data: Semantic Scholar, OpenAlex, Crossref.
Contains information from the Semantic Scholar Academic Graph Datasets, made available under the ODC Attribution License (ODC-BY 1.0).
Semantic Scholar’s data is described in: Kinney, R., et al. (2023). The Semantic Scholar Open Data Platform. arXiv:2301.10140.
