

The DOI matches its Crossref record; 56 of the 56 references it cites were found in a registry or an index; none of the 23 sources its claims cite is checked for support yet.
High Spatiotemporal Resolution River Networks Mapping on Catchment Scale Using Satellite Remote Sensing Imagery and DEM Data
Open accessPublished version of a preprint
Abstract
Characterizing and understanding the changes in the flow regimes of rivers have been challenging. Existing global river network data sets are not updated and can only identify rivers wider than 30 m. We propose a novel automated method to map river networks on a monthly basin scale for the first time at 10‐m resolution using Sentinel‐1 Synthetic Aperture Radar, Sentinel‐2 multispectral images, and the AW3D30 Digital Surface Model. This method achieved an overall accuracy of 95.8%. The total length of the Yellow River network produced is 40,280 km, approximately 3.2 times that of the Global River Widths from Landsat (GRWL) database, more effectively covering small and medium rivers. The monthly river geometry revealed a positive correlation between river network area and precipitation. This study is expected to provide a cost‐effective alternative to accurately mapping global river networks and advance our understanding of the changes and drivers of river systems.
Overview
CoChat Summary
TL;DR
The paper presents an automated method that fuses Sentinel-1 SAR, Sentinel-2 multispectral imagery, and AW3D30 DSM to map monthly river networks at 10-m resolution across the Yellow River Basin. It reports 95.8% overall accuracy and a 40,280-km network, about 3.2 times the GRWL database, with monthly area changes positively correlated with precipitation.
Key findings
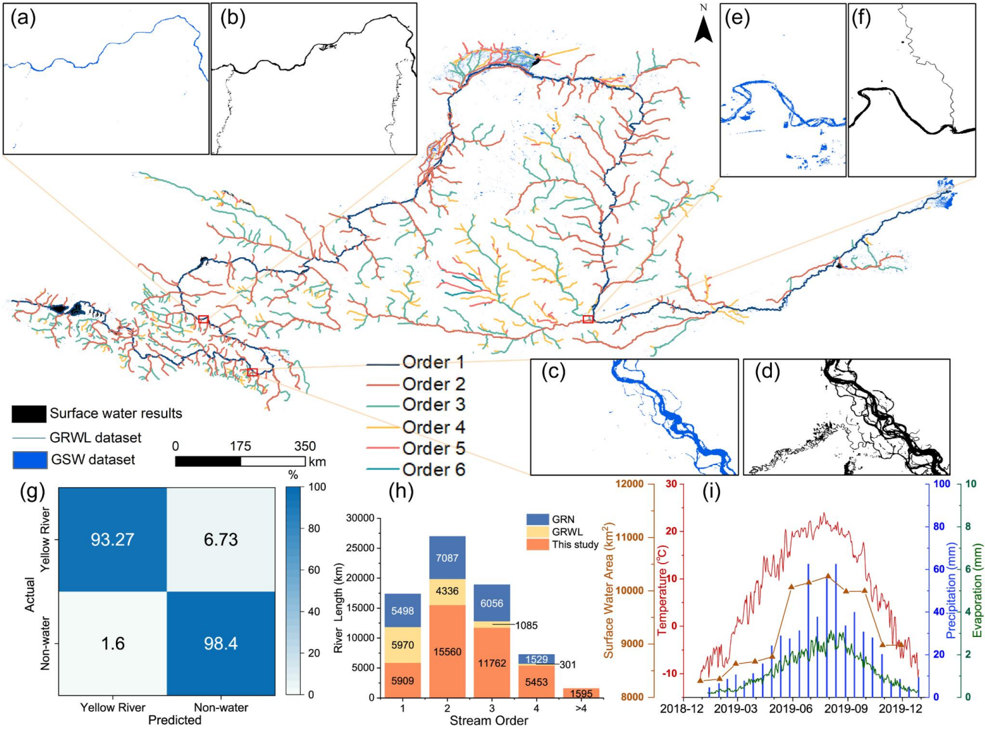
- The method achieved an overall accuracy of 95.77% (abstract: 95.8%), with user accuracy 95.83% and producer accuracy 95.84%, based on 2,556 random “true water” and 2,430 random “true non-water” validation points.
- The Yellow River network total length was 40,280 km; the abstract states this is approximately 3.2 times the GRWL database, while the discussion reports it as 28,587 km longer than all rivers in GRWL and 19,389 km longer than GRN. The OWF index was approximately 3.2 times that of GRWL, and drainage density was approximately three times higher than GRWL and GSW.
- Monthly 2019 maps showed river density increasing from 0.038 km⁻¹ in January–February to 0.042 km⁻¹ in March–April, reaching an annual maximum of 0.053 km⁻¹ in July with total length 40,280 km. Minimum network area was 8,306 km² in January and maximum was 10,267 km² in August; river network area was positively correlated with precipitation and primarily controlled by seasonal precipitation because monthly precipitation is 10–20 times evaporation.
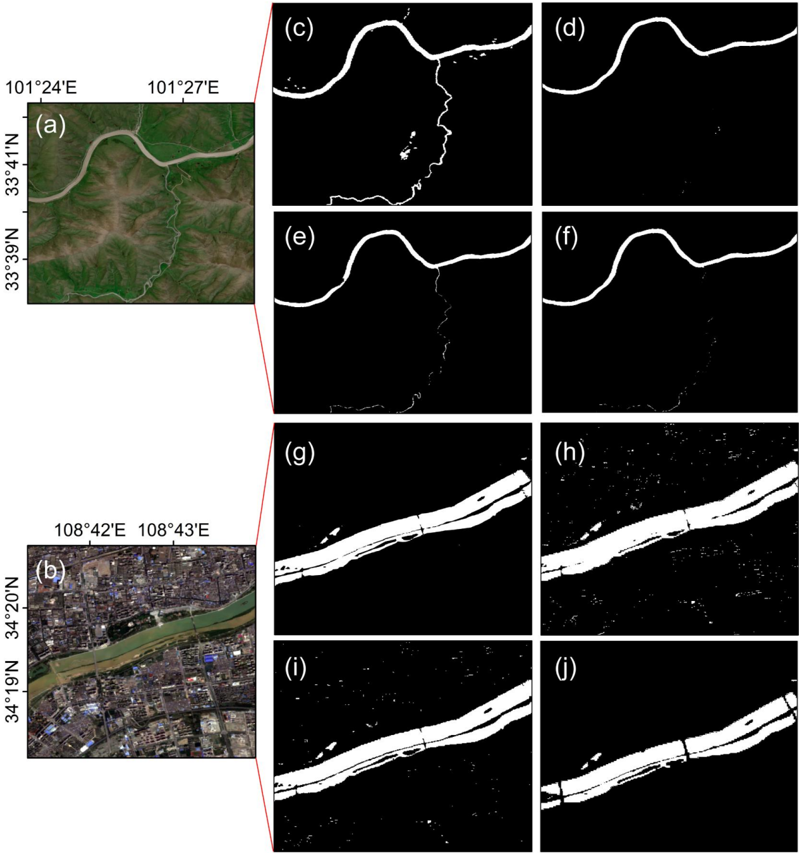
- The method better suppressed shadow noise in urban high-rise and mountainous areas and extracted more small and medium rivers than MNDWI, Zou et al. (2018), and APWC; connected rivers of order ≥4 were longer than in GRWL and GRN.
Methods
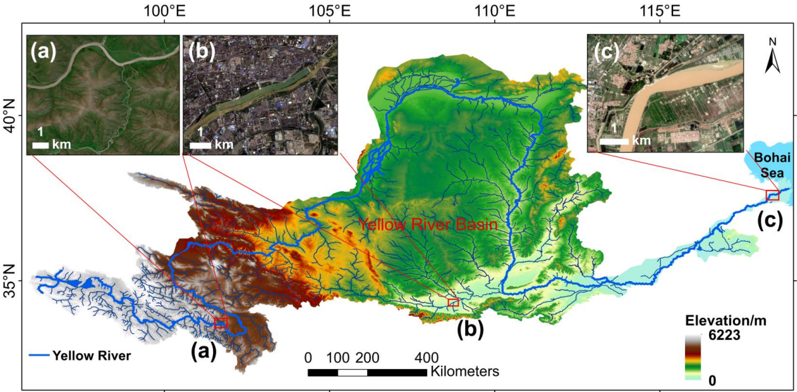
- Study area: Yellow River Basin; period January–December 2019; data included 6,357 Sentinel-2 images, Sentinel-1 GRD supplements, AW3D30 DSM, GSW, ESRI 2020 Land Cover, and ERA5 climate data.
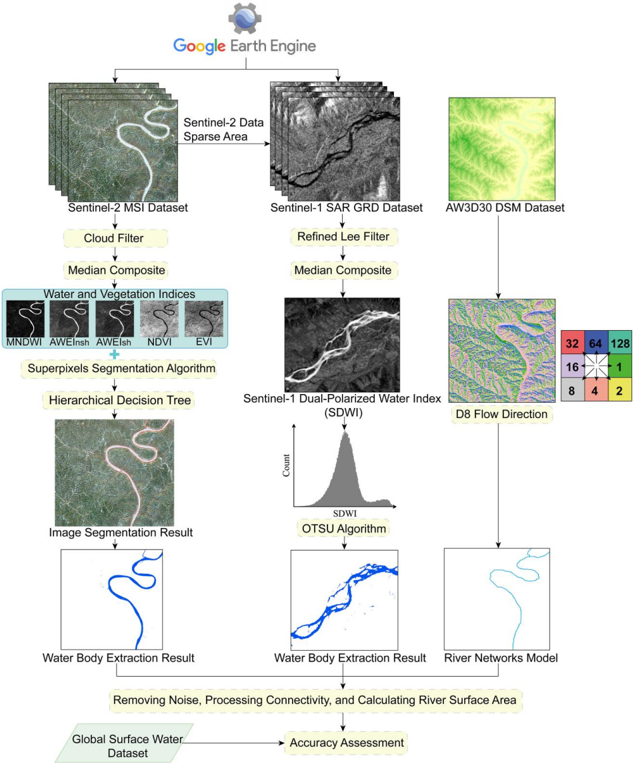
- Water extraction: cloud/shadow masking and monthly median composites; SNIC superpixels with a decision tree trained on 10,093 water and 9,905 non-water samples; threshold rule ((AWEIₙₛₕ > 0.6 or AWEIₛₕ > 0) and (MNDWI > EVI or MNDWI > NDVI)); SAR refined Lee filter, SDWI, and OTSU thresholding; paddy fields removed using NDVI time series.
- River network extraction: RivWidthCloud centerlines; AW3D30 DSM depression filling, D8 flow direction, confluence accumulation, and buffers to connect fragmented networks; accuracy assessed with random points and compared with GRWL, GSW, and GRN; climate correlations used ERA5 precipitation, temperature, and evaporation.
Limitations
- Stated: river networks were most accurate and complete when river width was greater than 30 m, broken river lines may exist in areas less than 30 m wide, and ice/snow cover effects on extraction errors cannot be completely eliminated in the Qinghai-Tibet Plateau. The GSW data set contained artificial wetlands not considered part of river networks, so its OWF index was higher than the study’s results.
- Evident: the demonstration is limited to one basin (Yellow River) and one year (2019), so global applicability and long-term performance are not established.
- Evident: monthly mapping depends on satellite data availability and cloud gaps, and the threshold rules were calibrated for this region; potential uncertainty from DEM vertical errors and transferability of thresholds is not quantified.
Model-written summary. Check it against the paper before relying on it.
Integrity signals
Registry
Cites
Statistics
Figures




Verification
Claims the paper makes
0 Valid · 3 Not valid · 16 Not checked · 54 Own results and interpretations
A result the paper reports from its own data — it cites no other source for it, so there is none to check. The quote shows it is in the paper.
In the paper
“At this time, the total length of the river was 40,280 km and the density of the river system was 0.053 km 1 , both of which increased to the annual maximum.”
§ High Spatiotemporal Resolution River Networks Mapping on Catchment Scale Using Satellite Remote Sensing Imagery and DEM Data > 3. Results
plain- Asserted: passes — The authors put it forward as true.
- Checkable: passes — It can be checked against evidence.
- Load-bearing: unclear — It is unclear whether the paper’s conclusions depend on it.
- Based: passes — The paper gives a reason why it holds.
A result the paper reports from its own data — it cites no other source for it, so there is none to check. The quote shows it is in the paper.
In the paper
“The OWF index of the Yellow River network map was approximately 3.2 times that of the GRWL data set.”
§ High Spatiotemporal Resolution River Networks Mapping on Catchment Scale Using Satellite Remote Sensing Imagery and DEM Data > 4. Discussion
plain- Asserted: passes — The authors put it forward as true.
- Checkable: passes — It can be checked against evidence.
- Load-bearing: passes — The paper’s conclusions depend on it.
- Based: passes — The paper gives a reason why it holds.
A result the paper reports from its own data — it cites no other source for it, so there is none to check. The quote shows it is in the paper.
In the paper
“The minimum area of the river networks appeared in January, with a total area of 8,306 km 2 and the maximum area occurred in August, with a total area of 10,267 km 2”
§ High Spatiotemporal Resolution River Networks Mapping on Catchment Scale Using Satellite Remote Sensing Imagery and DEM Data > 4. Discussion
plain- Asserted: passes — The authors put it forward as true.
- Checkable: passes — It can be checked against evidence.
- Load-bearing: unclear — It is unclear whether the paper’s conclusions depend on it.
- Based: passes — The paper gives a reason why it holds.
A result the paper reports from its own data — it cites no other source for it, so there is none to check. The quote shows it is in the paper.
In the paper
“Furthermore, 95.31% of the water sample points show AWEI nsh > 0.6 (Figure S4g in Supporting Information S1), whereas 91.21% of the water sample points show AWEI sh > 0 (Figure S4h in Supporting Information S1).”
§ High Spatiotemporal Resolution River Networks Mapping on Catchment Scale Using Satellite Remote Sensing Imagery and DEM Data > 2.2.2. Water Body Extraction
plainn = 10,093- Asserted: passes — The authors put it forward as true.
- Checkable: passes — It can be checked against evidence.
- Load-bearing: passes — The paper’s conclusions depend on it.
- Based: passes — The paper gives a reason why it holds.
A result the paper reports from its own data — it cites no other source for it, so there is none to check. The quote shows it is in the paper.
In the paper
“Particularly, the length of connected rivers of order ≥4 in our data set is longer than that of the GRWL data set and GRN data set, indicating that our results have a better coverage of small and medium-sized rivers (Movie S1 in Supporting Information S1).”
§ High Spatiotemporal Resolution River Networks Mapping on Catchment Scale Using Satellite Remote Sensing Imagery and DEM Data > 4. Discussion
plain- Asserted: passes — The authors put it forward as true.
- Checkable: passes — It can be checked against evidence.
- Load-bearing: passes — The paper’s conclusions depend on it.
- Based: passes — The paper gives a reason why it holds.
44 more claims
Create a free account to see all 73 claims and to verify the 15 references still open.
- It may state two separate claims as one. 16
- Probably not a substantial claim. 11
- The quote only partly states this claim. 1
Self-check
Percentages, sums and reported differences re-computed from the paper’s own numbers.
Each contradiction between two passages listed here was confirmed by an independent check.
Rated major: it would touch a result — a value a result rests on, reported and recomputed p-values on opposite sides of the significance level, two passages that conflict with no sign which is right, or a cited work retracted before this paper was published.
In the paper
§ High Spatiotemporal Resolution River Networks Mapping on Catchment Scale Using Satellite Remote Sensing Imagery and DEM Data > Abstract
“The total length of the Yellow River network produced is 40,280 km, approximately 3.2 times that of the Global River Widths from Landsat (GRWL) database”
§ High Spatiotemporal Resolution River Networks Mapping on Catchment Scale Using Satellite Remote Sensing Imagery and DEM Data > 4. Discussion
“the total length (40,280 km) of the connected rivers provided in our results was 28,587 km longer than all rivers in the GRWL data set”
Rated minor: it would not touch a result — a value no result rests on, a p-value that stays on the same side of the significance level, or a conflict that is clerical, resolved elsewhere in the paper, or outside its own findings.
In the paper
§ High Spatiotemporal Resolution River Networks Mapping on Catchment Scale Using Satellite Remote Sensing Imagery and DEM Data > 5. Conclusions
“the length of the connected rivers being three times that of the existing data sets”
§ High Spatiotemporal Resolution River Networks Mapping on Catchment Scale Using Satellite Remote Sensing Imagery and DEM Data > 4. Discussion
“the total length (40,280 km) of the connected rivers provided in our results was 28,587 km longer than all rivers in the GRWL data set, and 19,389 km longer than all rivers in the GRN data set”
Rated minor: it would not touch a result — a value no result rests on, a p-value that stays on the same side of the significance level, or a conflict that is clerical, resolved elsewhere in the paper, or outside its own findings.
In the paper
§ High Spatiotemporal Resolution River Networks Mapping on Catchment Scale Using Satellite Remote Sensing Imagery and DEM Data > 3. Results
“we used 2,556 random "true water" sampling points and 2,430 random "true non-water" points”
§ High Spatiotemporal Resolution River Networks Mapping on Catchment Scale Using Satellite Remote Sensing Imagery and DEM Data > 3. Results
“the producer accuracy also reached a high level of 95.84%, which is the number of reference sites classified accurately divided by the total number of reference sites for water”
Citations
Cites
A Threshold Selection Method from Gray-Level Histograms
Otsu, N. (1979) · IEEE Transactions on Systems, Man, and Cybernetics · doi:10.1109/tsmc.1979.4310076 · Cited by 43,398
Google Earth Engine: Planetary-scale geospatial analysis for everyone
Gorelick, N., Hancher, M., Dixon, M., Ilyushchenko, S., Thau, D., & Moore, R. (2017) · Remote Sensing of Environment · doi:10.1016/j.rse.2017.06.031 · Cited by 14,719
Monitoring Vegetation Systems in the Great Plains with Erts
Rouse, J. W., Haas, R. H., Schell, J., & Deering, D. W. (1973) · NASA STI Repository (National Aeronautics and Space Administration) · Cited by 13,378
Overview of the radiometric and biophysical performance of the MODIS vegetation indices
Huete, A., Didan, K., Miura, T., Rodriguez, E. P., Gao, X., & Ferreira, L. G. (2002) · Remote Sensing of Environment · doi:10.1016/s0034-4257(02)00096-2 · Cited by 9,869
Xu, H. (2006) · International Journal of Remote Sensing · doi:10.1080/01431160600589179 · Cited by 5,998
High-resolution mapping of global surface water and its long-term changes
Pekel, J.-F., Cottam, A., Gorelick, N., & Belward, A. S. (2016) · Nature · doi:10.1038/nature20584 · Cited by 5,513
Sentinel-2: ESA's Optical High-Resolution Mission for GMES Operational Services
Drusch, M., Del Bello, U., Carlier, S., Colin, O., Fernandez, V., Gascon, F., Hoersch, B., Isola, C., Laberinti, P., Martimort, P., et al. (2012) · Remote Sensing of Environment · doi:10.1016/j.rse.2011.11.026 · Cited by 4,815
Global carbon dioxide emissions from inland waters
Raymond, P. A., Hartmann, J., Lauerwald, R., Sobek, S., McDonald, C., Hoover, M., Butman, D., Striegl, R., Mayorga, E., Humborg, C., et al. (2013) · Nature · doi:10.1038/nature12760 · Cited by 2,553 · cited 3×
“Small river ecosystems are surprisingly active, with frequent land‐ atmosphere interactions and 50% of the total carbon emissions (Butman et al., 2016; Raymond et al., 2013).”
BackgroundTorres, R., Snoeij, P., Geudtner, D., Bibby, D., Davidson, M., Attema, E., Potin, P., Rommen, B., Floury, N., Brown, M., et al. (2012) · Remote Sensing of Environment · doi:10.1016/j.rse.2011.05.028 · Cited by 2,235
Lehner, B., & Grill, G. (2013) · Hydrological Processes · doi:10.1002/hyp.9740 · Cited by 2,193
Research works printed but not linked: 1
- 10.16232/j.cnki.1001‐4179.2019.02.038 · doi:10.16232/j.cnki.1001-4179.2019.02.038
Cited by
Satellite Requirements to Capture Water Propagation in Earth's Rivers
Cerbelaud, A., David, C. H., Pavelsky, T., Biancamaria, S., Garambois, P. ‐., Kittel, C., Papa, F., Bates, P., Tourian, M. J., Durand, M., et al. (2025) · Reviews of Geophysics · doi:10.1029/2024rg000871 · Cited by 25
Zhao, L., Fan, X., & Shihong, X. (2025) · Water · doi:10.3390/w17131971 · Cited by 21
Salandra, M. L., Colacicco, R., Panza, S., Fumai, G., Dellino, P., & Capolongo, D. (2025) · International Journal of Applied Earth Observation and Geoinformation · doi:10.1016/j.jag.2025.104720 · Cited by 16
Li, P., Li, S., Li, Z., Liang, C., & Wang, H. (2024) · Earth Surface Processes and Landforms · doi:10.1002/esp.5950 · Cited by 11
Self-citationChang, M., Li, P., Li, Z., & Wang, H. (2025) · Estuarine Coastal and Shelf Science · doi:10.1016/j.ecss.2025.109264 · Cited by 11
Self-citationA hydrogeomorphology-informed method for mapping continuous river networks from satellite imagery
Yi, X., Yang, K., Mao, W. B., Man, M., Chen, D., & Liu, J. (2025) · GIScience & Remote Sensing · doi:10.1080/15481603.2025.2529620 · Cited by 5
Qiu, Z., Liu, D., Yan, N., Yao, Y., Chen, Y., Zhang, C., & Duan, H. (2025) · Remote Sensing of Environment · doi:10.1016/j.rse.2025.114994 · Cited by 5
Jaramillo, F., Papa, F., Wang, J., Wdowinski, S., Destouni, G., & Famiglietti, J. S. (2025) · Water Resources Research · doi:10.1029/2025wr040585 · Cited by 4
Yu, H., Yang, M., Lv, X., Ai, T., & Li, J. (2026) · International Journal of Applied Earth Observation and Geoinformation · doi:10.1016/j.jag.2026.105120 · Cited by 4
Impact of Spatial Scale on Optical Earth Observation‐Derived Seasonal Surface Water Extents
Gaines, M. D., Tulbure, M. G., Perin, V., Boast, D., Castellanos-Quiroz, H. O. A., Composto, R., Tiwari, V., & Caineta, J. (2026) · Geophysical Research Letters · doi:10.1029/2025gl119880 · Cited by 4
Li, P., Bai, J., Shen, L., Tang, W., Liang, C., Zhao, B., Li, Z., & Wang, H. (2026) · International Journal of Applied Earth Observation and Geoinformation · doi:10.1016/j.jag.2025.105047 · Cited by 3
Self-citationDistribution pattern of carbon storage by native vegetation in the Yellow River Estuary
Wang, Y., Li, P., Bi, N., Wu, X., & Wang, H. (2026) · Estuarine Coastal and Shelf Science · doi:10.1016/j.ecss.2026.109740 · Cited by 3
Self-citationWu, D., Quan, D., & Jin, R. (2024) · Water · doi:10.3390/w16152185 · Cited by 2
A hierarchical-modular ecosystem mapping framework for high-intensity human activity zones
Xin, J., Wang, D., Wang, Y., Tan, Y., Zheng, J., Xu, X., Lu, Y., Huang, W., Wei, Z., Zhang, H., et al. (2025) · International Journal of Digital Earth · doi:10.1080/17538947.2025.2564468 · Cited by 2
Self-citationChang, M., Li, P., Li, Z., & Wang, H. (2026) · Remote Sensing Applications Society and Environment · doi:10.1016/j.rsase.2026.101921 · Cited by 2
Self-citationZhang, M., Guo, J., Chen, Y., Nie, X., & Li, X. (2026) · IEEE Journal of Selected Topics in Applied Earth Observations and Remote Sensing · doi:10.1109/jstars.2026.3694061 · Cited by 2
High-Precision River Network Mapping Using River Probability Learning and Adaptive Stream Burning
Zang, Y., Chu, Z., Cui, Z., Shi, Z., Jiang, Q., Shen, Y., & Ding, J. (2026) · Remote Sensing · doi:10.3390/rs18020362 · Cited by 1
Tursun, A., Xie, X., Azadi, H., Eziz, A., Wang, Y., Zhu, B., & Kurban, A. (2026) · Journal of Hydrology Regional Studies · doi:10.1016/j.ejrh.2026.103158 · Cited by 1
Li, P., Zhang, J., Yu, F., Tan, K., Xu, N., Chen, C., Tang, P., Liang, C., Li, Z., & Wang, H. (2026) · IEEE Transactions on Geoscience and Remote Sensing · doi:10.1109/tgrs.2026.3686116 · Cited by 1
Self-citationThe value of increased spatial resolution for inundated area mapping in the Western United States
Puente, P., & Condon, L. E. (2026) · GIScience & Remote Sensing · doi:10.1080/15481603.2026.2665899 · Cited by 1
Long-term Detection and Spatiotemporal variation of water bodies in Hubei province from 1991 to 2022
Yang, X., Liu, Z., Li, H., Shi, J., Li, Z., & Xing, X. (2025) · International Journal of Remote Sensing · doi:10.1080/01431161.2025.2541089
Self-citationData, Scale, and Change: A Study of Hydrologic Dynamics in the Colorado River Basin
Puente, P., & Puente, P. (2025) · UA Campus Repository (The University of Arizona)
A novel river pattern classification rule based on geometric parameters of channel planform
Yang, Z., Jiang, E., Liu, Y., Wang, Y., Zhao, W., & Liu, G. (2026) · CATENA · doi:10.1016/j.catena.2026.110057
Deep Learning Techniques for Extraction of River Networks from Satellite Imagery
Devi, G. M., Chukkapalli, M. R., Raghavender, K., V, Sandhya, M. S., Padmavathy, J., Srikanth, G. K., & Shanmugam, S. K. (2026) · International Journal of Drug Delivery Technology · doi:10.25258/ijddt.16.20s.99
Zhang, H., Zhou, T., Geng, Y., Wu, N., Li, H., Liu, J., Liu, T., & Si, B. (2026) · Agriculture · doi:10.3390/agriculture16161771
Liu, J. Z., & Naar, D. F. (2026) · Sustainability · doi:10.3390/su18179139
Chen, M., Cheng, L., Wu, Y., Lu, M., Wu, S., Zhang, L., & Liu, P. (2026) · Journal of Hydrology Regional Studies · doi:10.1016/j.ejrh.2026.104040
Zhang, Y., Yang, K., Yi, X., Guo, X., Zhu, Y., & Wang, Y. (2026) · Journal of Hydrology · doi:10.1016/j.jhydrol.2026.136656
Self-citationSamaras, A. G., & Nones, M. (2026) · EarthArXiv (California Digital Library) · doi:10.31223/x57j9h
Zhang, L., Zhao, Y., Dubovyk, O., He, M., Dou, Z., He, T., Abramowicz, A. K., Yao, J., Chang, H., & Ren, H. J. (2026) · Waste Management · doi:10.1016/j.wasman.2026.115990
Metadata
- Authors
- Li, P., Zhang, Y., Liang, C., Wang, H., & Li, Z.
- Affiliations
- Qingdao National Laboratory for Marine Science and Technology (CN)
- Peking University (CN)
- Chang'an University (CN)
- Corresponding author
- Wang, Houjie
- Venue
- Geophysical Research Letters
- Publisher
- American Geophysical Union (AGU)
- Published
- 2024-03-22
- Volume
- 51
- Issue
- 6
- ISSN
- 0094-8276 (ISSN-L)
- 1944-8007
- OpenAlex
- W4393090964
- Semantic Scholar
- 0cf30e4eb4e68d2465e1dbd7e95e1fc748716a94
- Cited by
- 30
- References
- 55
- Citations by year
- 2026: 18 · 2025: 10 · 2024: 2
- FWCI
- 3.20
- Type
- journal article
- Language
- en
- Open access
- gold
- doi.org
- Licence
- cc-by-nc-nd
- creativecommons.org/licenses/by-nc-nd/4.0/ (vor)
- doi.wiley.com/10.1002/tdm_license_1.1 (tdm)
- Locations
- Geophysical Research Letters (publishedVersion, cc-by-nc-nd)
- DOAJ (DOAJ: Directory of Open Access Journals) (submittedVersion, cc-by-sa)
- Funders
- National Natural Science Foundation of China (42041005‐4)
- Topics
- Physical Sciences › Environmental Science › Global and Planetary Change › Flood Risk Assessment and Management
- Physical Sciences › Environmental Science › Water Science and Technology › Hydrology and Watershed Management Studies
- Physical Sciences › Computer Science › Computer Vision and Pattern Recognition › Automated Road and Building Extraction
- Keywords
- river network mapping, high spatial and temporal resolution, Sentinel-1 SAR, Sentinel-2 imagery, small and medium rivers, Yellow River, flow regime alteration
About these checks
Registry, retraction, Cites and statistics results are computed, not judged, with one exception: a printed reference that no index lists is read once by a model before it counts as a citation error. Claims are extracted by a model and kept only when their quote appears verbatim in the text; each cited source is then checked, with a model’s help, for whether it says what the claim relies on. Those verdicts can be wrong — read the claim’s quote and the cited source before relying on one.
A language model drew the claims from the paper on 2026-11-18, under version 3 of the claim definition (model deepseek-v4.1-flash, prompt extract-v3).
A second model labelled each claim on 2026-11-18 (model jev-1.13-20260917, definition revision gold-guideline-v0.2).
Statistics and arithmetic are recomputed, not judged.
Confidence bands are shown only for fields calibrated on our annotated test set. None is calibrated yet, so no band is shown.
What counts as a claim ›How we measure confidence ›How we check this ›
Are you an author, or do you see a problem with this page? Request a review
Data sources
Bibliographic data: Semantic Scholar, OpenAlex, Crossref.
Contains information from the Semantic Scholar Academic Graph Datasets, made available under the ODC Attribution License (ODC-BY 1.0).
Semantic Scholar’s data is described in: Kinney, R., et al. (2023). The Semantic Scholar Open Data Platform. arXiv:2301.10140.
