

The DOI matches its Crossref record; 1 of the 1 references it cites were found in a registry or an index.
Improving Manning's n in Flood Models Using 3D Point Clouds, Flume Experiments, and Deep Learning
Abstract
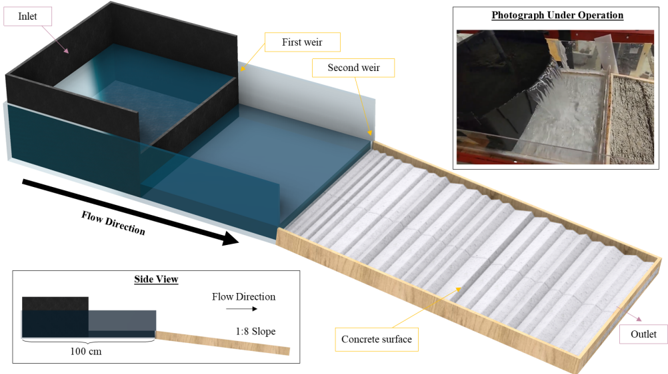
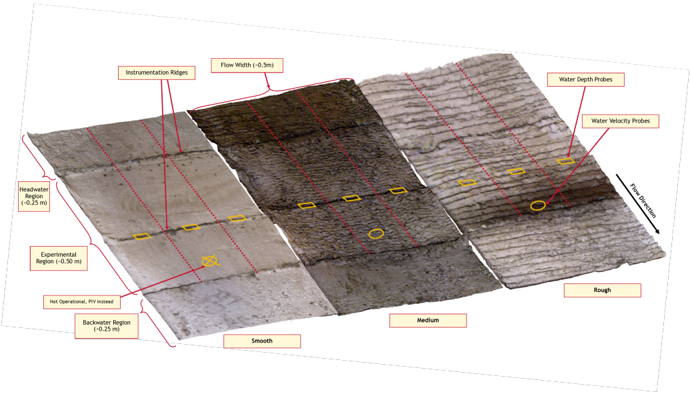
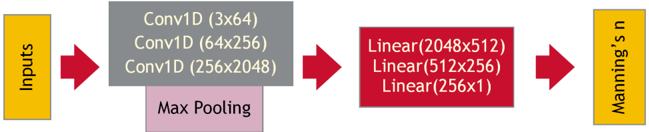
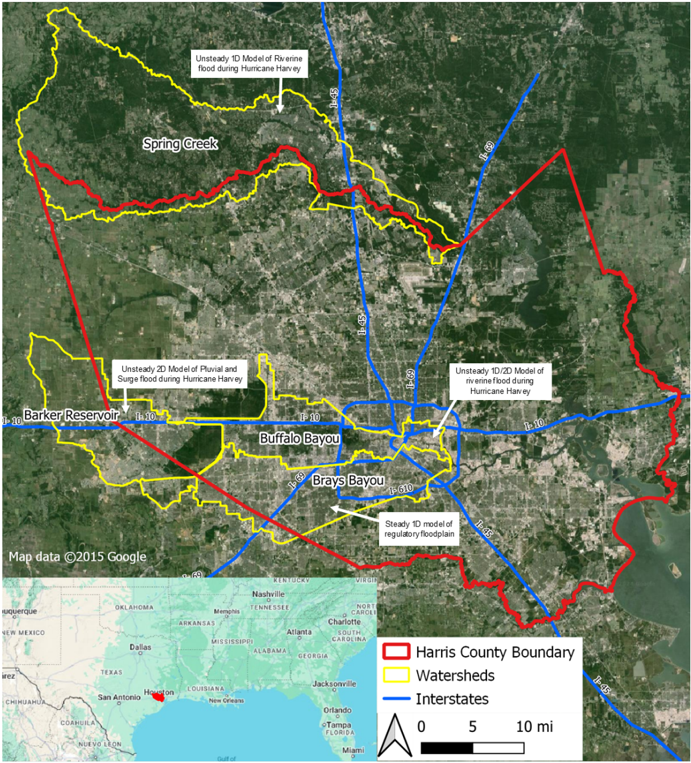
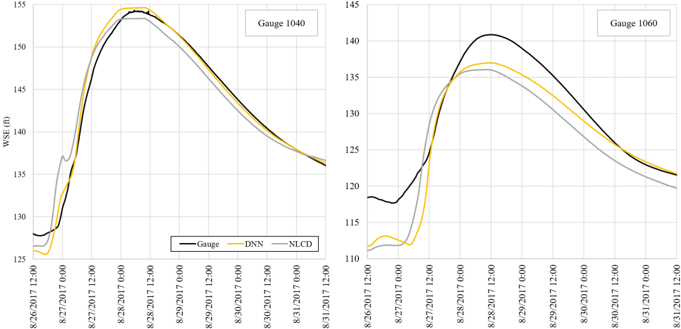
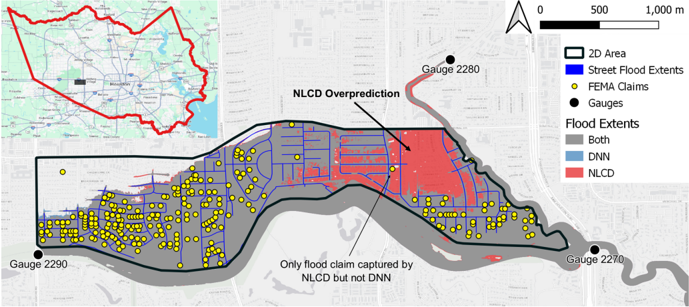
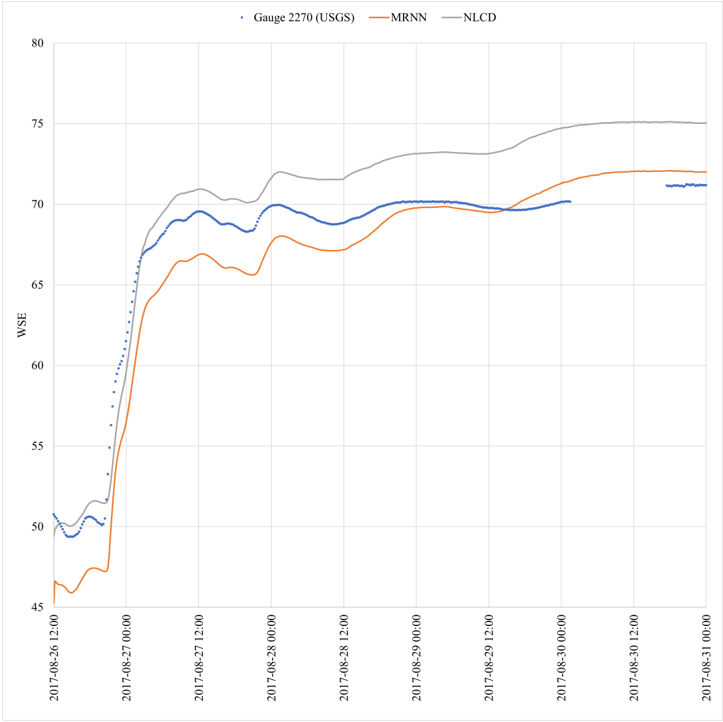
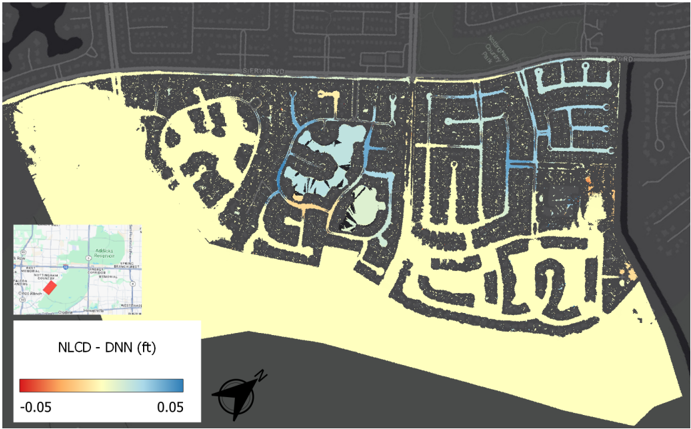
Friction is one of the cruxes of hydrodynamic modeling; flood conditions are highly sensitive to the Friction Factors (FFs) used to calculate momentum losses. However, empirical FFs are challenging to derive, causing flood models to rely on surrogate observations (such as land cover) and introducing uncertainty. This research presents a laboratory‐trained Deep Neural Network (DNN), developed using flume experiments, to estimate Manning's n based on Point Cloud (PC) data. The DNN was deployed on real‐world lidar PCs to directly estimate Manning's n under regulatory and extreme storm events, showing improved modeling capabilities in both 1D and 2D hydrodynamic models. For 1D models, the lidar estimates decreased differences with values assigned by experts through engineering judgment. For 1D/2D coupled models, the lidar values produced better agreement with flood extents obtained from airborne imagery, while better matching flood insurance claim data for Hurricane Harvey. In both 1D and 1D/2D coupled models, lidar resulted in better agreement with validation gauges. For these reasons, the lidar values of Manning's n were found to improve both regulatory models and forecasts for extreme storm events, while simultaneously providing a pathway to standardize the estimation of FFs. Changing from land cover to lidar estimates significantly affected fluvial and pluvial flood models, while surge flooding was generally unaffected. Downstream flow conditions were found to change the impacts of FFs to fluvial models. This manuscript introduces a reliable, repeatable, and readily accessible avenue for high‐resolution friction estimation based on 3D PCs, improving flood prediction, and removing uncertainty from hydrodynamic modeling.
Overview
The claims and statistics of this paper haven’t been checked yet.
Run the check — free, no account needed. It reads the open-access text and checks the sources it cites.
Integrity signals
Registry
Cites
Statistics
Figures
Verification
Claims the paper makes
The claims and statistics of this paper haven’t been checked yet.
Run the check — free, no account needed. It reads the open-access text and checks the sources it cites.
Claims other papers make about this one
Each is checked against this paper’s own text: does it say what the citing paper says it does?
The source backs part of the claim, not all of it — or backs it for a different population, condition or comparison.
In the citing paper
“However, prevailing flood risk assessment frameworks remain constrained by static hydraulic paradigms 10 .”
From AI-driven digital twinning quantifies the trade-off between flood conveyance and riparian stability under climate extremes (2026) · cites this paper as [10]
Experimental — accuracy not yet measured
Self-check
Percentages, sums and reported differences re-computed from the paper’s own numbers.
The self-check needs the paper’s full text.
Citations
Cites
Adam: A Method for Stochastic Optimization
Kingma, D. P., & Ba, J. (2014) · arXiv · doi:10.48550/arxiv.1412.6980 · Cited by 98,946
Research works printed but not linked: 47
- 10.1016/j.geomorph.2013.10.017 · DOI
- AECOM, 2018, 2018 coastal Texas Lidar final qa/qc report (Tech. Rep.)
- 10.1029/2023ef004257 · DOI
- 10.1029/2009wr008318 · DOI
- 10.1029/2023gl105588 · DOI
- 10.15233/gfz.2020.37.9 · DOI
- 10.3390/rs6021739 · DOI
- Dulin M., 2022, From rainfall totals to oral histories, hurricane harvey data offers multiple portraits of a disaster, Rice Kinder Institute for Urban Research
- 10.1111/jfr3.12716 · DOI
- Einstein H., 1934, Der hydraulische oder profil‐radius, Schweizerische Bauzeitung, 103, 89
- 10.1029/2022wr032404 · DOI
- Fischenich C. (2000).Robert Manning (a historical perspective). Retrieved fromhttps://citeseerx.ist.psu.edu/document?repid=rep1&type=pdf&doi=c57512d641968e4e21700f0018bbc95e2f3a4371 · DOI
- 10.3390/rs14030454 · DOI
- 10.1007/s12040‐015‐0644‐z · DOI
- 10.3390/w12082259 · DOI
- 10.3390/app11199267 · DOI
- 10.1080/01431161.2010.531788 · DOI
- Haces‐Garcia F., 2023, American geophysical union
- HCFCD, 2009 hydrology and hydraulics guidance manual, (Section II.2.3)
- HCFCD, 2019 policy criteria and procedure manual, (Section 4.3)
- 10.1016/s0341‐8162(03)00058‐4 · DOI
- Horton R. E., 1933, Separate roughness coefficients for channel bottom and sides, Engineering News Record, 111, 652
- HR Wallingford, Twin wire wave probes
- 10.1002/esp.1208 · DOI
- Limerinos J. T., 1970, Determination of the Manning coefficient from measured bed roughness in natural channels
- 10.1109/tit.1982.1056489 · DOI · Paper page
- 10.1016/j.geomorph.2022.108334 · DOI
- 10.3390/jmse11112053 · DOI
- 10.1016/j.jhydrol.2012.05.043 · DOI
- 10.1109/JSTARS.2015.2419817 · DOI
- 10.1080/00221686.2008.9521855 · DOI
- Musleh F. A., 2004, Geo Jordan 2004: Advances in geotechnical engineering with emphasis on dams, highway materials, and soil improvement, 145, 10.1061/40735(143)12 · DOI
- 10.1007/s11269‐018‐2141‐z · DOI
- 10.5194/hess‐17‐4015‐2013 · DOI
- 10.1109/cvpr.2017.16 · DOI
- Schmidt O. J., 1959, Measurement of Manning’s roughness coefficient, Sewage and Industrial Wastes, 31, 995
- 10.1007/s11069‐021‐04922‐3 · DOI
- 10.1016/j.catena.2023.107093 · DOI
- 10.1177/0309133307081289 · DOI
- 10.1016/j.rse.2007.07.012 · DOI
- Te Chow V., 1959, Open‐channel hydraulics
- Whatmore S. &Landstrom C.(2011).Manning’s n – Putting roughness to work.https://doi.org/10.1017/CBO9780511762154 · DOI
- 10.1002/hyp.1049 · DOI
- 10.1016/j.hydroa.2019.100039 · DOI
- 10.1007/s11269‐023‐03514‐z · DOI
- Zhang M., 2021, Adaptive risk minimization: Learning to adapt to domain shift, Advances in Neural Information Processing Systems, 34, 23664
- 10.1038/s41586‐018‐0676‐z · DOI
Cited by
Shin, J. H., Go, S. H., & Park, J. H. (2026) · Scientific Reports · doi:10.1038/s41598-026-63704-8
Metadata
- Authors
- Haces‐Garcia, F., Kotzamanis, V., Glennie, C. L., & Rifai, H. S.
- Affiliations
- National Center for Airborne Laser Mapping Houston TX USA
- Department of Civil and Environmental Engineering University of Houston Houston TX USA
- Venue
- Water Resources Research
- Publisher
- American Geophysical Union (AGU)
- Published
- 2025-03
- Volume
- 61
- Issue
- 3
- ISSN
- 0043-1397
- 1944-7973
- Cited by
- 6
- References
- 1
- Language
- en
- Funders
- National Science Foundation (1830734)
- University of Houston
About these checks
Registry, retraction, Cites and statistics results are computed, not judged, with one exception: a printed reference that no index lists is read once by a model before it counts as a citation error. Claims are extracted by a model and kept only when their quote appears verbatim in the text; each cited source is then checked, with a model’s help, for whether it says what the claim relies on. Those verdicts can be wrong — read the claim’s quote and the cited source before relying on one.
Statistics and arithmetic are recomputed, not judged.
Confidence bands are shown only for fields calibrated on our annotated test set. None is calibrated yet, so no band is shown.
What counts as a claim ›How we measure confidence ›How we check this ›
Are you an author, or do you see a problem with this page? Request a review
Data sources
Bibliographic data: Semantic Scholar, OpenAlex, Crossref.
Contains information from the Semantic Scholar Academic Graph Datasets, made available under the ODC Attribution License (ODC-BY 1.0).
Semantic Scholar’s data is described in: Kinney, R., et al. (2023). The Semantic Scholar Open Data Platform. arXiv:2301.10140.
