

The DOI matches its Crossref record; 38 of the 39 references it cites were found in a registry or an index.
MiR-125b acts as an oncogene in glioblastoma cells and inhibits cell apoptosis through p53 and p38MAPK-independent pathways
Open accessAbstract
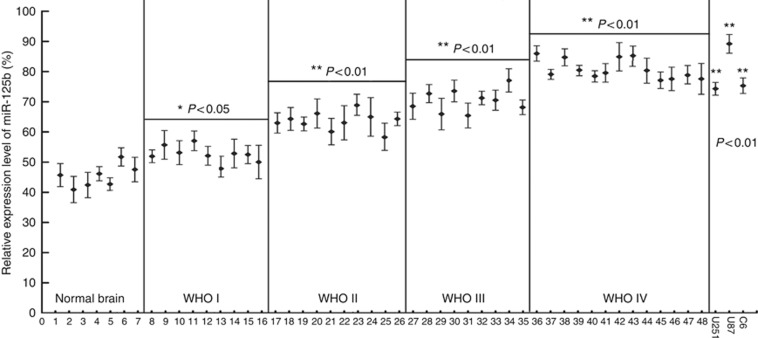
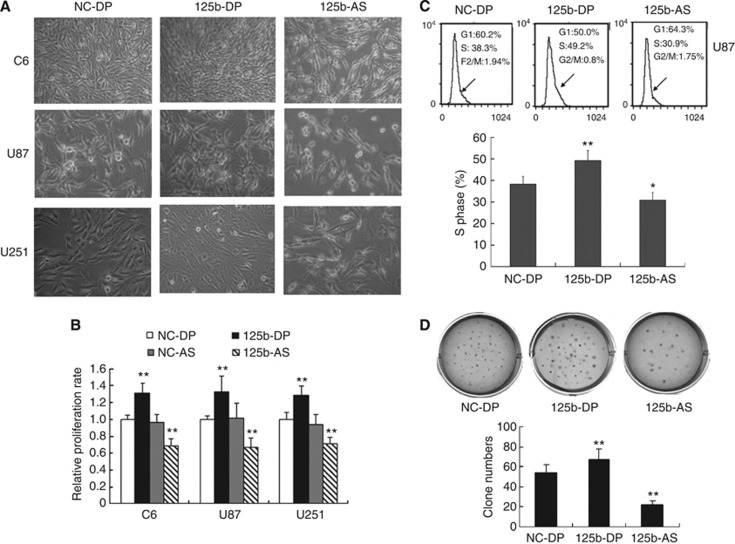
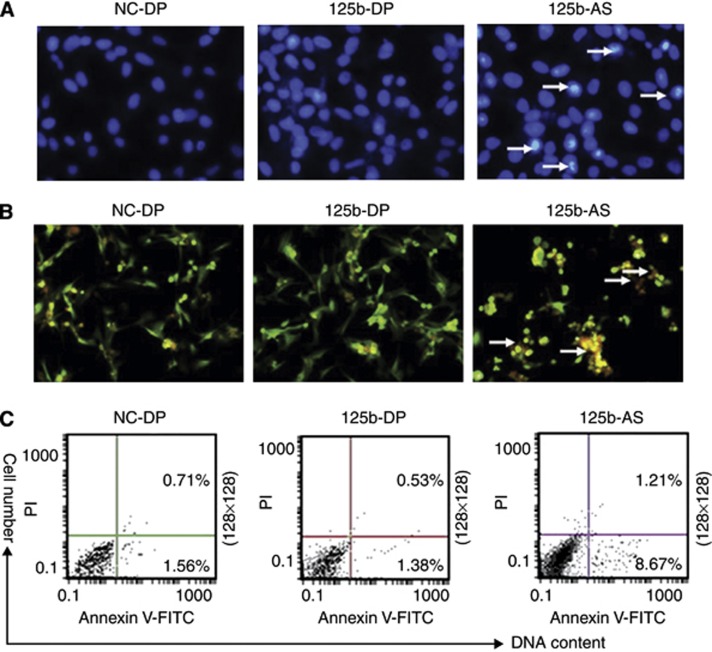
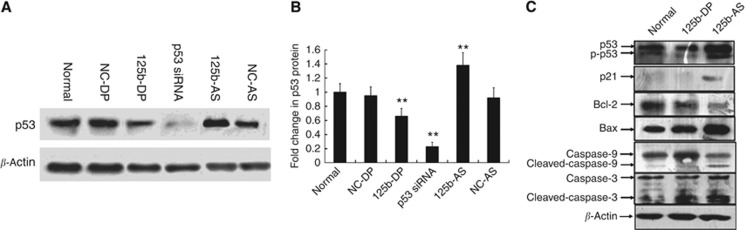
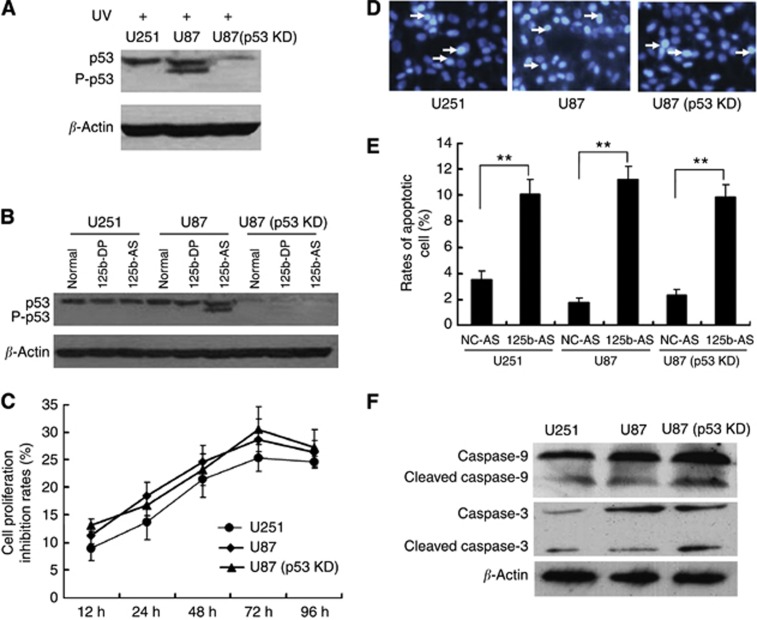
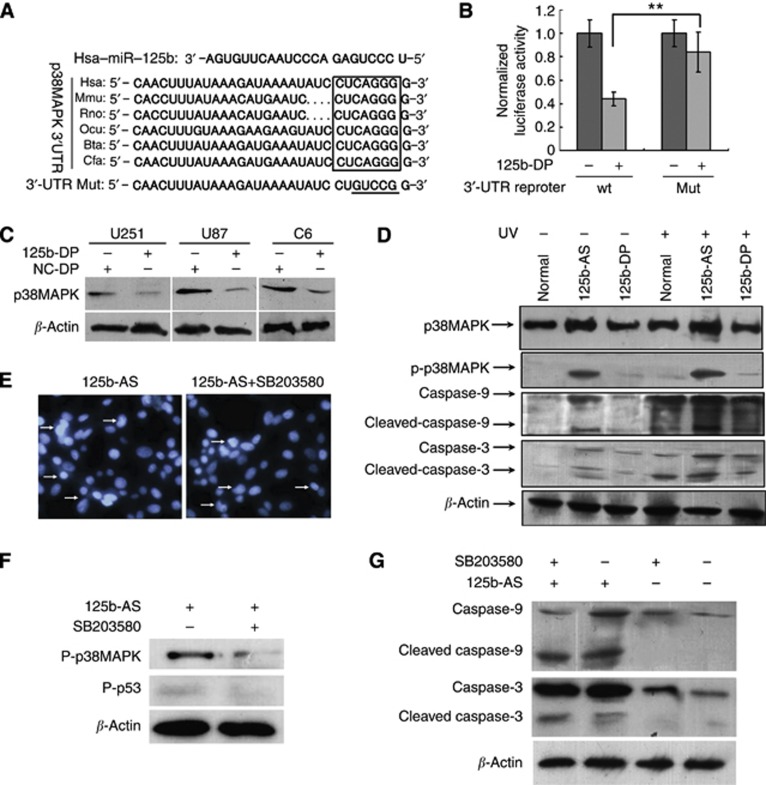
BACKGROUND: We have recently identified miR-125b upregulation in glioblastoma (GMB). The aim of this study is to determine the correlation between miR-125b expression and malignant grades of glioma and the genes targeted by miR-125b. METHODS: Real-time PCR was employed to measure the expression level of miR-125b. Cell viability was evaluated by cell growth and colony formation in soft-agar assays. Cell apoptosis was determined by Hoechst 33342 staining and AnnexinV-FITC assay. The Luciferase assay was used to confirm the actual binding sites of p38MAPK mRNA. Western blot was used to detect the gene expression level. RESULTS: The expression level of miR-125b is positively correlated with the malignant grade of glioma. Ectopic expression of miR-125b promotes the proliferation of GMB cells. Knockdown of endogenous miR-125b inhibits cell proliferation and promotes cell apoptosis. Further studies reveal that p53 is regulated by miR-125b. However, downregulation of the endogenous miR-125b also results in p53-independent apoptotic pathway leading to apoptosis in p53 mutated U251 cells and p53 knockdown U87 cells. Moreover, p38MAPK is also regulated by miR-125b and downregulation of miR-125b activates the p38MAPK-induced mitochondria apoptotic pathway. CONCLUSION: High-level expression of miR-125b is associated with poor outcomes of GMB. MiR-125b may have an oncogenic role in GMB cells by promoting cell proliferation and inhibiting apoptosis.
Overview
The claims and statistics of this paper haven’t been checked yet.
Run the check — free, no account needed. It reads the open-access text and checks the sources it cites.
Integrity signals
Registry
Cites
Statistics
Figures
Verification
Claims the paper makes
The claims and statistics of this paper haven’t been checked yet.
Run the check — free, no account needed. It reads the open-access text and checks the sources it cites.
Claims other papers make about this one
Each is checked against this paper’s own text: does it say what the citing paper says it does?
The cited source doesn’t support the claim as written.
In the citing paper
“P53 is in turn regulated by miR-125b, an oncogenic miRNA that is upregulated in GBM and that inhibits cell proliferation and promotes evasion of apoptosis [52].”
From The p53 Pathway in Glioblastoma (2018) · cites this paper as [52]
Checked by a reasoning model — may be wrong.
Experimental — accuracy not yet measured
Self-check
Percentages, sums and reported differences re-computed from the paper’s own numbers.
The self-check needs the paper’s full text.
Citations
Cites
MicroRNA signatures in human cancers
Calin, G. A., & Croce, C. M. (2006) · Nature reviews. Cancer · doi:10.1038/nrc1997 · Cited by 7,668
RAS Is Regulated by the let-7 MicroRNA Family
Johnson, S., Großhans, H., Shingara, J., Byrom, M., JARVIS, R., Cheng, A., Labourier, E., Reinert, K. L., Brown, D., & Slack, F. J. (2005) · Cell · doi:10.1016/j.cell.2005.01.014 · Cited by 3,699
miR-15 and miR-16 induce apoptosis by targeting BCL2
Cimmino, A., Calin, G. A., Fabbri, M., Iorio, M. V., Ferracin, M., Shimizu, M., Wojcik, S. E., Aqeilan, R. I., Zupo, S., Dono, M., et al. (2005) · Proceedings of the National Academy of Sciences · doi:10.1073/pnas.0506654102 · Cited by 3,579
Sempere, L. F., Freemantle, S., Pitha-Rowe, I., Moss, E., Dmitrovsky, E., & Ambros, V. (2004) · Genome Biology · doi:10.1186/gb-2004-5-3-r13 · Cited by 1,578
Mitogen-activated protein kinases in apoptosis regulation
Wada, T., & Penninger, J. M. (2004) · Oncogene · doi:10.1038/sj.onc.1207556 · Cited by 1,432 · cited 1×
“MiR-125b is highly expression in mouse brain and has been implicated in neuronal differentiation of mouse P19 cells by targeting the RNAbinding protein Lin-28 (Wu and Belasco, 2005).”
BackgroundMicroRNA Signatures in Human Ovarian Cancer
Iorio, M. V., Visone, R., Leva, G. D., Donati, V. L., Petrocca, F., Casalini, P., Taccioli, C., Volinia, S., Liu, C.-G., Alder, H., et al. (2007) · Cancer Research · doi:10.1158/0008-5472.can-07-1936 · Cited by 1,396
MicroRNAs — the micro steering wheel of tumour metastases
Nicoloso, M. S., Spizzo, R., Shimizu, M., Rossi, S., & Calin, G. A. (2009) · Nature reviews. Cancer · doi:10.1038/nrc2619 · Cited by 753
MicroRNA-125b is a novel negative regulator of p53Preprint
Le, M. T. N., Teh, C., Shyh‐Chang, N., Xie, H., Zhou, B., Korzh, V. P., Lodish, H. F., & Lim, B. (2009) · Genes & Development · doi:10.1101/gad.1767609 · Cited by 669
HuR recruits let-7/RISC to repress c-Myc expressionPreprint
Kim, H. H., Kuwano, Y., Srikantan, S., Lee, E. K., Martindale, J. L., & Gorospe, M. (2009) · Genes & Development · doi:10.1101/gad.1812509 · Cited by 570
Zhou, M., Liu, Z., Zhao, Y., Ding, Y., Liu, H., Xi, Y., Xiong, W., Li, G., Lu, J., Fodstad, Ø., et al. (2010) · Journal of Biological Chemistry · doi:10.1074/jbc.m109.083337 · Cited by 424
Cited by
Sorted by citations
The p53 Pathway in Glioblastoma
Zhang, Y., Dube, C., Gibert, M., Cruickshanks, N., Wang, B., Coughlan, M., Yang, Y., Setiady, I., Deveau, C., Saoud, K., et al. (2018) · Cancers · doi:10.3390/cancers10090297 · Cited by 440
MicroRNAs in glioblastoma multiforme pathogenesis and therapeutics
Shea, A. A., Harish, V., Afzal, Z., Chijioke, J., Kedir, H., Dusmatova, S., Roy, A., Ramalinga, M., Harris, B. T., Blancato, J. K., et al. (2016) · Cancer Medicine · doi:10.1002/cam4.775 · Cited by 211
Mouse models of Down syndrome: gene content and consequences
Gupta, M., Dhanasekaran, A. R., & Gardiner, K. (2016) · Mammalian Genome · doi:10.1007/s00335-016-9661-8 · Cited by 178
MicroRNA-125 in immunity and cancer
Wang, J. K., Wang, Z., & Li, G. (2019) · Cancer Letters · doi:10.1016/j.canlet.2019.04.015 · Cited by 137
Non-Coding RNAs as Mediators of Epigenetic Changes in Malignancies
Kumar, S., Gonzalez, E. A., Rameshwar, P., & Etchegaray, J. (2020) · Cancers · doi:10.3390/cancers12123657 · Cited by 144
The Emerging Roles of miR-125b in Cancers
Wang, Y., Zeng, G., & Jiang, Y. (2020) · Cancer Management and Research · doi:10.2147/cmar.s232388 · Cited by 117
Nucleic acid drug vectors for diagnosis and treatment of brain diseases
Lü, Z., Shen, J., Yang, H. J., Wang, J., Zhao, R., Zhang, T.-L., Guo, J. R., & Zhang, X. (2023) · Signal Transduction and Targeted Therapy · doi:10.1038/s41392-022-01298-z · Cited by 116
Haemmig, S., Baumgartner, U., Glück, A., Zbinden, S., Tschan, M. P., Каппелер, А., Mariani, L., Vajtai, I., & Vassella, E. (2014) · Cell Death and Disease · doi:10.1038/cddis.2014.245 · Cited by 90
A restricted signature of serum miRNAs distinguishes glioblastoma from lower grade gliomas
Regazzo, G., Terrenato, I., Spagnuolo, M., Carosi, M., Cognetti, G., Cicchillitti, L., Sperati, F., Villani, V., Carapella, C. M., Piaggio, G., et al. (2016) · Journal of Experimental & Clinical Cancer Research · doi:10.1186/s13046-016-0393-0 · Cited by 89
MicroRNAs as biomarkers for human glioblastoma: progress and potential
Huang, S., Ali, N.-D., Zhong, L., & Shi, J. (2018) · Acta Pharmacologica Sinica · doi:10.1038/aps.2017.173 · Cited by 85
Essential functions of miR‐125b in cancer
Peng, B., Theng, P. Y., & Le, M. T. N. (2020) · Cell Proliferation · doi:10.1111/cpr.12913 · Cited by 78
Zheng, Z., Qu, J.-Q., Yi, H., Ye, X., Huang, W., Xiao, T., Li, J.-Y., Wang, Y.-Y., Feng, J., Zhu, J.-F., et al. (2017) · Cell Death and Disease · doi:10.1038/cddis.2017.211 · Cited by 71
Zuberi, M., Khan, I., Mir, R., Gandhi, G., Ray, P. C., & Saxena, A. (2016) · PLoS ONE · doi:10.1371/journal.pone.0153902 · Cited by 74
Wu, J.-G., Wang, J.-J., Jiang, X., Lan, J., He, X., Wang, H., Ma, Y., Xia, Y., Ru, G., Ma, J., et al. (2014) · Gastric Cancer · doi:10.1007/s10120-014-0421-8 · Cited by 67
Methylation of miRNA genes and oncogenesis
Loginov, V. I., Rykov, S. V., Fridman, M. V., & Александровна, Б. Э. (2015) · Biochemistry (Moscow) · doi:10.1134/s0006297915020029 · Cited by 66
MicroRNA (miR) 125b regulates cell growth and invasion in pediatric low grade glioma
Yuan, M., Silva, A. C. A. L. D., Arnold, A., Okeke, L., Ames, H. M., Correa-Cerro, L. S., Vizcaíno, M. A., Ho, C., Eberhart, C. G., & Rodríguez, F. J. (2018) · Scientific Reports · doi:10.1038/s41598-018-30942-4 · Cited by 63
Talekar, M., Trivedi, M. S., Shah, P., Ouyang, Q., Oka, A., Gandham, S. K., & Amiji, M. M. (2015) · Molecular Therapy · doi:10.1038/mt.2015.225 · Cited by 63
MicroRNAs in brain development and cerebrovascular pathophysiology
Ma, Q., Zhang, L., & Pearce, W. J. (2019) · American Journal of Physiology-Cell Physiology · doi:10.1152/ajpcell.00022.2019 · Cited by 64
Towards DNA-damage induced autophagy: A Boolean model of p53-induced cell fate mechanisms
Gupta, S., Silveira, D. A., & Mombach, J. C. M. (2020) · DNA repair · doi:10.1016/j.dnarep.2020.102971 · Cited by 60
Dhayat, S. A., Mardin, W. A., Seggewiß, J., Ströse, A., Matuszcak, C., Hummel, R., Senninger, N. J., Mees, S. T., & Haier, J. (2015) · PLoS ONE · doi:10.1371/journal.pone.0143755 · Cited by 59
Song, J., Ma, Q., Hu, M., Qian, D., Wang, B., & He, N. (2018) · Molecules · doi:10.3390/molecules23123259 · Cited by 56
Wu, N., Luo, J., Jiang, B., Wang, L., Wang, S., Wang, C., Fu, C., Li, J., & Shi, D. (2015) · Marine Drugs · doi:10.3390/md13021010 · Cited by 44
Self-citationTherapeutically Significant MicroRNAs in Primary and Metastatic Brain Malignancies
Balachandran, A. A., Larcher, L. M., Chen, S., & Veedu, R. N. (2020) · Cancers · doi:10.3390/cancers12092534 · Cited by 41
MicroRNAs in Glioblastoma: Role in Pathogenesis and Opportunities for Targeted Therapies
Costa, P. M., Cardoso, A. L., Mano, M., & de Lima, M. C. P. (2015) · CNS & Neurological Disorders - Drug Targets · doi:10.2174/1871527314666150116123610 · Cited by 39
Dhayat, S. A., Abdeen, B., Köhler, G., Senninger, N. J., Haier, J., & Mardin, W. A. (2015) · Clinical Epigenetics · doi:10.1186/s13148-015-0166-1 · Cited by 39
Epigenetic Underpinnings of Inflammation: A Key to Unlock the Tumor Microenvironment in Glioblastoma
Chen, N., Peng, C. Y., & Li, D. (2022) · Frontiers in Immunology · doi:10.3389/fimmu.2022.869307 · Cited by 43
Henriksen, M., Johnsen, K. B., Olesen, P., Pilgaard, L., & Duroux, M. C. (2014) · NeuroMolecular Medicine · doi:10.1007/s12017-014-8309-7 · Cited by 38
Hu, Y., Lü, L., Qiu, Z., Huang, Q., Chen, Y., & Chen, L. (2018) · Biomedicine & Pharmacotherapy · doi:10.1016/j.biopha.2018.09.129 · Cited by 38
Chen, Y., Ho, H., Lin, S., Ho, T. D.-H., & Hsu, C. (2018) · American Journal of Clinical Pathology · doi:10.1093/ajcp/aqy008 · Cited by 36
The Role of miRNA for the Treatment of MGMT Unmethylated Glioblastoma Multiforme
Kirstein, A., Schmid, T. E., & Combs, S. E. (2020) · Cancers · doi:10.3390/cancers12051099 · Cited by 34
Han, S., Meng, L., Jiang, Y., Cheng, W., Tie, X., Xia, J., & Wu, A. (2017) · British Journal of Cancer · doi:10.1038/bjc.2017.89 · Cited by 35
MiR-125b Functions as a Tumor Suppressor and Enhances Chemosensitivity to Cisplatin in Osteosarcoma
Wang, F., Yu, D., Liu, Z., Wang, R., Xu, Y. H., Cui, H., & Zhao, T. (2016) · Technology in Cancer Research & Treatment · doi:10.1177/1533034615618849 · Cited by 33
Szatkowska, M., & Krupa, R. (2020) · Cancers · doi:10.3390/cancers12071838 · Cited by 33
Li, H., Song, J., Zhang, J., Wang, T., Yan, Y., Tao, Z., Li, S., Zhang, H., Kang, T., & Yang, J. (2016) · Phytotherapy Research · doi:10.1002/ptr.5747 · Cited by 32
Wei, S., Hu, W., Feng, J., & Geng, Y. (2022) · Cell Communication and Signaling · doi:10.1186/s12964-022-00960-x · Cited by 31
Li, X., Zheng, J., Chen, L., Diao, H., & Liu, Y. (2014) · Molecular Neurobiology · doi:10.1007/s12035-014-9017-x · Cited by 30
Non-coding RNAs’ function in cancer development, diagnosis and therapy
Zhang, X., Xu, X., Song, J., Xu, Y., Qian, H., Jin, J., & Liang, Z. F. (2023) · Biomedicine & Pharmacotherapy · doi:10.1016/j.biopha.2023.115527 · Cited by 29
MicroRNA-185 downregulates androgen receptor expression in the LNCaP prostate carcinoma cell line
Liu, C., CHEN, Z., HU, X., Wang, L., Li, C., Xue, J., Zhang, P., Chen, W., & JIANG, A. (2015) · Molecular Medicine Reports · doi:10.3892/mmr.2015.3332 · Cited by 28
MiR‐125b suppresses the carcinogenesis of osteosarcoma cells via the MAPK‐STAT3 pathway
Xiao, T., Zhou, Y. L., Li, H., Xiong, L., Wang, J., Wang, Z., & Liu, L. (2018) · Journal of Cellular Biochemistry · doi:10.1002/jcb.27568 · Cited by 26
Huang, C., Tsai, K.-N., Chen, Y.-S., & Chang, R.-Y. (2021) · International Journal of Molecular Sciences · doi:10.3390/ijms22084218 · Cited by 28
A review of gliomas-related proteins. Characteristics of potential biomarkers.
Pienkowski, T., Kowalczyk, T., Kretowski, A. J., & Ciborowski, M. (2021) · PubMed Central · Cited by 26
Non-Coding RNAs and Brain Tumors: Insights Into Their Roles in Apoptosis
Tamtaji, O. R., Derakhshan, M., Noshabad, F. Z. R., Razaviyan, J., Hadavi, R., Jafarpour, H., Jafari, A., Rajabi, A., Hamblin, M. R., Mahabady, M. K., et al. (2022) · Frontiers in Cell and Developmental Biology · doi:10.3389/fcell.2021.792185 · Cited by 26
Tarai, S. K., Tarai, A., Mandal, S., Nath, B., Som, I., Bhaduri, R., Bagchi, A., Sarkar, S., Biswas, A., & Moi, S. C. (2023) · Journal of Molecular Liquids · doi:10.1016/j.molliq.2023.121921 · Cited by 26
Maqbool, R., Rashid, R., Ismail, R., Niaz, S., Chowdri, N. A., & Hussain, M. U. (2015) · Cellular Oncology · doi:10.1007/s13402-015-0240-x · Cited by 24
Li, Y., Kong, C., Wu, C., Wang, Y., Xu, B., Liang, S., & Ying, X. (2019) · Bioscience Reports · doi:10.1042/bsr20181794 · Cited by 24
Nangami, G. N., Sakwe, A. M., Izban, M. G., Rana, T., Lammers, P. E., Thomas, P. L., Chen, Z., & Ochieng, J. (2016) · Cancer Medicine · doi:10.1002/cam4.940 · Cited by 24
Zhang, X., Peng, Y., Jin, Z., Huang, W., Cheng, Y., Liu, Y., Feng, X., Yang, M., Huang, Y., Zhao, Z., et al. (2015) · Oncotarget · doi:10.18632/oncotarget.5419 · Cited by 21
Dynamic changes in circulating miRNA levels in response to antitumor therapy of lung cancer
Ponomaryova, A. A., Morozkin, E. S., RYKOVA, E. Y., Zaporozhchenko, I. A., Skvortsova, T. E., Dobrodeev, А. Y., Zav’yalov, A. A., Тузиков, С. А., Vlassov, V. V., Чердынцева, Н. В., et al. (2016) · Experimental Lung Research · doi:10.3109/01902148.2016.1155245 · Cited by 21
MicroRNA-125b targeted STAT3 to inhibit laryngeal squamous cell carcinoma cell growth and motility
Feng, J., Fan, Y., Qukuerhan, A., Zhang, H., Yong, J., & Hu, B. (2017) · Oncology Letters · doi:10.3892/ol.2017.6155 · Cited by 22
MicroRNA Function Can Be Reversed by Altering Target Gene Expression Levels
Svoronos, A. A., Campbell, S. G., & Engelman, D. M. (2021) · iScience · doi:10.1016/j.isci.2021.103208 · Cited by 19
Shi, Y., Jin, X., Yang, M. G., Jia, J., Yao, H., Yuan, W., Wang, K., & Rong, S. (2022) · Cellular Signalling · doi:10.1016/j.cellsig.2022.110270 · Cited by 18
Ren, C., Xie, R., Yao, Y., Yu, M., Chang, F., Xing, L., Zhang, Y., Liu, Y., Wang, S., Farooque, M., et al. (2019) · Viruses · doi:10.3390/v11080728 · Cited by 17
Piergentili, R., Marinelli, E., Cucinella, G., López, A., Napoletano, G., Gullo, G., & Zaami, S. (2024) · Non-Coding RNA · doi:10.3390/ncrna10020016 · Cited by 17
Prioritizing cancer-related microRNAs by integrating microRNA and mRNA datasets
Jin, D., & Lee, H. (2016) · Scientific Reports · doi:10.1038/srep35350 · Cited by 15
Huang, W., Liu, H., Pan, Y., Yang, H., Lin, J., & Zhang, H. (2021) · Journal of Cardiothoracic Surgery · doi:10.1186/s13019-021-01471-5 · Cited by 14
MicroRNA biosensors for detection of glioblastoma
Fattahi, M., Maghsudlu, M., Razipour, M., Movahedpour, A., Ghadami, M., Alizadeh, M., Khatami, S. H., Taheri‐Anganeh, M., Ghasemi, H., Ghasemi, H., et al. (2024) · Clinica Chimica Acta · doi:10.1016/j.cca.2024.117829 · Cited by 13
Wang, H.-H., Wang, Y.-C., Wu, D., Hung, C., Chen, C., & Lee, H. (2017) · Tumor Biology · doi:10.1177/1010428317694316 · Cited by 13
Lin, D., Li, W., Zhang, N., & Cai, M. M. (2022) · IET Systems Biology · doi:10.1049/syb2.12046 · Cited by 11
Zhou, E., Hui, N., Shu, M., Bai-ping, W., & Zhou, J. (2015) · Oncology Letters · doi:10.3892/ol.2015.3751 · Cited by 12
A Review of miRNA Regulation in Japanese Encephalitis (JEV) Virus Infection
Kumar, M., Sahoo, G. C., Das, V. N. R., Singh, K., & Pandey, K. (2023) · Current Pharmaceutical Biotechnology · doi:10.2174/0113892010241606231003102047 · Cited by 10
Ren, H., Qiu, W., Lu, Q., Peng, C., Ding, Y., Zhu, B., Li, Q., & Chen, X. (2019) · Journal of Clinical Neuroscience · doi:10.1016/j.jocn.2019.03.002 · Cited by 10
Stempor, P., Avni, D., Leibowitz‐Amit, R., Sidi, Y., Stępień, M., Dzieciątkowski, T., & Dobosz, P. (2021) · International Journal of Molecular Sciences · doi:10.3390/ijms22052553 · Cited by 8
Understanding the molecular profiling of diffuse gliomas classification: A brief overview
Ordóñez-Rubiano, E. G., Baldoncini, M., Cómbita, A. L., Payán‐Gómez, C., Gómez-Amarillo, D. F., Hakim, F., Figueredo, L. F., Forlizzi, V., Castillo-Rangel, C., Luzzi, S., et al. (2023) · Surgical Neurology International · doi:10.25259/sni_209_2023 · Cited by 9
[The post-transcriptional regulation of the DNA damage response].
Lin, D., Luo, Y., & Song, Y. (2014) · PubMed · Cited by 8
Zekri, A., Mesbahi, Y., Boustanipour, E., Sadr, Z., & Ghaffari, S. H. (2018) · Journal of Molecular Neuroscience · doi:10.1007/s12031-018-1118-y · Cited by 8
In vitro studies of polyethyleneimine coated miRNA microspheres as anticancer agents
Irena, R., Wu, N., Xu, H., Gedanken, A., & Lin, X. (2016) · Nano Research · doi:10.1007/s12274-016-1055-4 · Cited by 7
Self-citationReséndiz-Castillo, L. J., Minjarez, B. D., Reza-Zaldívar, E. E., Hernández-Sapiéns, M. A., Gutiérrez-Mercado, Y. K., & Canales-Aguirre, A. A. (2021) · Neurología (English Edition) · doi:10.1016/j.nrleng.2019.07.009 · Cited by 6
Maggio, I., Franceschi, E., Gatto, L., Tosoni, A., Nunno, V. D., Tonon, C., & Brandes, A. A. (2021) · Expert Review of Anticancer Therapy · doi:10.1080/14737140.2021.1971518 · Cited by 6
Brown, J. S. (2023) · Neuroscience & Biobehavioral Reviews · doi:10.1016/j.neubiorev.2023.105206 · Cited by 6
Integrative analysis of mRNA and miRNA sequencing data for gliomas of various grades
Gvaldin, D. Y., Pushkin, A. A., Тимошкина, Н. Н., Rostorguev, E. E., Nalgiev, A. M., & Kit, O. I. (2020) · Egyptian Journal of Medical Human Genetics · doi:10.1186/s43042-020-00119-8 · Cited by 5
Interplay between innate-like T-cells and microRNAs in cancer immunity
Yousefi, M. J., Afshar, Y., Amoozadehsamakoosh, A., Naseri, A., Soltani, F., Yazdanpanah, N., Saleki, K., & Rezaei, N. (2025) · Discover Oncology · doi:10.1007/s12672-025-03234-3 · Cited by 5
Natural compounds as regulators of miRNAs: exploring a new avenue for treating brain cancer
Doghish, A. S., El‐Dakroury, W. A., Abulsoud, A. I., Abdelmaksoud, N. M., Aly, S. H., Elbadry, A. M. M., Mohammed, O. A., Abdel‐Reheim, M. A., Zaki, M. B., Rizk, N. I., et al. (2025) · Naunyn-Schmiedeberg s Archives of Pharmacology · doi:10.1007/s00210-025-03934-1 · Cited by 5
In silico analysis to identify novel ceRNA regulatory axes associated with gallbladder cancer
Saklani, N., Chauhan, V., Akhtar, J., Upadhyay, S. K., Sirdeshmukh, R., & Gautam, P. (2023) · Frontiers in Genetics · doi:10.3389/fgene.2023.1107614 · Cited by 3
Rathored, J., Budhbaware, T., Chauhan, S., & Kumar, M. (2025) · IBRO Neuroscience Reports · doi:10.1016/j.ibneur.2025.11.006 · Cited by 2
Sun, J., Lou, X., Wang, Z., Li, L., Yu, H.-Y., Xu, Y., Wu, H., Luo, Y., Liu, B., Zheng, M., et al. (2015) · Neural Regeneration Research · doi:10.4103/1673-5374.152378 · Cited by 2
Piergentili, R., Gullo, G., Cucinella, G., López, A., Napoletano, G., Marinelli, E., & Zaami, S. (2023) · Preprints.org · doi:10.20944/preprints202309.1713.v1 · Cited by 1
Chiba, T., Fujisawa, M., & Maeda, T. (2025) · Clinical Nutrition ESPEN · doi:10.1016/j.clnesp.2025.11.144 · Cited by 1
Shi, J., Wang, L., Liu, L., & Su, J. (2025) · BMC Genomics · doi:10.1186/s12864-025-12342-x · Cited by 1
Prognostic Potential of MicroRNAs in Glioma Patients: A Meta-Analysis
Laghari, A. A., Suchal, Z. A., Avani, R., Khan, D. A., Sami, A., Nouman, M., & Enam, S. A. (2022) · Asian Journal of Oncology · doi:10.1055/s-0042-1744448 · Cited by 1
Gamma Knife Radiosurgery Modulates micro-RNA Levels in Patients with Brain Metastasis
Khan, I., Akdur, K., Mahfooz, S., Elbasan, E. B., Sakarcan, A., Karaçam, B., Sinclair, G., Selek, Ş., Akbaş, F., & Hatiboğlu, M. A. (2023) · Current Radiopharmaceuticals · doi:10.2174/1874471016666230202164557 · Cited by 1
Reséndiz-Castillo, L. J., Minjarez-Vega, B., Reza-Zaldívar, E. E., Hernández-Sapiéns, M. A., Gutiérrez-Mercado, Y. K., & Canales-Aguirre, A. A. (2020) · Neurología · doi:10.1016/j.nrl.2019.07.005 · Cited by 1
MicroRNA and Gap Junctions in Glioblastoma Cells: Implications for Cellular Therapy
Munoz, J. L., Rodriguez‐Cruz, V., & Rameshwar, P. (2015) · Springer eBooks · doi:10.1007/978-94-017-7380-5_3
Peking University - Juntendo University Joint Symposium on Brain and Skin Diseases
Teng, Z., Liu, B., Li, Y., & Han, H. (2016) · Juntendō Igaku/Juntendo igaku · doi:10.14789/jmj.62.302
Peking University - Juntendo University Joint Symposium on Brain and Skin Diseases
Sun, J., Wang, Z., Li, L., & Liu, B. (2016) · Juntendō Igaku/Juntendo igaku · doi:10.14789/jmj.62.311
The role of miR-125b-5p- AKT serine/threonine kinase 1 axis in osteosarcoma
Bozgeyik, İ., & Karadağ, A. (2020) · Gene Reports · doi:10.1016/j.genrep.2020.100935
miR-628-3p exerts a carcinogenic effect on hepatocellular carcinoma
Liu, L., Cheng, Z., Liu, D., Pan, M., Luo, M., Chen, Y., & Xia, J. (2025) · Biochemistry and Biophysics Reports · doi:10.1016/j.bbrep.2025.102186
MacPhee, L., ROUHI, A. M., Vu, L., & Kuchenbauer, F. (2025) · Blood Advances · doi:10.1182/bloodadvances.2024015611
Micro-RNA prediction tools and target analysis
Tiwari, A., & Sharma, R. (2025) · Elsevier eBooks · doi:10.1016/b978-0-443-21980-1.00011-5
Gvaldin, D. Y., Pushkin, A. A., Тимошкина, Н. Н., Rostorguev, E. E., Nalgiev, A. M., & Kit, O. I. (2020) · Figshare · doi:10.6084/m9.figshare.13358066
Gvaldin, D. Y., Pushkin, A. A., Тимошкина, Н. Н., Rostorguev, E. E., Nalgiev, A. M., & Kit, O. I. (2020) · Figshare · doi:10.6084/m9.figshare.13357991
Gvaldin, D. Y., Pushkin, A. A., Тимошкина, Н. Н., Rostorguev, E. E., Nalgiev, A. M., & Kit, O. I. (2020) · Figshare · doi:10.6084/m9.figshare.13357982
Gvaldin, D. Y., Pushkin, A. A., Тимошкина, Н. Н., Rostorguev, E. E., Nalgiev, A. M., & Kit, O. I. (2020) · Figshare · doi:10.6084/m9.figshare.13358003
Gvaldin, D. Y., Pushkin, A. A., Тимошкина, Н. Н., Rostorguev, E. E., Nalgiev, A. M., & Kit, O. I. (2020) · Figshare · doi:10.6084/m9.figshare.13358006
Gvaldin, D. Y., Pushkin, A. A., Тимошкина, Н. Н., Rostorguev, E. E., Nalgiev, A. M., & Kit, O. I. (2020) · Figshare · doi:10.6084/m9.figshare.13358069
Gvaldin, D. Y., Pushkin, A. A., Тимошкина, Н. Н., Rostorguev, E. E., Nalgiev, A. M., & Kit, O. I. (2020) · Figshare · doi:10.6084/m9.figshare.13358060
Gvaldin, D. Y., Pushkin, A. A., Тимошкина, Н. Н., Rostorguev, E. E., Nalgiev, A. M., & Kit, O. I. (2020) · Figshare · doi:10.6084/m9.figshare.13357979
Gvaldin, D. Y., Pushkin, A. A., Тимошкина, Н. Н., Rostorguev, E. E., Nalgiev, A. M., & Kit, O. I. (2020) · Figshare · doi:10.6084/m9.figshare.13358072
Gvaldin, D. Y., Pushkin, A. A., Тимошкина, Н. Н., Rostorguev, E. E., Nalgiev, A. M., & Kit, O. I. (2020) · Figshare · doi:10.6084/m9.figshare.13357994
Metadata
- Authors
- Wu, N., Lin, X., Zhao, X., Zheng, L., Xiao, L., Liu, J., Ge, L., & Cao, S.
- Affiliations
- Chinese Academy of Sciences (CN)
- Capital Medical University (CN)
- Qingdao University (CN)
- Yellow Sea Fisheries Research Institute (CN)
- Qingdao Agricultural University (CN)
- Roswell Park Comprehensive Cancer Center (US)
- Corresponding author
- Lin, X
- Cao, S
- Venue
- British Journal of Cancer
- Published
- 2013-10-29
- Volume
- 109
- Issue
- 11
- Pages
- 2853-2863
- ISSN
- 0007-0920 (ISSN-L)
- 1532-1827
- PMC
- PMC3844918
- OpenAlex
- W2008006957
- Cited by
- 109
- References
- 39
- Citations by year
- 2025: 8 · 2024: 2 · 2023: 9 · 2022: 6 · 2021: 7 · 2020: 30 · 2019: 5 · 2018: 8 · 2017: 4 · 2016: 12 · 2015: 13 · 2014: 5
- FWCI
- 3.52
- Type
- journal article
- Language
- en
- Open access
- hybrid
- doi.org
- Licence
- cc-by-nc-sa
- www.springer.com/tdm (unspecified)
- Locations
- British Journal of Cancer (publishedVersion, cc-by-nc-sa)
- Europe PMC (PubMed Central) (publishedVersion, cc-by-nc-sa)
- PubMed Central (publishedVersion, cc-by-nc-sa)
- PubMed (publishedVersion)
- Funders
- National Natural Science Foundation of China (81273550, 81072065, 41306157)
- Topics
- Life Sciences › Biochemistry, Genetics and Molecular Biology › Cancer Research › MicroRNA in disease regulation
- Health Sciences › Medicine › Oncology › Glioma Diagnosis and Treatment
- Life Sciences › Biochemistry, Genetics and Molecular Biology › Cancer Research › Cancer-related molecular mechanisms research
- Keywords
- miR-125b, glioblastoma, oncogenic microRNA, apoptosis, p53, p38 MAPK, mitochondrial apoptosis, cell proliferation, tumor grade, TP53 mutation, microRNA target regulation
- MeSH terms
- Adolescent, Adult, Aged, Animals, Brain Neoplasms, Cells, Cultured, Child, Female, Glioblastoma, Humans, Male, Middle Aged, Oncogenes, Signal Transduction, Tumor Suppressor Protein p53, Apoptosis, MicroRNAs, p38 Mitogen-Activated Protein Kinases, Rats, Young Adult, HEK293 Cells
About these checks
Registry, retraction, Cites and statistics results are computed, not judged, with one exception: a printed reference that no index lists is read once by a model before it counts as a citation error. Claims are extracted by a model and kept only when their quote appears verbatim in the text; each cited source is then checked, with a model’s help, for whether it says what the claim relies on. Those verdicts can be wrong — read the claim’s quote and the cited source before relying on one.
Statistics and arithmetic are recomputed, not judged.
Confidence bands are shown only for fields calibrated on our annotated test set. None is calibrated yet, so no band is shown.
What counts as a claim ›How we measure confidence ›How we check this ›
Are you an author, or do you see a problem with this page? Request a review
