Cited by 57

The DOI matches its Crossref record; 4 of the 4 references it cites were found in a registry or an index.

SIRT1 activation enhances HDAC inhibition-mediated upregulation of GADD45G by repressing the binding of NF-κB/STAT3 complex to its promoter in malignant lymphoid cells

Scuto, A, Kirschbaum, M, Buettner, R, Kujawski, M, Cermak, J M, Atadja, P, Jove, R·2013·Cell Death & Disease

Overview

The claims and statistics of this paper haven’t been checked yet.

Run the check — free, no account needed. It reads the open-access text and checks the sources it cites.

A few free checks a day · papers already verified open instantly · results are public

Integrity signals

Registry

Crossref · 10.1038/cddis.2013.159

Cites

4 of 4 references verified0 citation errors · 0 not checkable

Statistics

Figures

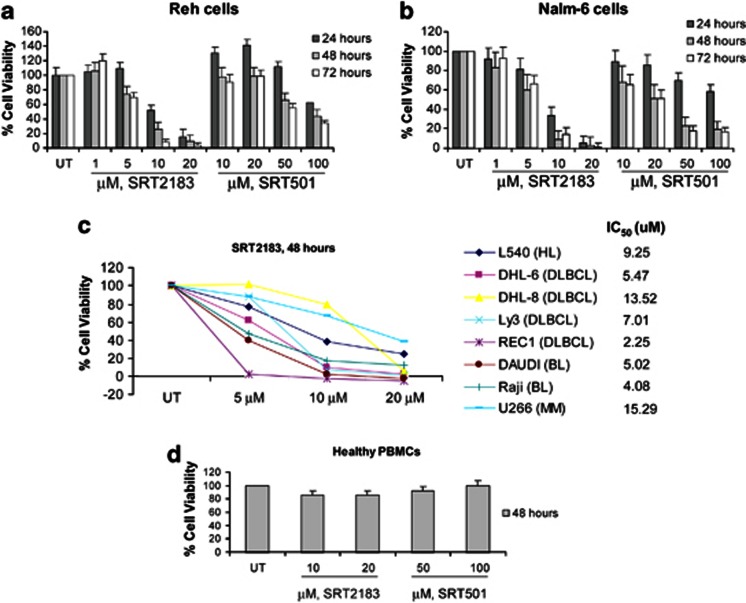
Figure 1 SIRT1 activators inhibit viability of human malignant lymphoid B-cell lines. (a) Reh cells and (b) Nalm-6 cells were treated with the indicated concentrations of SRT2183 or SRT501 for 24, 48, or 72 h. Following this, the percentage of cell viability was determined by MTS assay. Values represented as graphs are the mean of three independent experiments with S.D. (c) Cells were treated with the indicated concentrations of SRT2183 for 48 h. Following this, the percentage of cell viability was determined by MTS assay. (d) Peripheral blood mononuclear cells from a healthy donor were treated in culture with the indicated concentrations of SRT2183 or SRT501 for 48 h. The percentage of viable cells was determined by DIMSCAN analysis. Values represent the percentages of cell viability normalized to that of the untreated cells and are the mean of three separate treatments
Figure 1 SIRT1 activators inhibit viability of human malignant lymphoid B-cell lines. (a) Reh cells and (b) Nalm-6 cells were treated with the indicated concentrations of SRT2183 or SRT501 for 24, 48, or 72 h. Following this, the percentage of cell viability was determined by MTS assay. Values represented as graphs are the mean of three independent experiments with S.D. (c) Cells were treated with the indicated concentrations of SRT2183 for 48 h. Following this, the percentage of cell viability was determined by MTS assay. (d) Peripheral blood mononuclear cells from a healthy donor were treated in culture with the indicated concentrations of SRT2183 or SRT501 for 48 h. The percentage of viable cells was determined by DIMSCAN analysis. Values represent the percentages of cell viability normalized to that of the untreated cells and are the mean of three separate treatmentsCC BY-NC-ND · PubMed Central
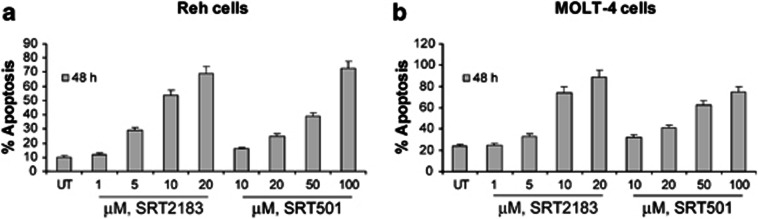
Figure 2 SIRT1 activators induce apoptosis of human Ph− ALL cell lines. (a) Reh cells and (b) MOLT-4 cells were treated with the indicated concentrations of SRT2183 or SRT501 for 48 h. Following this, the percentage of apoptotic cells was determined by flow cytometry using Annexin V/propidium iodide staining. Values represented as bar graphs are the mean of three independent experiments with S.D.
Figure 2 SIRT1 activators induce apoptosis of human Ph− ALL cell lines. (a) Reh cells and (b) MOLT-4 cells were treated with the indicated concentrations of SRT2183 or SRT501 for 48 h. Following this, the percentage of apoptotic cells was determined by flow cytometry using Annexin V/propidium iodide staining. Values represented as bar graphs are the mean of three independent experiments with S.D.CC BY-NC-ND · PubMed Central
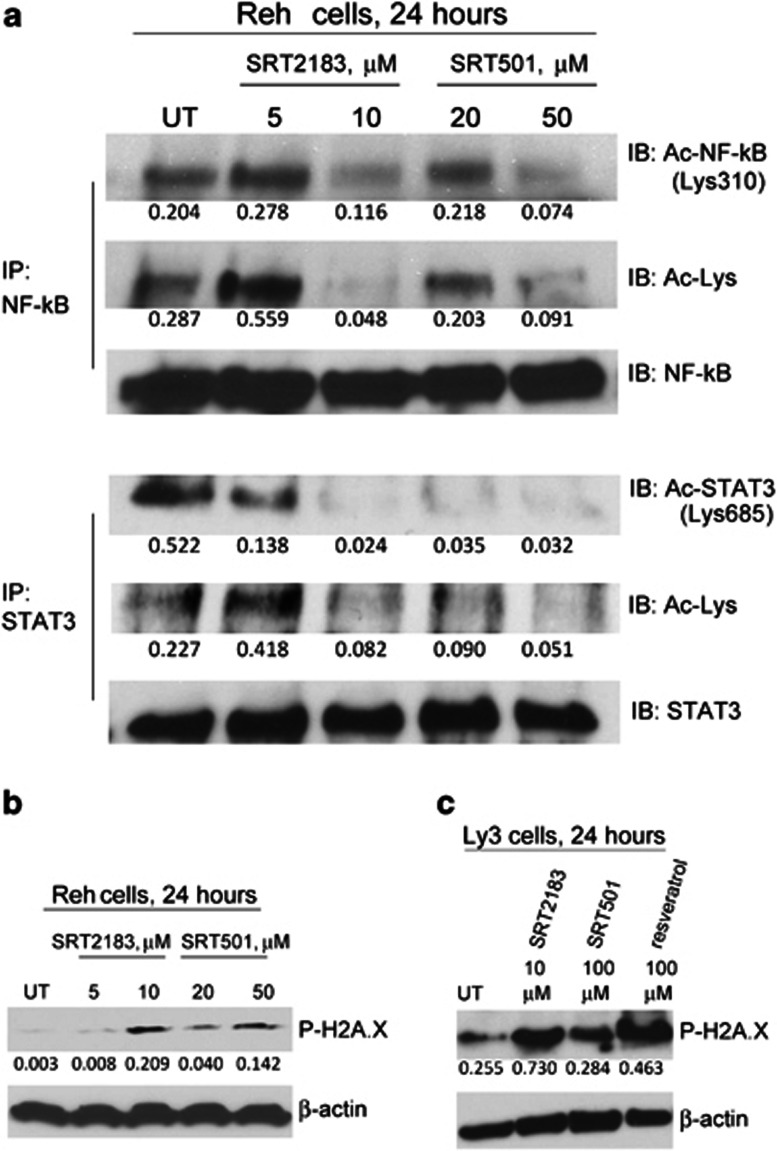
Figure 3 SIRT1 activators lead to deacetylation of both STAT3 and NF-κB p65 and induce phosphorylation of H2A.X. Cells were treated with the indicated concentrations of SRT2183 or SRT501 for 24 h. Following this, (a) immunoprecipitation (IP) and subsequent immunoblotting (IB) were performed on the lysates from Reh cells to analyze acetyl-STAT3 and acetyl-NF-κB levels. The levels of total STAT3 and total NF-κB served as loading controls. Results are representative of three independent experiments. Western blot analysis of phospho-H2A.X protein was performed on the lysates from (b) Reh or (c) Ly3 cells 24 h post treatment. The levels of β-actin protein served as loading controls. Results are representative of three independent experiments
Figure 3 SIRT1 activators lead to deacetylation of both STAT3 and NF-κB p65 and induce phosphorylation of H2A.X. Cells were treated with the indicated concentrations of SRT2183 or SRT501 for 24 h. Following this, (a) immunoprecipitation (IP) and subsequent immunoblotting (IB) were performed on the lysates from Reh cells to analyze acetyl-STAT3 and acetyl-NF-κB levels. The levels of total STAT3 and total NF-κB served as loading controls. Results are representative of three independent experiments. Western blot analysis of phospho-H2A.X protein was performed on the lysates from (b) Reh or (c) Ly3 cells 24 h post treatment. The levels of β-actin protein served as loading controls. Results are representative of three independent experimentsCC BY-NC-ND · PubMed Central
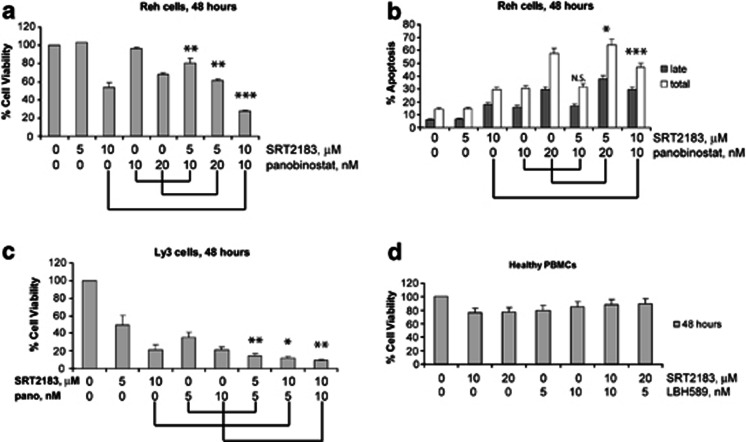
Figure 4 Combination of SRT2183 with panobinostat induces more apoptosis than either compound alone in Reh cells. (a) Reh cells were treated for 48 h with the indicated concentrations of SRT2183, panobinostat, or a combination of these drugs. Following this, the percentage of cell viability was determined by MTS assay. Values represented as graphs are the mean of three independent experiments with S.D. (b) Reh cells were treated for 48 h with the indicated concentrations of SRT2183, panobinostat, or a combination of these drugs. Following this, the percentage of late apoptotic cells or total (early plus late) apoptosis was determined by flow cytometry using Annexin V/propidium iodide staining. Values represented as bar graphs are the mean of three independent experiments with the S.D. (c) Ly3 cells were treated for 48 h with the indicated concentrations of SRT2183, panobinostat, or a combination of these drugs. Following this, the percentage of cell viability was determined by MTS assay. Values represented as graphs are the mean of three independent experiments with S.D. (d) Peripheral blood mononuclear cells from a healthy donor were treated in culture for 48 h with the indicated concentrations of SRT2183, panobinostat, or a combination of these drugs. The percentage of viable cells was determined by DIMSCAN analysis. Values represent the percentages of cell viability normalized to that of the untreated cells and are the mean of three separate treatments. Statistical significance is relative to the single agent treatment inducing higher effect. NS, not significant, *P<0.05, **P<0.01, ***P<0.001
Figure 4 Combination of SRT2183 with panobinostat induces more apoptosis than either compound alone in Reh cells. (a) Reh cells were treated for 48 h with the indicated concentrations of SRT2183, panobinostat, or a combination of these drugs. Following this, the percentage of cell viability was determined by MTS assay. Values represented as graphs are the mean of three independent experiments with S.D. (b) Reh cells were treated for 48 h with the indicated concentrations of SRT2183, panobinostat, or a combination of these drugs. Following this, the percentage of late apoptotic cells or total (early plus late) apoptosis was determined by flow cytometry using Annexin V/propidium iodide staining. Values represented as bar graphs are the mean of three independent experiments with the S.D. (c) Ly3 cells were treated for 48 h with the indicated concentrations of SRT2183, panobinostat, or a combination of these drugs. Following this, the percentage of cell viability was determined by MTS assay. Values represented as graphs are the mean of three independent experiments with S.D. (d) Peripheral blood mononuclear cells from a healthy donor were treated in culture for 48 h with the indicated concentrations of SRT2183, panobinostat, or a combination of these drugs. The percentage of viable cells was determined by DIMSCAN analysis. Values represent the percentages of cell viability normalized to that of the untreated cells and are the mean of three separate treatments. Statistical significance is relative to the single agent treatment inducing higher effect. NS, not significant, *P<0.05, **P<0.01, ***P<0.001CC BY-NC-ND · PubMed Central
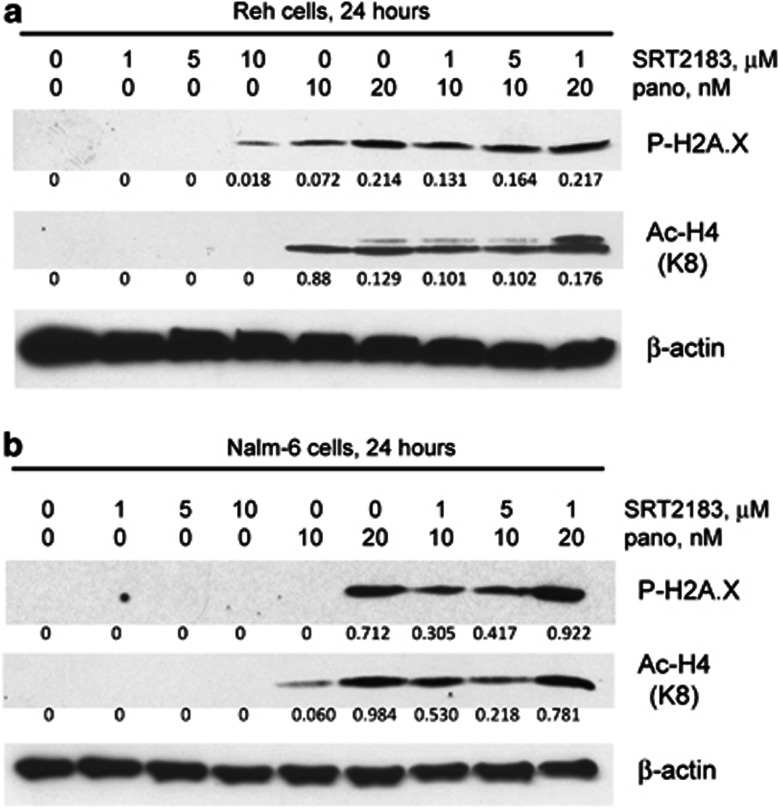
Figure 5 Combination of SRT2183 with panobinostat induces greater phosphorylation of H2A.X and acetylation of H4 in ALL cell lines. (a) Reh cells and (b) NALM-6 cells were treated for 24 h with the indicated concentrations of SRT2183, panobinostat, or a combination of these drugs. Following this, western blot analysis of phospho-H2A.X and acetyl-H4 proteins was performed on the lysates from those cells. The levels of β-actin protein served as loading controls. Results are representative of three independent experiments
Figure 5 Combination of SRT2183 with panobinostat induces greater phosphorylation of H2A.X and acetylation of H4 in ALL cell lines. (a) Reh cells and (b) NALM-6 cells were treated for 24 h with the indicated concentrations of SRT2183, panobinostat, or a combination of these drugs. Following this, western blot analysis of phospho-H2A.X and acetyl-H4 proteins was performed on the lysates from those cells. The levels of β-actin protein served as loading controls. Results are representative of three independent experimentsCC BY-NC-ND · PubMed Central
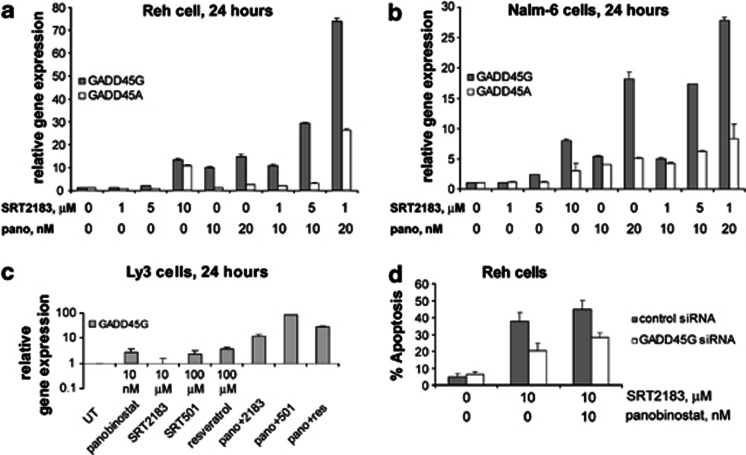
Figure 6 Combination of SRT2183 with panobinostat induces greater upregulation of GADD45G and GADD45A genes than either compound alone in pre-B ALL cell lines. (a) Reh cells, (b) NALM-6 cells and (c) Ly3 cells were treated for 24 h with the indicated concentrations of panobinostat and SIRT1 activators as single agents or in combination with panobinostat. Following this, TaqMan real-time PCR was performed. The mRNA levels were normalized to levels of β-actin mRNA. Values represented as bar graphs are the mean of three independent experiments with S.D. Data are expressed as 2^ddCt. (d) Reh cells were transfected with Cy3-labeled GADD45G siRNA or negative control siRNA and treated, 48 h later, with the indicated concentrations of SRT2183, panobinostat ,or a combination of these drugs. At 48 h after treatment, the percentage of apoptotic cells was determined in the gated Cy3-positive cell population, by flow cytometry using Annexin V/DAPI staining. Values represented as bar graphs are the mean of three independent experiments with S.D.
Figure 6 Combination of SRT2183 with panobinostat induces greater upregulation of GADD45G and GADD45A genes than either compound alone in pre-B ALL cell lines. (a) Reh cells, (b) NALM-6 cells and (c) Ly3 cells were treated for 24 h with the indicated concentrations of panobinostat and SIRT1 activators as single agents or in combination with panobinostat. Following this, TaqMan real-time PCR was performed. The mRNA levels were normalized to levels of β-actin mRNA. Values represented as bar graphs are the mean of three independent experiments with S.D. Data are expressed as 2^ddCt. (d) Reh cells were transfected with Cy3-labeled GADD45G siRNA or negative control siRNA and treated, 48 h later, with the indicated concentrations of SRT2183, panobinostat ,or a combination of these drugs. At 48 h after treatment, the percentage of apoptotic cells was determined in the gated Cy3-positive cell population, by flow cytometry using Annexin V/DAPI staining. Values represented as bar graphs are the mean of three independent experiments with S.D.CC BY-NC-ND · PubMed Central
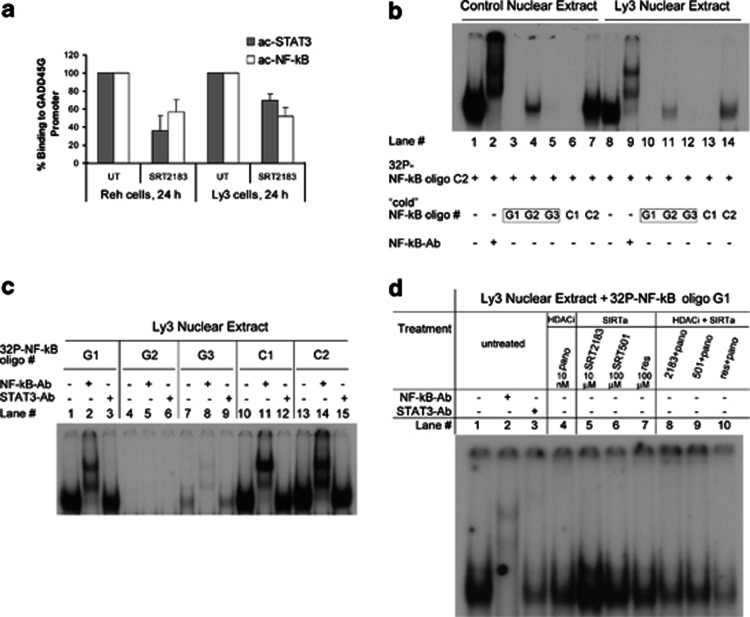
Figure 7 Effects of SIRT1 activators alone or in combination with panobinostat on the binding of NF-κB and STAT3 to the GADD45G promoter. (a) Following treatment with 10 μM SRT2183 for 24 h, ChIP assay was performed on Reh and Ly3 cells. DNAs purified from the sheared cross-linked chromatin immunoprecipitated with anti-acetyl-STAT3 or anti-acetyl-NF-κB antibodies were used as TaqMan real-time PCR templates to amplify the GADD45G promoter region from −567 to +6. Inputs were used to normalize. Values represented as bar graphs are the mean of three independent experiments with S.D. (b) Competition EMSA: Effect of unlabeled (‘cold') oligonucleotides G1, G2, and G3 on NF-κB DNA-binding activity. Lanes 1–7: Nuclear extract from lipopolysaccharide LPS-stimulated macrophages. Lanes 8–14: Nuclear extract from Ly3 cells. ‘Cold' oligonucleotides G1–G3 and C1 were added in 100-fold molar excess, C2 was added 1 : 1, as compared with control 32P-labeled NF-κB oligo C2. Lanes 2 and 9 contain NF-κB antibodies (supershift). (c) DNA-binding activity (EMSA assay) of NF-κB to 32P-labeled NF-κB consensus sequences G1–G3 (lanes 1–9). Lanes 10–15: Control NF-κB oligonucleotides. Lanes 1–15: Nuclear extract from Ly3 cells. NF-κB and STAT3 antibodies were used in supershifts (lanes 2, 5, 8, 11, 14 and lanes 3, 6, 9, 12, 15, respectively). (d) Effect of compound-treated Ly3 cells on NF-κB DNA-binding activity (EMSA assay). Ly3 cells were treated with HDACi, SIRTa or HDACi+SIRTa as indicated. Nuclear extract of untreated (lanes 1–3) and treated cells (lanes 4–10) was isolated 24 h post treatment and incubated with 32P-labeled NF-κB oligonucleotide G1 before EMSA analysis. NF-κB and STAT3 antibodies were used in supershift (lanes 2 and 3, respectively)
Figure 7 Effects of SIRT1 activators alone or in combination with panobinostat on the binding of NF-κB and STAT3 to the GADD45G promoter. (a) Following treatment with 10 μM SRT2183 for 24 h, ChIP assay was performed on Reh and Ly3 cells. DNAs purified from the sheared cross-linked chromatin immunoprecipitated with anti-acetyl-STAT3 or anti-acetyl-NF-κB antibodies were used as TaqMan real-time PCR templates to amplify the GADD45G promoter region from −567 to +6. Inputs were used to normalize. Values represented as bar graphs are the mean of three independent experiments with S.D. (b) Competition EMSA: Effect of unlabeled (‘cold') oligonucleotides G1, G2, and G3 on NF-κB DNA-binding activity. Lanes 1–7: Nuclear extract from lipopolysaccharide LPS-stimulated macrophages. Lanes 8–14: Nuclear extract from Ly3 cells. ‘Cold' oligonucleotides G1–G3 and C1 were added in 100-fold molar excess, C2 was added 1 : 1, as compared with control 32P-labeled NF-κB oligo C2. Lanes 2 and 9 contain NF-κB antibodies (supershift). (c) DNA-binding activity (EMSA assay) of NF-κB to 32P-labeled NF-κB consensus sequences G1–G3 (lanes 1–9). Lanes 10–15: Control NF-κB oligonucleotides. Lanes 1–15: Nuclear extract from Ly3 cells. NF-κB and STAT3 antibodies were used in supershifts (lanes 2, 5, 8, 11, 14 and lanes 3, 6, 9, 12, 15, respectively). (d) Effect of compound-treated Ly3 cells on NF-κB DNA-binding activity (EMSA assay). Ly3 cells were treated with HDACi, SIRTa or HDACi+SIRTa as indicated. Nuclear extract of untreated (lanes 1–3) and treated cells (lanes 4–10) was isolated 24 h post treatment and incubated with 32P-labeled NF-κB oligonucleotide G1 before EMSA analysis. NF-κB and STAT3 antibodies were used in supershift (lanes 2 and 3, respectively)CC BY-NC-ND · PubMed Central
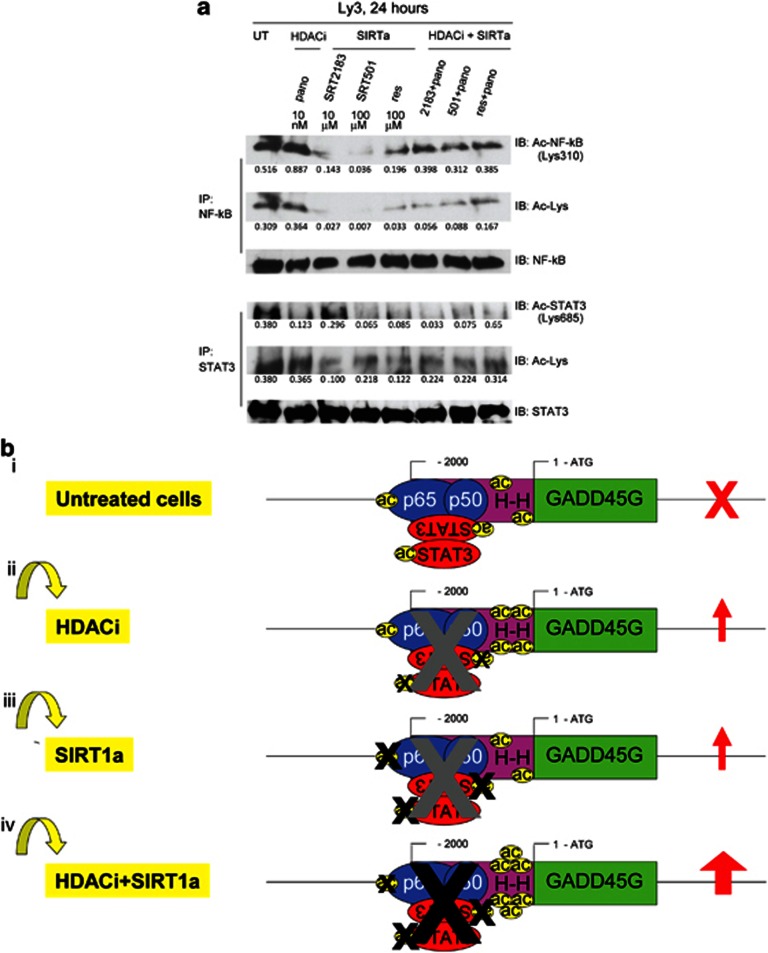
Figure 8 A model to explain the greater upregulation of GADD45G mediated by the combination of a SIRT1 activator with a class I, II, and IV HDAC inhibitor. (a) Ly3 cells were treated with the indicated concentrations of panobinostat, and SIRT1 activators as single agents or in combination with panobinostat for 24 h. Following this, immunoprecipitation (IP) and subsequent immunoblotting (IB) were performed on the cell lysates to analyze acetyl-STAT3 and acetyl-NF-κB levels. The levels of total STAT3 and total NF-κB served as loading controls. (b) Predicted acetylation status of histones and STAT3/NF-κB complexes at the GADD45G promoter in untreated cells (i) and in cells treated with an HDACi (ii), a SIRT1a (iii), and the combination of an HDACi with a SIRT1a (iv)
Figure 8 A model to explain the greater upregulation of GADD45G mediated by the combination of a SIRT1 activator with a class I, II, and IV HDAC inhibitor. (a) Ly3 cells were treated with the indicated concentrations of panobinostat, and SIRT1 activators as single agents or in combination with panobinostat for 24 h. Following this, immunoprecipitation (IP) and subsequent immunoblotting (IB) were performed on the cell lysates to analyze acetyl-STAT3 and acetyl-NF-κB levels. The levels of total STAT3 and total NF-κB served as loading controls. (b) Predicted acetylation status of histones and STAT3/NF-κB complexes at the GADD45G promoter in untreated cells (i) and in cells treated with an HDACi (ii), a SIRT1a (iii), and the combination of an HDACi with a SIRT1a (iv)CC BY-NC-ND · PubMed Central

Verification

Claims the paper makes

The claims and statistics of this paper haven’t been checked yet.

Run the check — free, no account needed. It reads the open-access text and checks the sources it cites.

A few free checks a day · papers already verified open instantly · results are public

Claims other papers make about this one

Each is checked against this paper’s own text: does it say what the citing paper says it does?

Self-check

Percentages, sums and reported differences re-computed from the paper’s own numbers.

The self-check needs the paper’s full text.

Citations

Cites

Research works printed but not linked: 46

  1. Stimson L, Wood V, Khan O, Fotheringham S, La Thangue NB . HDAC inhibitor-based therapies and haematological malignancy. Ann Oncol 2009; 20: 1293–1302. · DOI
  2. Piekarz RL, Frye R, Turner M, Wright JJ, Allen SL, Kirschbaum MH et al. Phase II multi-institutional trial of the histone deacetylase inhibitor romidepsin as monotherapy for patients with cutaneous T-cell lymphoma. J Clin Oncol 2009; 27: 5410–5417. · DOI
  3. Kirschbaum M, Frankel P, Popplewell L, Zain J, Delioukina M, Pullarkat V et al. Phase II study of vorinostat for treatment of relapsed or refractory indolent non-Hodgkin's lymphoma and mantle cell lymphoma. J Clin Oncol 2011; 29: 1198–1203. · DOI
  4. Frye RA . Characterization of five human cDNAs with homology to the yeast SIR2 gene: Sir2-like proteins (sirtuins) metabolize NAD and may have protein ADP-ribosyltransferase activity. Biochem Biophys Res Commun 1999; 260: 273–279. · DOI
  5. Finkel T, Deng CX, Mostoslavsky R . Recent progress in the biology and physiology of sirtuins. Nature 2009; 460: 587–591. · DOI
  6. Bosch-Presegue L, Vaquero A . The dual role of sirtuins in cancer. Genes Cancer 2011; 2: 648–662. · DOI
  7. Blum CA, Ellis JL, Loh C, Ng PY, Perni RB, Stein RL . SIRT1 modulation as a novel approach to the treatment of diseases of aging. J Med Chem 2011; 54: 417–432. · DOI
  8. Pruitt K, Zinn RL, Ohm JE, McGarvey KM, Kang SH, Watkins DN et al. Inhibition of SIRT1 reactivates silenced cancer genes without loss of promoter DNA hypermethylation. PLoS Genet 2006; 2: e40. · DOI · Paper page
  9. Audrito V, Vaisitti T, Rossi D, Gottardi D, D'Arena G, Laurenti L et al. Nicotinamide blocks proliferation and induces apoptosis of chronic lymphocytic leukemia cells through activation of the p53/miR-34a/SIRT1 tumor suppressor network. Cancer Res 2011; 71: 4473–4483. · DOI
  10. Singh NP, Singh UP, Hegde VL, Guan H, Hofseth L, Nagarkatti M et al. Resveratrol (trans-3,5,4'-trihydroxystilbene) suppresses EL4 tumor growth by induction of apoptosis involving reciprocal regulation of SIRT1 and NF-kappaB. Mol Nutr Food Res 2011; 55: 1207–1218. · DOI
  11. Bhardwaj A, Sethi G, Vadhan-Raj S, Bueso-Ramos C, Takada Y, Gaur U et al. Resveratrol inhibits proliferation, induces apoptosis, and overcomes chemoresistance through down-regulation of STAT3 and nuclear factor-kappaB-regulated antiapoptotic and cell survival gene products in human multiple myeloma cells. Blood 2007; 109: 2293–2302. · DOI · Paper page
  12. Sun C, Hu Y, Liu X, Wu T, Wang Y, He W et al. Resveratrol downregulates the constitutional activation of nuclear factor-kappaB in multiple myeloma cells, leading to suppression of proliferation and invasion, arrest of cell cycle, and induction of apoptosis. Cancer Genet Cytogenet 2006; 165: 9–19. · DOI
  13. Li T, Wang W, Chen H, Li T, Ye L . Evaluation of anti-leukemia effect of resveratrol by modulating STAT3 signaling. Int Immunopharmacol 2010; 10: 18–25. · DOI
  14. Estrov Z, Shishodia S, Faderl S, Harris D, Van Q, Kantarjian HM et al. Resveratrol blocks interleukin-1beta-induced activation of the nuclear transcription factor NF-kappaB, inhibits proliferation, causes S-phase arrest, and induces apoptosis of acute myeloid leukemia cells. Blood 2003; 102: 987–995. · DOI
  15. Asou H, Koshizuka K, Kyo T, Takata N, Kamada N, Koeffier HP . Resveratrol, a natural product derived from grapes, is a new inducer of differentiation in human myeloid leukemias. Int J Hematol 2002; 75: 528–533. · DOI
  16. Smith JJ, Kenney RD, Gagne DJ, Frushour BP, Ladd W, Galonek HL et al. Small molecule activators of SIRT1 replicate signaling pathways triggered by calorie restriction in vivo. BMC Syst Biol 2009; 3: 31. · DOI · Paper page
  17. Howitz KT, Bitterman KJ, Cohen HY, Lamming DW, Lavu S, Wood JG et al. Small molecule activators of sirtuins extend Saccharomyces cerevisiae lifespan. Nature 2003; 425: 191–196. · DOI · Paper page
  18. Dai H, Kustigian L, Carney D, Case A, Considine T, Hubbard BP et al. SIRT1 activation by small molecules: kinetic and biophysical evidence for direct interaction of enzyme and activator. J Biol Chem 2010; 285: 32695–32703. · DOI
  19. Hubbard BP, Gomes AP, Dai H, Li J, Case AW, Considine T et al. Evidence for a common mechanism of SIRT1 regulation by allosteric activators. Science 2013; 339: 1216–1219. · DOI · Paper page
  20. Nie Y, Erion DM, Yuan Z, Dietrich M, Shulman GI, Horvath TL et al. STAT3 inhibition of gluconeogenesis is downregulated by SirT1. Nat Cell Biol 2009; 11: 492–500. · DOI
  21. Sestito R, Madonna S, Scarponi C, Cianfarani F, Failla CM, Cavani A et al. STAT3-dependent effects of IL-22 in human keratinocytes are counterregulated by sirtuin 1 through a direct inhibition of STAT3 acetylation. FASEB J 2011; 25: 916–927. · DOI
  22. Bernier M, Paul RK, Martin-Montalvo A, Scheibye-Knudsen M, Song S, He HJ et al. Negative regulation of STAT3 protein-mediated cellular respiration by SIRT1 protein. J Biol Chem 2011; 286: 19270–19279. · DOI
  23. Yuan ZL, Guan YJ, Chatterjee D, Chin YE . Stat3 dimerization regulated by reversible acetylation of a single lysine residue. Science 2005; 307: 269–273. · DOI · Paper page
  24. Chen LF, Mu Y, Greene WC . Acetylation of RelA at discrete sites regulates distinct nuclear functions of NF-kappaB. EMBO J 2002; 21: 6539–6548. · DOI · Paper page
  25. Lam LT, Wright G, Davis RE, Lenz G, Farinha P, Dang L et al. Cooperative signaling through the signal transducer and activator of transcription 3 and nuclear factor-{kappa}B pathways in subtypes of diffuse large B-cell lymphoma. Blood 2008; 111: 3701–3713. · DOI
  26. Kiuchi N, Nakajima K, Ichiba M, Fukada T, Narimatsu M, Mizuno K et al. STAT3 is required for the gp130-mediated full activation of the c-myc gene. J Exp Med 1999; 189: 63–73. · DOI
  27. Han SS, Yun H, Son DJ, Tompkins VS, Peng L, Chung ST et al. NF-kappaB/STAT3/PI3K signaling crosstalk in iMyc E mu B lymphoma. Mol Cancer 2010; 9: 97. · DOI
  28. Thiriet C, Hayes JJ . Chromatin in need of a fix: phosphorylation of H2AX connects chromatin to DNA repair. Mol Cell 2005; 18: 617–622. · DOI
  29. Marhin WW, Chen S, Facchini LM, Fornace AJ Jr., Penn LZ . Myc represses the growth arrest gene gadd45. Oncogene 1997; 14: 2825–2Z34. · DOI
  30. Bush A, Mateyak M, Dugan K, Obaya A, Adachi S, Sedivy J et al. c-myc null cells misregulate cad and gadd45 but not other proposed c-Myc targets. Genes Dev 1998; 12: 3797–3802. · DOI
  31. Zerbini LF, Wang Y, Czibere A, Correa RG, Cho JY, Ijiri K et al. NF-kappa B-mediated repression of growth arrest- and DNA-damage-inducible proteins 45alpha and gamma is essential for cancer cell survival. Proc Natl Acad Sci USA 2004; 101: 13618–13623. · DOI · Paper page
  32. Amundson SA, Zhan Q, Penn LZ, Fornace AJ Jr . Myc suppresses induction of the growth arrest genes gadd34, gadd45, and gadd153 by DNA-damaging agents. Oncogene 1998; 17: 2149–2154. · DOI
  33. Tao H, Umek RM . Reciprocal regulation of gadd45 by C/EBP alpha and c-Myc. DNA Cell Biol 1999; 18: 75–84. · DOI
  34. Lee H, Herrmann A, Deng JH, Kujawski M, Niu G, Li Z et al. Persistently activated Stat3 maintains constitutive NF-kappaB activity in tumors. Cancer Cell 2009; 15: 283–293. · DOI · Paper page
  35. Kobayashi Y, Furukawa-Hibi Y, Chen C, Horio Y, Isobe K, Ikeda K et al. SIRT1 is critical regulator of FOXO-mediated transcription in response to oxidative stress. Int J Mol Med 2005; 16: 237–243.
  36. Hughes KJ, Meares GP, Hansen PA, Corbett JA . FoxO1 and SIRT1 regulate beta-cell responses to nitric oxide. J Biol Chem 2011; 286: 8338–8348. · DOI
  37. Zheng JP, Ju D, Jiang H, Shen J, Yang M, Li L . Resveratrol induces p53 and suppresses myocardin-mediated vascular smooth muscle cell differentiation. Toxicol Lett 2010; 199: 115–122. · DOI
  38. Li G, He S, Chang L, Lu H, Zhang H, Zhang H et al. GADD45alpha and annexin A1 are involved in the apoptosis of HL-60 induced by resveratrol. Phytomedicine 2011; 18: 704–709. · DOI
  39. Lu J, Ho CH, Ghai G, Chen KY . Resveratrol analog, 3,4,5,4′-tetrahydroxystilbene, differentially induces pro-apoptotic p53/Bax gene expression and inhibits the growth of transformed cells but not their normal counterparts. Carcinogenesis 2001; 22: 321–328. · DOI
  40. Zerbini LF, Libermann TA . Life and death in cancer. GADD45 alpha and gamma are critical regulators of NF-kappaB mediated escape from programmed cell death. Cell Cycle 2005; 4: 18–20. · DOI · Paper page
  41. Nakayama K, Hara T, Hibi M, Hirano T, Miyajima A . A novel oncostatin M-inducible gene OIG37 forms a gene family with MyD118 and GADD45 and negatively regulates cell growth. J Biol Chem 1999; 274: 24766–24772. · DOI
  42. Lee H, Zhang P, Herrmann A, Yang C, Xin H, Wang Z et al. Acetylated STAT3 is crucial for methylation of tumor-suppressor gene promoters and inhibition by resveratrol results in demethylation. Proc Natl Acad Sci USA 2012; 109: 7765–7769. · DOI
  43. Liu Y, Mayo MW, Nagji AS, Smith PW, Ramsey CS, Li D et al. Phosphorylation of RelA/p65 promotes DNMT-1 recruitment to chromatin and represses transcription of the tumor metastasis suppressor gene BRMS1. Oncogene 2012; 31: 1143–1154. · DOI
  44. Ying J, Srivastava G, Hsieh WS, Gao Z, Murray P, Liao SK et al. The stress-responsive gene GADD45G is a functional tumor suppressor, with its response to environmental stresses frequently disrupted epigenetically in multiple tumors. Clin Cancer Res 2005; 11: 6442–6449. · DOI
  45. Garcia R, Bowman TL, Niu G, Yu H, Minton S, Muro-Cacho CA et al. Constitutive activation of Stat3 by the Src and JAK tyrosine kinases participates in growth regulation of human breast carcinoma cells. Oncogene 2001; 20: 2499–2513. · DOI
  46. Chou TC . Theoretical basis, experimental design, and computerized simulation of synergism and antagonism in drug combination studies. Pharmacol Rev 2006; 58: 621–681. · DOI · Paper page

Cited by

See all 57

Metadata

Authors
Scuto, A., Kirschbaum, M., Buettner, R., Kujawski, M., Cermak, J. M., Atadja, P., & Jove, R.
Venue
Cell Death & Disease
Published
2013-05-16
Volume
4
Issue
5
Pages
e635-e635
ISSN
2041-4889
Cited by
57
References
4
Language
en

About these checks

Registry, retraction, Cites and statistics results are computed, not judged, with one exception: a printed reference that no index lists is read once by a model before it counts as a citation error. Claims are extracted by a model and kept only when their quote appears verbatim in the text; each cited source is then checked, with a model’s help, for whether it says what the claim relies on. Those verdicts can be wrong — read the claim’s quote and the cited source before relying on one.

Statistics and arithmetic are recomputed, not judged.

Confidence bands are shown only for fields calibrated on our annotated test set. None is calibrated yet, so no band is shown.

What counts as a claim ›How we measure confidence ›How we check this ›

Are you an author, or do you see a problem with this page? Request a review