Student or educator? Sign up with your school email and get 6 months of Pro free.
Cited by 66

The DOI matches its Crossref record; 20 of the 20 references it cites were found in a registry or an index.

Human recombinant glutamate oxaloacetate transaminase 1 (GOT1) supplemented with oxaloacetate induces a protective effect after cerebral ischemia

Pérez-Mato, M, Ramos-Cabrer, P, Sobrino, T, Blanco, M, Ruban, A, Mirelman, D, Menendez, P, Castillo, J, Campos, F·2014·Cell Death & Disease

Abstract

Blood glutamate scavenging is a novel and attractive protecting strategy to reduce the excitotoxic effect of extracellular glutamate released during ischemic brain injury. Glutamate oxaloacetate transaminase 1 (GOT1) activation by means of oxaloacetate administration has been used to reduce the glutamate concentration in the blood. However, the protective effect of the administration of the recombinant GOT1 (rGOT1) enzyme has not been yet addressed in cerebral ischemia. The aim of this study was to analyze the protective effect of an effective dose of oxaloacetate and the human rGOT1 alone and in combination with a non-effective dose of oxaloacetate in an animal model of ischemic stroke. Sixty rats were subjected to a transient middle cerebral artery occlusion (MCAO). Infarct volumes were assessed by magnetic resonance imaging (MRI) before treatment administration, and 24 h and 7 days after MCAO. Brain glutamate levels were determined by in vivo MR spectroscopy (MRS) during artery occlusion (80 min) and reperfusion (180 min). GOT activity and serum glutamate concentration were analyzed during the occlusion and reperfusion period. Somatosensory test was performed at baseline and 7 days after MCAO. The three treatments tested induced a reduction in serum and brain glutamate levels, resulting in a reduction in infarct volume and sensorimotor deficit. Protective effect of rGOT1 supplemented with oxaloacetate at 7 days persists even when treatment was delayed until at least 2 h after onset of ischemia. In conclusion, our findings indicate that the combination of human rGOT1 with low doses of oxaloacetate seems to be a successful approach for stroke treatment.

Overview

The claims and statistics of this paper haven’t been checked yet.

Run the check — free, no account needed. It reads the open-access text and checks the sources it cites.

A few free checks a day · papers already verified open instantly · results are public

Integrity signals

Registry

Crossref · 10.1038/cddis.2013.507

Cites

20 of 20 references verified0 citation errors · 0 not checkable

Statistics

Figures

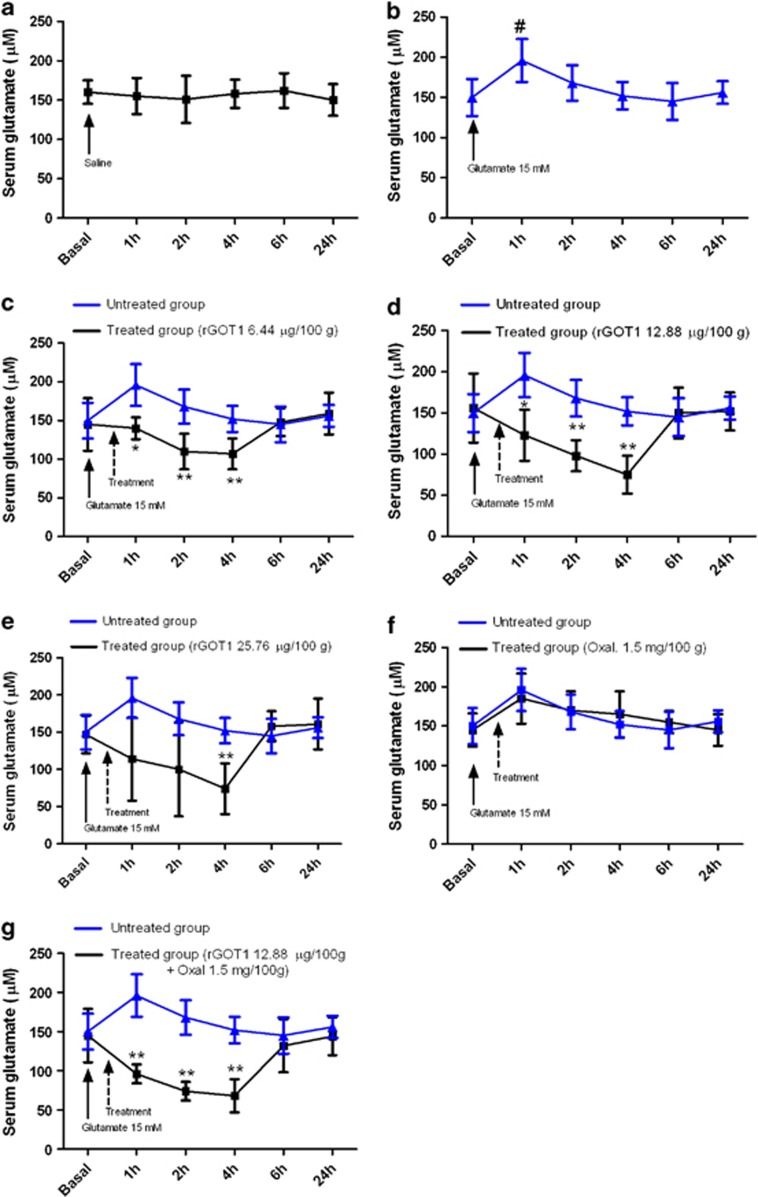
Figure 1 Effect of rGOT and oxaloacetate (Oxal) on serum glutamate levels in healthy rats. Glutamate 15 mM was injected i.v. 30 min prior to treatments. (a) Rats treated with saline (control group). (b) Rats treated with glutamate 15 mM. (c) Comparison between rats treated with glutamate 15 mM (blue line) and rats treated with glutamate 15 mM and rGOT1 6.44 μg per 100 g (black line). (d) Comparison between rats treated with glutamate 15 mM (blue line) and rats treated with glutamate 15 mM and rGOT1 12.88 μg per 100 g (black line). (e) Comparison between rats treated with glutamate (15 mM) (blue line) and rats treated with glutamate (15 mM) and with rGOT1 (25.76 μg per 100 g). (f) Comparison between rats treated with glutamate 15 mM (blue line) and rats treated with glutamate (15 mM) and oxaloacetate (Oxal) (1.5 mg per 100 g). (g) Comparison between rats treated with glutamate (15 mM) (blue line) and rats treated with glutamate (15 mM) and rGOT1 (12.88 μg per 100 g) plus oxaloacetate (Oxal) (1.5 mg per 100 g). Solid arrows denote the injection of glutamate. Dashed arrows indicate the injection of treatments. Serum samples were taken in basal conditions and 1, 2, 4, 6 and 24 h after glutamate injection. Data are shown as mean±S.E.M. #P<0.05 compared to the basal levels; *P<0.05, **P<0.01 compared with animals treated with glutamate 15 mM
Figure 1 Effect of rGOT and oxaloacetate (Oxal) on serum glutamate levels in healthy rats. Glutamate 15 mM was injected i.v. 30 min prior to treatments. (a) Rats treated with saline (control group). (b) Rats treated with glutamate 15 mM. (c) Comparison between rats treated with glutamate 15 mM (blue line) and rats treated with glutamate 15 mM and rGOT1 6.44 μg per 100 g (black line). (d) Comparison between rats treated with glutamate 15 mM (blue line) and rats treated with glutamate 15 mM and rGOT1 12.88 μg per 100 g (black line). (e) Comparison between rats treated with glutamate (15 mM) (blue line) and rats treated with glutamate (15 mM) and with rGOT1 (25.76 μg per 100 g). (f) Comparison between rats treated with glutamate 15 mM (blue line) and rats treated with glutamate (15 mM) and oxaloacetate (Oxal) (1.5 mg per 100 g). (g) Comparison between rats treated with glutamate (15 mM) (blue line) and rats treated with glutamate (15 mM) and rGOT1 (12.88 μg per 100 g) plus oxaloacetate (Oxal) (1.5 mg per 100 g). Solid arrows denote the injection of glutamate. Dashed arrows indicate the injection of treatments. Serum samples were taken in basal conditions and 1, 2, 4, 6 and 24 h after glutamate injection. Data are shown as mean±S.E.M. #P<0.05 compared to the basal levels; *P<0.05, **P<0.01 compared with animals treated with glutamate 15 mMCC BY-NC-ND · PubMed Central
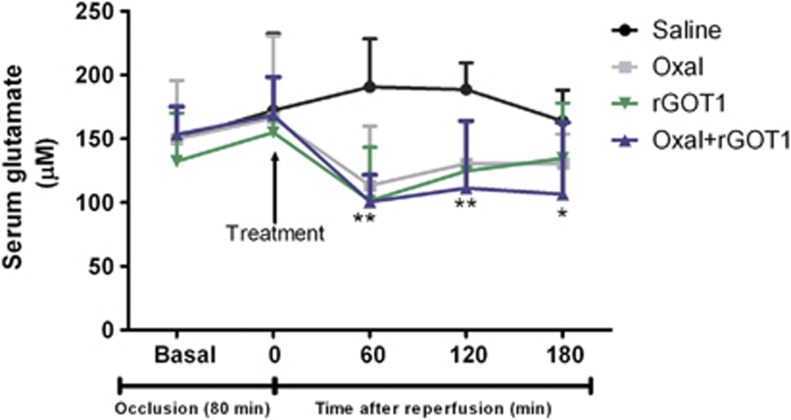
Figure 2 Time course of serum glutamate concentration (μM) in MCAO rats. MCAO rats were treated with saline (control group) (n=6), oxaloacetate (Oxal) 3.5 mg per 100 g (n=6), rGOT1 12.88 μg per 100 g (n=6) and rGOT1 12.88 μg per 100 g plus oxaloacetate 1.5 mg per 100 g (n=6). Solid arrow indicates the time of treatment injection, administered at the moment of reperfusion (80 min after occlusion). Serum glutamate concentration was measured under basal conditions (before surgery), at the moment of the reperfusion (before treatment administration), and 1, 2 and 3 h after reperfusion. Data are shown as mean±S.E.M. *P<0.05, **P<0.01 compared with control group
Figure 2 Time course of serum glutamate concentration (μM) in MCAO rats. MCAO rats were treated with saline (control group) (n=6), oxaloacetate (Oxal) 3.5 mg per 100 g (n=6), rGOT1 12.88 μg per 100 g (n=6) and rGOT1 12.88 μg per 100 g plus oxaloacetate 1.5 mg per 100 g (n=6). Solid arrow indicates the time of treatment injection, administered at the moment of reperfusion (80 min after occlusion). Serum glutamate concentration was measured under basal conditions (before surgery), at the moment of the reperfusion (before treatment administration), and 1, 2 and 3 h after reperfusion. Data are shown as mean±S.E.M. *P<0.05, **P<0.01 compared with control groupCC BY-NC-ND · PubMed Central
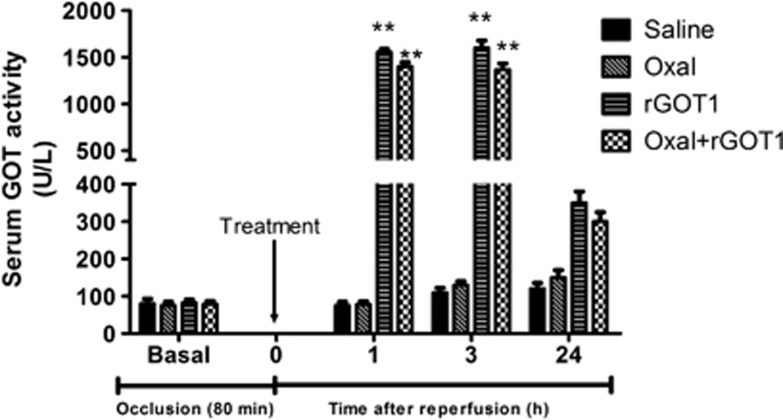
Figure 3 Time course of serum GOT activity in MCAO rats. MCAO rats were treated with saline (control group) (n=6), oxaloacetate (Oxal) 3.5 mg per 100 g (n=6), rGOT1 12.88 μg per 100 g (n=6) and rGOT1 12.88 μg per 100 g plus oxaloacetate 1.5 mg per 100 g (n=6). Treatments were administered at the moment of reperfusion (80 min after occlusion). GOT activity was measured under basal conditions (before surgery), and 1, 3 and 24 h after reperfusion. Data are shown as percentage compared with basal levels±S.E.M. **P<0.01 with respect to control group
Figure 3 Time course of serum GOT activity in MCAO rats. MCAO rats were treated with saline (control group) (n=6), oxaloacetate (Oxal) 3.5 mg per 100 g (n=6), rGOT1 12.88 μg per 100 g (n=6) and rGOT1 12.88 μg per 100 g plus oxaloacetate 1.5 mg per 100 g (n=6). Treatments were administered at the moment of reperfusion (80 min after occlusion). GOT activity was measured under basal conditions (before surgery), and 1, 3 and 24 h after reperfusion. Data are shown as percentage compared with basal levels±S.E.M. **P<0.01 with respect to control groupCC BY-NC-ND · PubMed Central
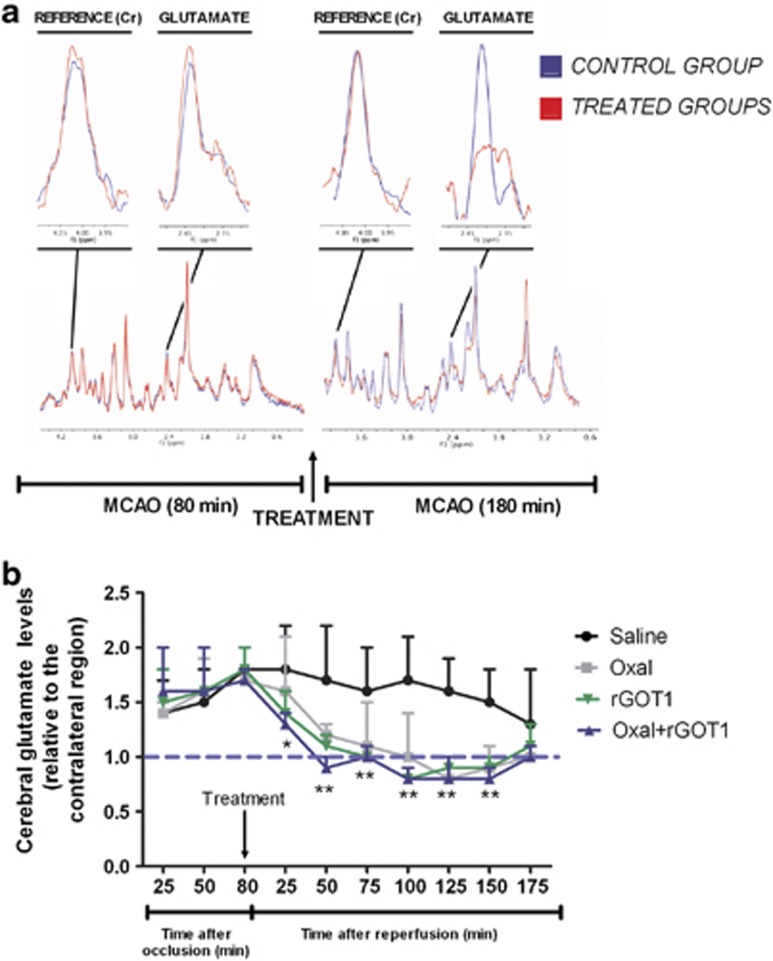
Figure 4 MRS analysis. (a) Quantitative analysis of glutamate signals were normalized to creatine (Cr) peaks for each single spectra. Brain glutamate levels were analyzed during the occlusion (80 min) and during reperfusion (180 min). Brain glutamate levels were similar in treated (before treatment) and control (treated with saline) ischemic animals during occlusion. However, during reperfusion glutamate levels were lower in treated animals compared with the control. (b) Time course of brain glutamate levels in MCAO rats treated with saline (control group) (n=6), oxaloacetate (Oxal) 3.5 mg per 100 g (n=6), rGOT1 12.88 μg per 100 g (n=6) and rGOT1 12.88 μg per 100 g plus oxaloacetate 1.5 mg per 100 g (n=6). Solid arrow indicates the moment of i.v treatment. Cerebral glutamate levels were measured during occlusion (80 min) and reperfusion (180 min). MRS analysis was performed in an independent group of animals. Data are shown as the mean of cerebral glutamate levels relative to the contralateral region±S.E.M. Blue dashed line indicates the levels of brain glutamate in the contralateral region. *P<0.05, **P<0.01 compared with control group
Figure 4 MRS analysis. (a) Quantitative analysis of glutamate signals were normalized to creatine (Cr) peaks for each single spectra. Brain glutamate levels were analyzed during the occlusion (80 min) and during reperfusion (180 min). Brain glutamate levels were similar in treated (before treatment) and control (treated with saline) ischemic animals during occlusion. However, during reperfusion glutamate levels were lower in treated animals compared with the control. (b) Time course of brain glutamate levels in MCAO rats treated with saline (control group) (n=6), oxaloacetate (Oxal) 3.5 mg per 100 g (n=6), rGOT1 12.88 μg per 100 g (n=6) and rGOT1 12.88 μg per 100 g plus oxaloacetate 1.5 mg per 100 g (n=6). Solid arrow indicates the moment of i.v treatment. Cerebral glutamate levels were measured during occlusion (80 min) and reperfusion (180 min). MRS analysis was performed in an independent group of animals. Data are shown as the mean of cerebral glutamate levels relative to the contralateral region±S.E.M. Blue dashed line indicates the levels of brain glutamate in the contralateral region. *P<0.05, **P<0.01 compared with control groupCC BY-NC-ND · PubMed Central
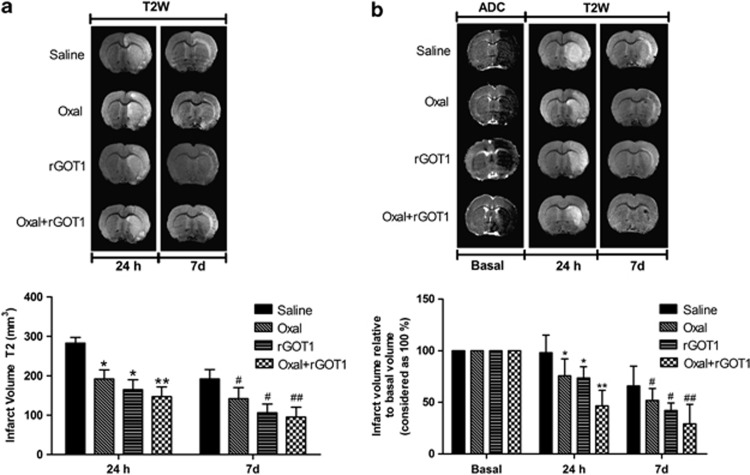
Figure 5 Infarct size assessed by means of MRI in MCAO rats. MCAO rats were treated with saline (control group), oxaloacetate (Oxal) 3.5 mg per 100 g, rGOT1 12.88 μg per 100 g and rGOT1 12.88 μg per 100 g plus oxaloacetate 1.5 mg per 100 g. Treatments were administered at the moment of the reperfusion. Infarct size was assessed in ischemic rats not subjected to spectrocopy analysis (a) as well as in ischemic rats subjected to spectroscopy analysis (b). Infarct sizes were measured at 24 h and 7 days after ischemia. Only those animals subjected to spectroscopy analysis presented ADC basal volumes (determined before the administration of treatment). Data are shown as the mean of infarct volume (mm3)±S.E.M in a, and percentage relative to the basal volume in b. *P<0.05, **P<0.01 with respect to the control group at 24 h; #P<0.05, ##P<0.01 as well as on day 7
Figure 5 Infarct size assessed by means of MRI in MCAO rats. MCAO rats were treated with saline (control group), oxaloacetate (Oxal) 3.5 mg per 100 g, rGOT1 12.88 μg per 100 g and rGOT1 12.88 μg per 100 g plus oxaloacetate 1.5 mg per 100 g. Treatments were administered at the moment of the reperfusion. Infarct size was assessed in ischemic rats not subjected to spectrocopy analysis (a) as well as in ischemic rats subjected to spectroscopy analysis (b). Infarct sizes were measured at 24 h and 7 days after ischemia. Only those animals subjected to spectroscopy analysis presented ADC basal volumes (determined before the administration of treatment). Data are shown as the mean of infarct volume (mm3)±S.E.M in a, and percentage relative to the basal volume in b. *P<0.05, **P<0.01 with respect to the control group at 24 h; #P<0.05, ##P<0.01 as well as on day 7CC BY-NC-ND · PubMed Central
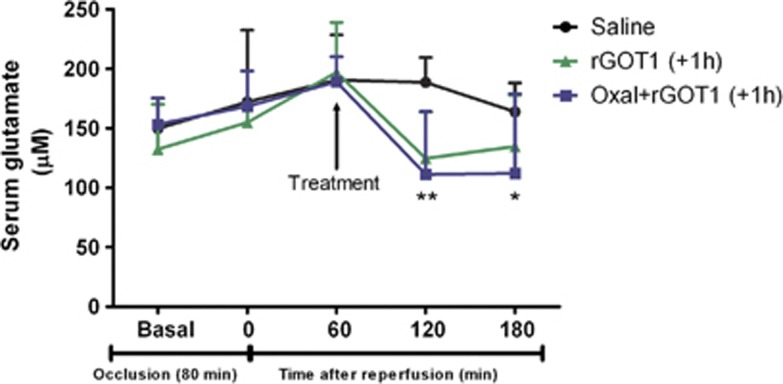
Figure 6 Time course of serum glutamate concentration (μM) in MCAO rats. MCAO rats were treated with saline (control group) (n=6), rGOT1 12.88 μg per 100 g (n=6) and rGOT1 12.88 μg per 100 g plus oxaloacetate 1.5 mg per 100 g (n=6) 1 h after reperfusion. Solid arrow indicates the time of the i.v. treatments. Serum glutamate concentration was measured under basal conditions (before surgery), at the time of reperfusion (before treatment administration), and 1, 2 and 3 h after reperfusion. Data are shown as mean±S.E.M. *P<0.05, **P<0.01 with respect to the control group
Figure 6 Time course of serum glutamate concentration (μM) in MCAO rats. MCAO rats were treated with saline (control group) (n=6), rGOT1 12.88 μg per 100 g (n=6) and rGOT1 12.88 μg per 100 g plus oxaloacetate 1.5 mg per 100 g (n=6) 1 h after reperfusion. Solid arrow indicates the time of the i.v. treatments. Serum glutamate concentration was measured under basal conditions (before surgery), at the time of reperfusion (before treatment administration), and 1, 2 and 3 h after reperfusion. Data are shown as mean±S.E.M. *P<0.05, **P<0.01 with respect to the control groupCC BY-NC-ND · PubMed Central
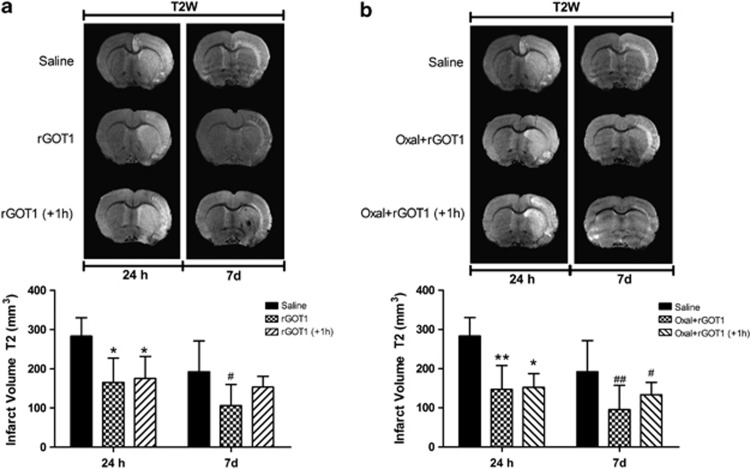
Figure 7 Infarct size assessed by means of MRI in MCAO rats. MCAO rats were treated at two different times. (a) saline (control group) (n=6), rGOT1 12.88 μg per 100 g (rGOT1) (n=6) at the moment of reperfusion, and rGOT1 12.88 μg per 100 g (rGOT1+1 h) (n=6) 1 h after reperfusion. (b) Saline (control group) (n=6), rGOT1 12.88 μg per 100 g plus oxaloacetate 1.5 mg per 100 g (Oxal+rGOT1) (n=6) at the time of the reperfusion and rGOT1 12.88 μg per 100 g plus oxaloacetate 1.5 mg per 100 g (Oxal+rGOT1 +1 h) (n=6) 1 h after reperfusion. Data are shown as the mean of infarct volume (mm3)±S.E.M. *P<0.05, **P<0.01 compared with control group at 24 h; #P<0.05, ##P<0.01 with respect to control group at day 7
Figure 7 Infarct size assessed by means of MRI in MCAO rats. MCAO rats were treated at two different times. (a) saline (control group) (n=6), rGOT1 12.88 μg per 100 g (rGOT1) (n=6) at the moment of reperfusion, and rGOT1 12.88 μg per 100 g (rGOT1+1 h) (n=6) 1 h after reperfusion. (b) Saline (control group) (n=6), rGOT1 12.88 μg per 100 g plus oxaloacetate 1.5 mg per 100 g (Oxal+rGOT1) (n=6) at the time of the reperfusion and rGOT1 12.88 μg per 100 g plus oxaloacetate 1.5 mg per 100 g (Oxal+rGOT1 +1 h) (n=6) 1 h after reperfusion. Data are shown as the mean of infarct volume (mm3)±S.E.M. *P<0.05, **P<0.01 compared with control group at 24 h; #P<0.05, ##P<0.01 with respect to control group at day 7CC BY-NC-ND · PubMed Central
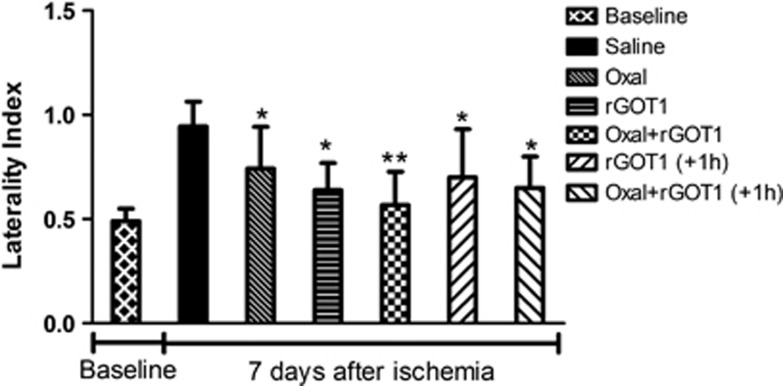
Figure 8 Effect of treatments on somatosensory test. Sensorimotor deficits after an ischemic insult were assessed using the cylinder test and quantified by laterality index. +1 h denotes that those treatments were administered 1 h after reperfusion. Other treatments were administered at the moment of the reperfusion. Somatosensory tests were performed 1 day before surgery (baseline) and on day 7 after MCAO. Values represent the mean±S.E.M, n=6. *P<0.05, **P<0.01 relative to control group
Figure 8 Effect of treatments on somatosensory test. Sensorimotor deficits after an ischemic insult were assessed using the cylinder test and quantified by laterality index. +1 h denotes that those treatments were administered 1 h after reperfusion. Other treatments were administered at the moment of the reperfusion. Somatosensory tests were performed 1 day before surgery (baseline) and on day 7 after MCAO. Values represent the mean±S.E.M, n=6. *P<0.05, **P<0.01 relative to control groupCC BY-NC-ND · PubMed Central

Verification

Claims the paper makes

The claims and statistics of this paper haven’t been checked yet.

Run the check — free, no account needed. It reads the open-access text and checks the sources it cites.

A few free checks a day · papers already verified open instantly · results are public

Claims other papers make about this one

Each is checked against this paper’s own text: does it say what the citing paper says it does?

Self-check

Percentages, sums and reported differences re-computed from the paper’s own numbers.

The self-check needs the paper’s full text.

Citations

Cites

Show all 20 references

Cited by

See all 66

Metadata

Authors
Pérez-Mato, M., Ramos-Cabrer, P., Sobrino, T., Blanco, M., Ruban, A., Mirelman, D., Menendez, P., Castillo, J., & Campos, F.
Venue
Cell Death & Disease
Published
2014-01-09
Volume
5
Issue
1
Pages
e992-e992
ISSN
2041-4889
Cited by
66
References
20
Language
en

About these checks

Registry, retraction, Cites and statistics results are computed, not judged, with one exception: a printed reference that no index lists is read once by a model before it counts as a citation error. Claims are extracted by a model and kept only when their quote appears verbatim in the text; each cited source is then checked, with a model’s help, for whether it says what the claim relies on. Those verdicts can be wrong — read the claim’s quote and the cited source before relying on one.

Statistics and arithmetic are recomputed, not judged.

Confidence bands are shown only for fields calibrated on our annotated test set. None is calibrated yet, so no band is shown.

What counts as a claim ›How we measure confidence ›How we check this ›

Are you an author, or do you see a problem with this page? Request a review

How to cite

Cite CoChat for the checks on this page, and the paper for its own findings.

This page
CoChat. (2026). Citation check: Human recombinant glutamate oxaloacetate transaminase 1 (GOT1) supplemented with oxaloacetate induces a protective effect after cerebral ischemia. https://app.cochat.ai/papers/10.1038/cddis.2013.507
The paper
Pérez-Mato, M., Ramos-Cabrer, P., Sobrino, T., Blanco, M., Ruban, A., Mirelman, D., Menendez, P., Castillo, J., & Campos, F. (2014). Human recombinant glutamate oxaloacetate transaminase 1 (GOT1) supplemented with oxaloacetate induces a protective effect after cerebral ischemia. Cell Death & Disease. https://doi.org/10.1038/cddis.2013.507

Data sources

Bibliographic data: Semantic Scholar, OpenAlex, Crossref.

Contains information from the Semantic Scholar Academic Graph Datasets, made available under the ODC Attribution License (ODC-BY 1.0).

Semantic Scholar’s data is described in: Kinney, R., et al. (2023). The Semantic Scholar Open Data Platform. arXiv:2301.10140.