

The DOI matches its Crossref record; 39 of the 40 references it cites were found in a registry or an index.
In-operando high-speed tomography of lithium-ion batteries during thermal runaway
Open accessAbstract
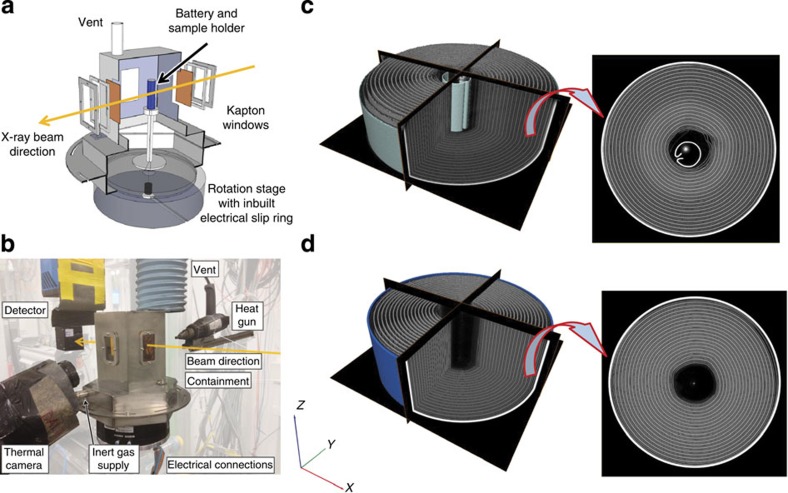
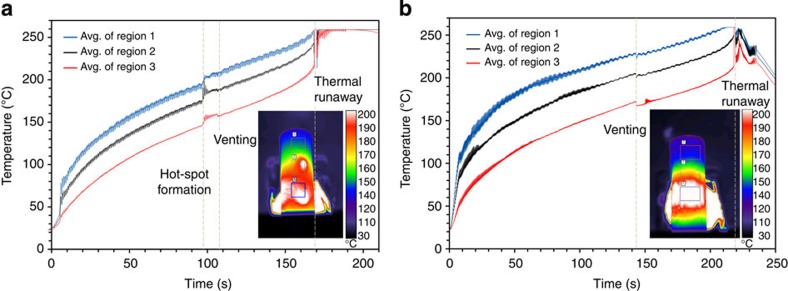
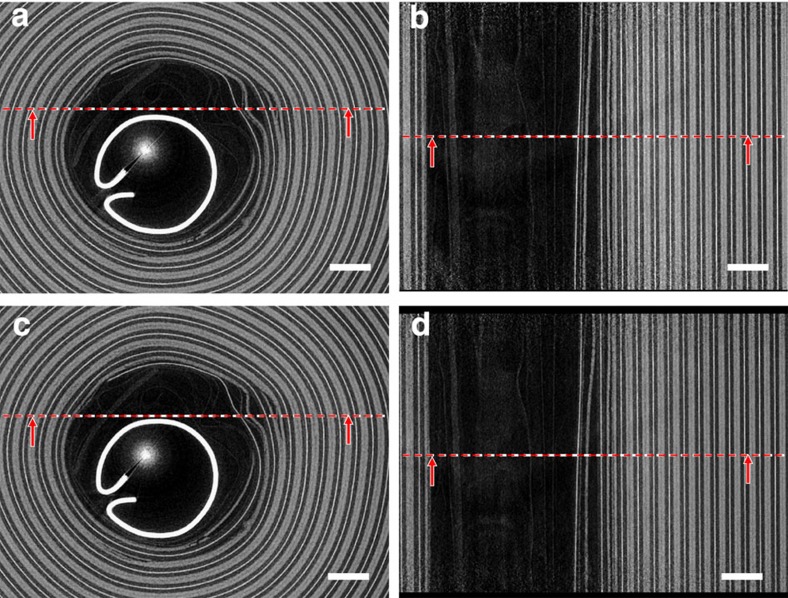
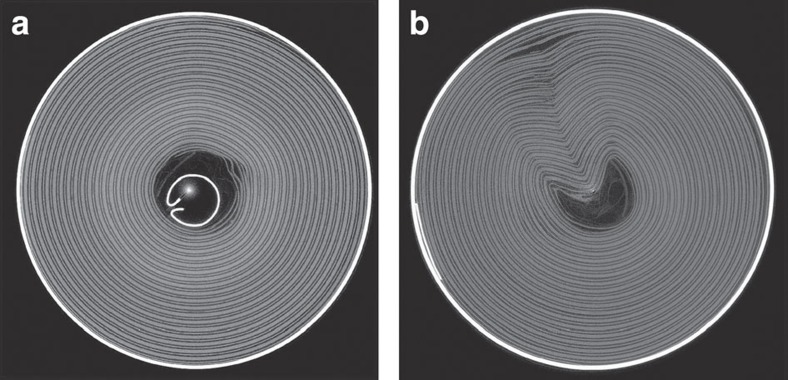
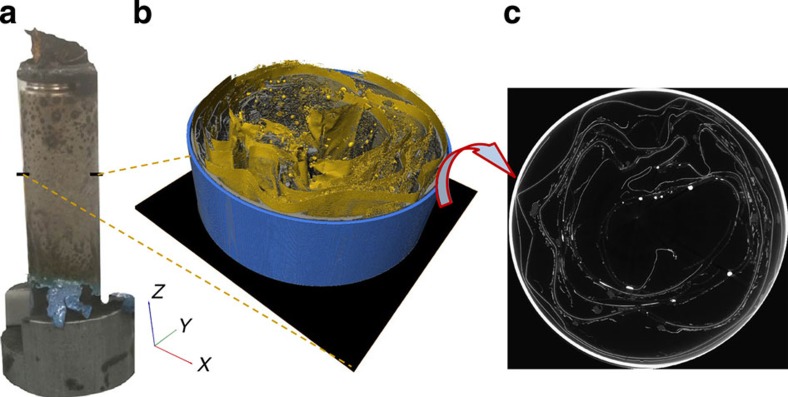
Prevention and mitigation of thermal runaway presents one of the greatest challenges for the safe operation of lithium-ion batteries. Here, we demonstrate for the first time the application of high-speed synchrotron X-ray computed tomography and radiography, in conjunction with thermal imaging, to track the evolution of internal structural damage and thermal behaviour during initiation and propagation of thermal runaway in lithium-ion batteries. This diagnostic approach is applied to commercial lithium-ion batteries (LG 18650 NMC cells), yielding insights into key degradation modes including gas-induced delamination, electrode layer collapse and propagation of structural degradation. It is envisaged that the use of these techniques will lead to major improvements in the design of Li-ion batteries and their safety features.
Overview
The claims and statistics of this paper haven’t been checked yet.
Run the check — free, no account needed. It reads the open-access text and checks the sources it cites.
Integrity signals
Registry
Cites
Statistics
Figures
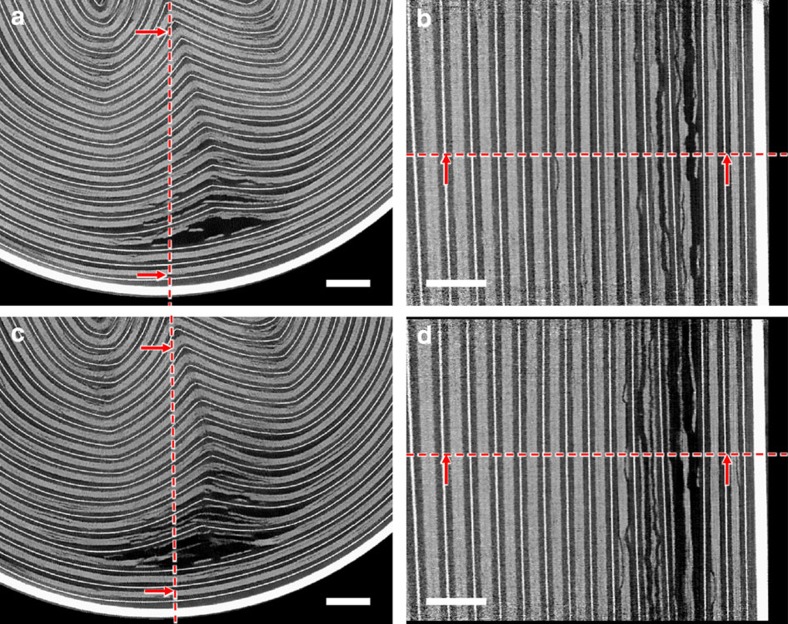
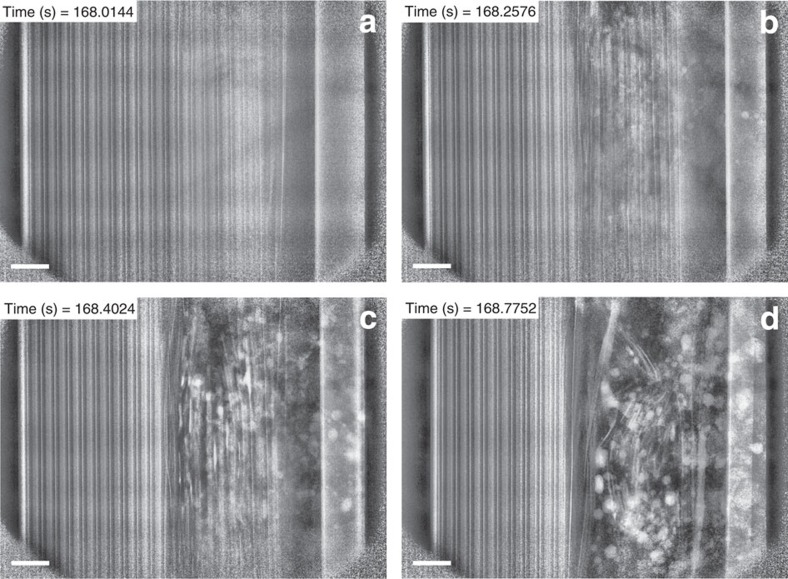
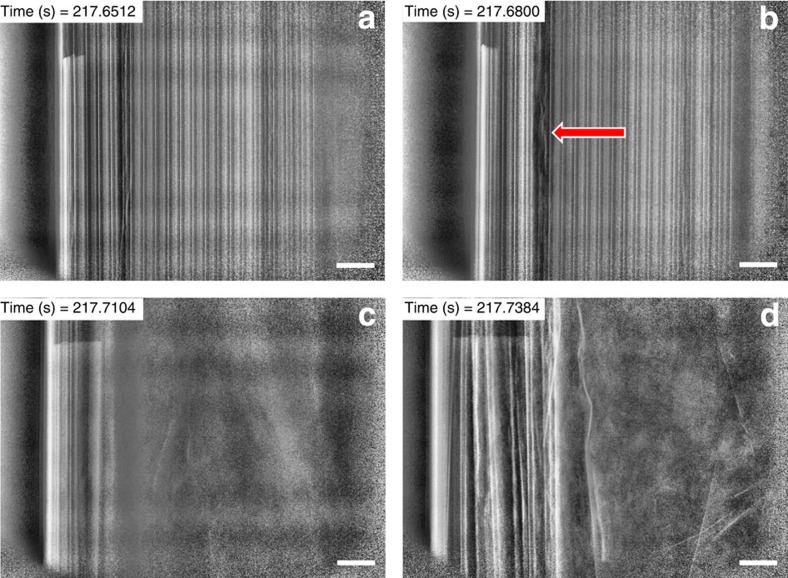
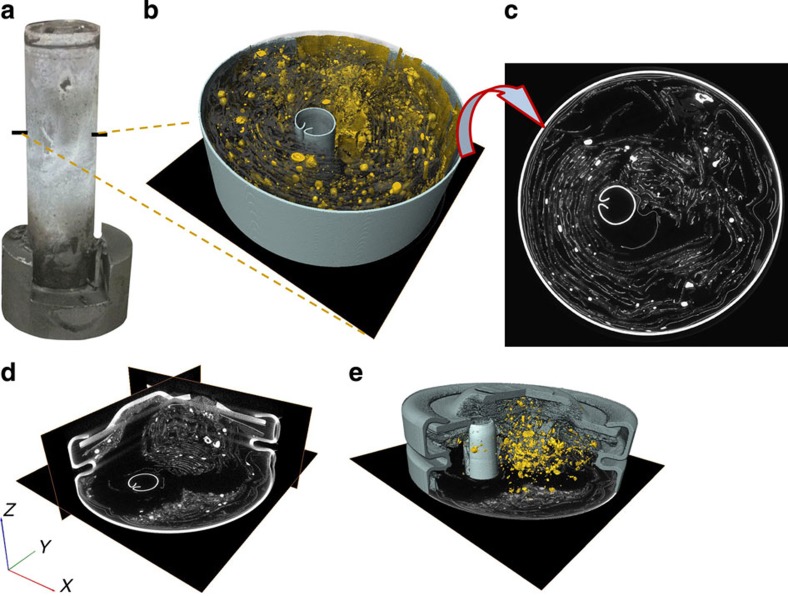
Verification
Claims the paper makes
The claims and statistics of this paper haven’t been checked yet.
Run the check — free, no account needed. It reads the open-access text and checks the sources it cites.
Claims other papers make about this one
Each is checked against this paper’s own text: does it say what the citing paper says it does?
The cited source says what the claim attributes to it.
In the citing paper
“Extremely high temperatures may trigger”
From Data-driven health estimation and lifetime prediction of lithium-ion batteries: A review (2019) · cites this paper as [31]
Self-check
Percentages, sums and reported differences re-computed from the paper’s own numbers.
The self-check needs the paper’s full text.
Citations
Cites
Armand, M., & Tarascon, J.-M. (2008) · Nature · doi:10.1038/451652a · Cited by 19,612
A Review of Image Denoising Algorithms, with a New One
Buades, A., Coll, B., & Morel, J. (2005) · Multiscale Modeling and Simulation · doi:10.1137/040616024 · Cited by 4,120
Lithium-ion batteries. A look into the future
Scrosati, B., Hassoun, J., & Sun, Y. (2011) · Energy & Environmental Science · doi:10.1039/c1ee01388b · Cited by 2,602
Arora, P., & Zhang, Z. (2004) · Chemical Reviews · doi:10.1021/cr020738u · Cited by 2,183
Abuse behavior of high-power, lithium-ion cells
Spotnitz, R. M., & Franklin, J. (2002) · Journal of Power Sources · doi:10.1016/s0378-7753(02)00488-3 · Cited by 1,419
Maire, É., & Withers, P. J. (2013) · International Materials Reviews · doi:10.1179/1743280413y.0000000023 · Cited by 1,391
Safety mechanisms in lithium-ion batteries
Balakrishnan, P., Ramesh, R., & Kumar, T. (2006) · Journal of Power Sources · doi:10.1016/j.jpowsour.2005.12.002 · Cited by 1,084
Thermal-runaway experiments on consumer Li-ion batteries with metal-oxide and olivin-type cathodes
Golubkov, A. W., Fuchs, D., Wagner, J., Wiltsche, H., Stangl, C., Fauler, G., Voitic, G., Thaler, A., & Hacker, V. (2013) · RSC Advances · doi:10.1039/c3ra45748f · Cited by 910
A three-dimensional thermal abuse model for lithium-ion cells
Kim, G., Pesaran, A., & Spotnitz, R. M. (2007) · Journal of Power Sources · doi:10.1016/j.jpowsour.2007.04.018 · Cited by 889
Visualization and Quantification of Electrochemical and Mechanical Degradation in Li Ion Batteries
Ebner, M., Marone, F., Stampanoni, M., & Wood, V. C. (2013) · Science · doi:10.1126/science.1241882 · Cited by 699
Research works printed but not linked: 2
- Jacoby, M. Assessing the safety of lithium-ion batteries. Chem. Eng. News 91, 33–37 (2013).
- Slaney, M. & Kak, A. C. Principles of Computerized Tomographic Imaging IEEE, New York (1988).
Cited by
Sorted by citations
Items 401–500 of 844
Venting particle-induced arc of lithium-ion batteries during the thermal runaway
Li, C., Wang, H., Li, Y., & Lu, L. (2024) · eTransportation · doi:10.1016/j.etran.2024.100350 · Cited by 23
Role of Amines in Thermal-Runaway-Mitigating Lithium-Ion Battery
Shi, Y., Noelle, D. J., Wang, M., Le, A. V., Yoon, H., Zhang, M., Meng, Y. S., & Qiao, Y. (2016) · ACS Applied Materials & Interfaces · doi:10.1021/acsami.6b10501 · Cited by 23
Mitigating thermal runaway of lithium-ion battery through electrolyte displacement
Shi, Y., Noelle, D. J., Wang, M., Le, A. V., Yoon, H., Zhang, M., Meng, Y. S., Fan, J., Wu, D., & Qiao, Y. (2017) · Applied Physics Letters · doi:10.1063/1.4975653 · Cited by 23
Huang, Z. X., Sim, G. J., Tan, J. C., Low, H. Y., & Yang, H. Y. (2018) · Energy Technology · doi:10.1002/ente.201700858 · Cited by 23
Wang, H., Wang, P., Ji, Z., Chen, Z., Wang, J., Ling, W., Liu, J., Hu, M., Zhi, C., & Huang, Y. (2021) · Nano Research · doi:10.1007/s12274-021-3356-5 · Cited by 23
Theiler, M., Baumann, A., & Endisch, C. (2024) · Journal of Energy Storage · doi:10.1016/j.est.2024.112483 · Cited by 22
Gou, Y., Yan, Y., Lyu, Y., Chen, S., Li, J., & Liu, Y. (2024) · Ultrasonics · doi:10.1016/j.ultras.2024.107400 · Cited by 23
Battery health state prediction based on lightweight neural networks: A review
Zhang, L., Wang, S., Wang, S., Zhong, B., Li, Z., Wang, L., & Wang, K. (2024) · Ionics · doi:10.1007/s11581-024-05857-y · Cited by 22
Yang, Y., Wang, J., Luo, H., Yu, X., Lin, Y., Ru, Y., Liu, Z., Wang, P., Gong, Y., Li, J., et al. (2026) · Journal of the American Chemical Society · doi:10.1021/jacs.5c23075 · Cited by 22
Haas, R., Pompe, C., Osenberg, M., Hilger, A., Manke, I., Mogwitz, B., Maitra, U., Langsdorf, D., & Schröder, D. (2019) · Energy Technology · doi:10.1002/ente.201801146 · Cited by 22
Jin, C., Sun, Y., Zheng, Y., Yao, J., Wang, Y., Lai, X., Xu, C., Wang, H., Zhang, F., Li, H., et al. (2023) · Cell Reports Physical Science · doi:10.1016/j.xcrp.2023.101465 · Cited by 22
Optical Fiber‐Based Gas Sensing for Early Warning of Thermal Runaway in Lithium‐Ion Batteries
Chen, X., Gan, L., & Guo, X. (2023) · Advanced Sensor Research · doi:10.1002/adsr.202300055 · Cited by 23
Darmet, N., Charbonnel, J., Reytier, M., Broche, L., & Vincent, R. (2024) · ACS Applied Energy Materials · doi:10.1021/acsaem.4c00248 · Cited by 22
Pegel, H., Autenrieth, M., Schaeffler, S., Jossen, A., & Sauer, D. U. (2024) · Journal of Energy Storage · doi:10.1016/j.est.2024.111275 · Cited by 21
Batch diagnosis of batteries within one second
Zhou, S., Du, W., Mager, B., Shearing, P. R., Miller, T. S., & Jervis, R. (2025) · Joule · doi:10.1016/j.joule.2025.102099 · Cited by 21
Self-citationHigh-speed multi-beam X-ray imaging using a lens coupling detector system
Shirasawa, T., Xiaouyu, L., Voegeli, W., Arakawa, E. T., Kajiwara, K., & Yashiro, W. (2020) · Applied Physics Express · doi:10.35848/1882-0786/ab9d30 · Cited by 21
Fire blanket and intumescent coating materials for failure resistance
Takahashi, F. (2021) · MRS Bulletin · doi:10.1557/s43577-021-00102-7 · Cited by 21
An intrinsic safe siloxane ether-based electrolyte for lithium-sulfur batteries at high temperatures
Ma, H., Wang, Q., Lu, H., Si, Y.-B., Kong, X.-R., & Wang, J.-L. (2023) · Chemical Engineering Journal · doi:10.1016/j.cej.2023.147557 · Cited by 16
In situ neutron imaging of lithium-ion batteries during heating to thermal runaway
Nozaki, H., Kondo, H., Shinohara, T., Setoyama, D., Matsumoto, Y., Sasaki, T. G., Isegawa, K., & Hayashida, H. (2023) · Scientific Reports · doi:10.1038/s41598-023-49399-1 · Cited by 21
Recent advances in Sb-based anodes for Li/Na/K-ion batteries and all-solid-state Li-ion batteries
Yoon, J., Kim, D.-G., Kim, D., Lee, Y. H., & Park, C. (2024) · Energy Materials · doi:10.20517/energymater.2023.146 · Cited by 21
Quantifying concentration distributions in redox flow batteries with neutron radiography
Jacquemond, R. R., van der Heijden, M., Boz, E. B., Ruiz, E. R. C., Greco, K. V., Kowalski, J. A., Muñoz, V., Brushett, F. R., Nijmeijer, K., Boillat, P., et al. (2024) · Nature Communications · doi:10.1038/s41467-024-50120-7 · Cited by 21
Operando electrochemical NMR microscopy of polymer fuel cells
Cattaneo, A. S., Villa, D. C., Angioni, S., Ferrara, C., Melzi, R., Quartarone, E., & Mustarelli, P. (2015) · Energy & Environmental Science · doi:10.1039/c5ee01668a · Cited by 21
Yang, R. X., Wang, Y., Wu, D., Deng, Y., Luo, Y., Cui, X., Wang, X., Shu, Z., & Yang, C. (2017) · ACS Nano · doi:10.1021/acsnano.7b00935 · Cited by 21
Pang, M.-C., Wei, Y., Wang, H., Marinescu, M., Yan, Y., & Offer, G. J. (2020) · Journal of The Electrochemical Society · doi:10.1149/1945-7111/abd493 · Cited by 21
Self-citationChen, L., Pereira, C., Pannala, S., Munjurulimana, D., & Goossens, H. (2024) · Journal of Energy Storage · doi:10.1016/j.est.2024.115042 · Cited by 20
Du, W., Iacoviello, F., Mirza, M., Zhou, S., Bu, J., Feng, S., Grant, P. S., Jervis, R., Brett, D. J. L., & Shearing, P. R. (2025) · Materials Today · doi:10.1016/j.mattod.2025.02.023 · Cited by 20
Self-citationGhosh, A., Tian, S., Zhang, M., Lorero, I., Chen, Q., Islam, M., Bhatia, B., Prolongo, S. G., Lochab, B., & Wang, D. (2025) · Advanced Functional Materials · doi:10.1002/adfm.202502761 · Cited by 20
Study on survivability of 18650 Lithium-ion cells at cryogenic temperatures
Nandini, K., Usha, K., Srinivasan, M., Pramod, M., Satyanarayana, P., & Sankaran, M. (2018) · Journal of Energy Storage · doi:10.1016/j.est.2018.03.018 · Cited by 21
Zhang, Q., Huang, H. H., Liu, T., Wang, Y., Yu, J., & Hu, Z. (2021) · Polymer · doi:10.1016/j.polymer.2021.124450 · Cited by 20
Xia, H., Lv, Z., Zhang, W., Wei, J., Liu, L., Cao, S., Zhu, Z., Tang, Y., & Chen, X. (2022) · Advanced Materials · doi:10.1002/adma.202109857 · Cited by 20
In situ chamber for studying battery failure using high-speed synchrotron radiography
Pfaff, J., Fransson, M., Broche, L., Buckwell, M., Finegan, D. P., Moser, S., Schopferer, S., Nau, S., Shearing, P. R., & Rack, A. (2022) · Journal of Synchrotron Radiation · doi:10.1107/s1600577522010244 · Cited by 20
Self-citationBatteries for small-scale robotics
Zhu, M., & Schmidt, O. G. (2024) · MRS Bulletin · doi:10.1557/s43577-023-00651-z · Cited by 20
Shurtz, R. C., Preger, Y., Torres-Castro, L., Lamb, J., Hewson, J. C., & Ferreira, S. R. (2019) · Journal of The Electrochemical Society · doi:10.1149/2.0341912jes · Cited by 20
Akada, K., Sudayama, T., Asakura, D., Kitaura, H., Nagamura, N., Horiba, K., Oshima, M., Hosono, E., & Harada, Y. (2019) · Scientific Reports · doi:10.1038/s41598-019-48842-6 · Cited by 20
Pang, M.-C., Hao, Y., Marinescu, M., Wang, H., Chen, M., & Offer, G. J. (2019) · Physical Chemistry Chemical Physics · doi:10.1039/c9cp03886h · Cited by 20
Self-citationData Challenges of In Situ X-Ray Tomography for Materials Discovery and Characterization
Patterson, B. M., Cordes, N. L., Henderson, K. C., Xiao, X., & Chawla, N. (2018) · Springer series in materials science · doi:10.1007/978-3-319-99465-9_6 · Cited by 20
Zeng, D., Mohaddes, D., Gagnon, L., & Wang, Y. (2024) · Proceedings of the Combustion Institute · doi:10.1016/j.proci.2024.105316 · Cited by 19
Jiang, J., Liu, X., Li, X., & Yang, R. (2024) · Journal of Power Sources · doi:10.1016/j.jpowsour.2024.235130 · Cited by 19
Experimental and numerical study of internal pressure of lithium-ion batteries under overheating
Chen, H., Gulsoy, B., Barai, A., Nakhanivej, P., Loveridge, M., & Marco, J. (2025) · Journal of Energy Storage · doi:10.1016/j.est.2025.116066 · Cited by 19
In situ visualization of multicomponents coevolution in a battery pouch cell
Zan, G., Qian, G., Gul, S., Li, J., Matusik, K., Wang, Y., Lewis, S. J. Y., Yun, W., Pianetta, P., Vine, D. J., et al. (2022) · Proceedings of the National Academy of Sciences · doi:10.1073/pnas.2203199119 · Cited by 19
Hoelle, S., Dengler, F., Zimmermann, S., & Hinrichsen, O. (2023) · Journal of The Electrochemical Society · doi:10.1149/1945-7111/acac06 · Cited by 19
Bauermann, L. P., Münch, J., Kroll, M., Enghardt, S., & Vetter, M. (2023) · Energy Technology · doi:10.1002/ente.202300323 · Cited by 19
Read, E., Mathew, J., Charmer, S., Dowson, M., Lorincz, D., Örökös-Tóth, I., Dobson, M., & Marco, J. (2024) · Journal of Energy Storage · doi:10.1016/j.est.2024.112491 · Cited by 19
Pi, Y., Gan, Z., Li, Z., Ruan, Y., Pei, C., Yu, H., Han, K., Ge, Y., An, Q., & Mai, L. (2020) · Nanoscale · doi:10.1039/d0nr04884d · Cited by 19
Ziesche, R. F., Robinson, J. B., Kok, M. D. R., Markötter, H., Kockelmann, W. A., Kardjilov, N., Manke, I., Brett, D. J. L., & Shearing, P. R. (2020) · Journal of The Electrochemical Society · doi:10.1149/1945-7111/abbbbc · Cited by 19
Self-citationDetection of internal short circuit in lithium-ion batteries based on electrothermal coupling model
Pan, T., Yu, Z., Ma, S., Xu, D., Ye, Y., & Li, J. (2024) · Journal of Energy Storage · doi:10.1016/j.est.2024.114685 · Cited by 18
Self-thermoregulating current collectors: built-in thermal protection for safe lithium-ion batteries
Peng, Y., Meng, T., Li, P., Li, R., & Hu, X. (2025) · Energy & Environmental Science · doi:10.1039/d4ee04896b · Cited by 18
Le, P.-A. (2025) · RSC Advances · doi:10.1039/d5ra04471e · Cited by 24
Li, C., Wang, H., Han, X., Wang, Y., Wang, Y., Zhang, Y., Feng, X., & Ouyang, M. (2020) · Journal of Electrochemical Energy Conversion and Storage · doi:10.1115/1.4048936 · Cited by 18
Degradation diagnosis of lithium-ion batteries considering internal gas evolution
Ju, L., Li, X., Geng, G., & Jiang, Q. (2023) · Journal of Energy Storage · doi:10.1016/j.est.2023.108084 · Cited by 18
Pegel, H., Schaeffler, S., Jossen, A., & Sauer, D. U. (2023) · Journal of The Electrochemical Society · doi:10.1149/1945-7111/ad0cd3 · Cited by 18
Swamy, K. A., & Verma, S. (2024) · Journal of Thermal Science and Engineering Applications · doi:10.1115/1.4066691 · Cited by 18
Application of nitrides in energy storage field
Zhang, W., Li, L., Zhang, J., Liu, D., Wang, Q., Ren, J., Li, J., Guo, X. D., & Lu, X. (2025) · Journal of Alloys and Compounds · doi:10.1016/j.jallcom.2025.179847 · Cited by 19
High-speed tomography of local-plasma-induced rapid microwave sintering of aluminum
Xu, F., Liu, W., Xiao, Y., Dong, B., Hu, X., & Wu, X. (2017) · Applied Physics Letters · doi:10.1063/1.4978257 · Cited by 18
Operando probing of Li-insertion into LiMn 2 O 4 cathodes by spectroscopic ellipsometry
Morata, À., Siller, V., Chiabrera, F. M., Núñez, M., Trócoli, R., Stchakovsky, M., & Tarancón, A. (2020) · Journal of Materials Chemistry A · doi:10.1039/c9ta12723b · Cited by 18
“In-situ” x-ray imaging technology for material and manufacturing science: A review
Nguyen, V. A., Le, D. H., Damian, D., Tran, T. B., Le, Q. H., & Nguyen, N.-T. (2025) · Journal of Manufacturing Processes · doi:10.1016/j.jmapro.2025.03.049 · Cited by 17
Guo, W., Li, L., Yang, J., Yu, K., Sun, X., Wang, Z., Wang, J., & Zhang, J. (2025) · Polymer Degradation and Stability · doi:10.1016/j.polymdegradstab.2025.111355 · Cited by 17
Li, Y., Zhou, Z., & Wu, W. (2020) · Energies · doi:10.3390/en13041013 · Cited by 17
Chen, Y., Li, D., Feng, S., Huang, Q., Chen, Z., & Shu, D. (2022) · Applied Thermal Engineering · doi:10.1016/j.applthermaleng.2022.119162 · Cited by 17
Experimental study of thermal runaway process of 256Ah prismatic nickel-rich battery
Wei, N., & Li, M. (2023) · Frontiers in Energy Research · doi:10.3389/fenrg.2023.1230429 · Cited by 17
A review on the transport law and control method of fire smoke from energy storage system in tunnels
Qian, C., Ding, H., Xie, J., Jiang, X., Chen, Q., Chen, Y., Liu, C., & Huang, Q. (2023) · Journal of Energy Storage · doi:10.1016/j.est.2023.108929 · Cited by 17
Böttcher, N., Dayani, S., Markötter, H., Bau, A., Setzchen, M., Schmidt, A., Kowal, J., & von Nidda, J. K. (2024) · Energy Technology · doi:10.1002/ente.202301379 · Cited by 17
Gillich, E. I., Steinhardt, M., Fedoryshyna, Y., & Jossen, A. (2024) · Batteries · doi:10.3390/batteries10040142 · Cited by 17
Zhou, Q., Zhong, C., Wang, S., Jiang, P., Wang, L., Wang, X., & Zhan, C. (2024) · Energy storage materials · doi:10.1016/j.ensm.2024.103932 · Cited by 17
Structure and Dynamics of the Lithium Ion Solvation Shell in Ureas.
Chen, X.-B., Fulfer, K. D., Woodard, K. T., & Kuroda, D. (2019) · Journal of Physical Chemistry B · doi:10.1021/acs.jpcb.9b07623 · Cited by 13
Lou, Z., Huang, J., Sun, G., Qin, H., Song, H., Zhang, Z., & Yao, H. (2025) · Process Safety and Environmental Protection · doi:10.1016/j.psep.2025.01.019 · Cited by 16
Ding, Y. H., Lü, L., & Zhang, H. (2025) · eTransportation · doi:10.1016/j.etran.2025.100427 · Cited by 16
Beyond Separation: Multifunctional Separators in Rechargeable Batteries
Cao, M., Bu, F., Liu, X., Ng, C. H., & Guan, C. (2025) · Advanced Energy Materials · doi:10.1002/aenm.202502540 · Cited by 16
Liu, X., Xu, D., Meng, X., Lu, Z., Chen, Y., Liu, C., & Huang, Q. (2022) · Case Studies in Thermal Engineering · doi:10.1016/j.csite.2022.102155 · Cited by 16
The Operation Dependence of C − N Fatigue for Lithium‐Ion Batteries
Chen, C., Zou, Q., Wen, J., Liu, J., Notten, P. H. L., & Wei, Y. (2023) · Advanced Energy Materials · doi:10.1002/aenm.202300942 · Cited by 16
Lenz, C., Hennig, J., Tegethoff, W. J., Schweiger, H., & Koehler, J. (2023) · Journal of The Electrochemical Society · doi:10.1149/1945-7111/acd964 · Cited by 16
Choi, S., Kim, N., Jin, D., Roh, Y., Kang, D., Lee, H., Hong, S.-T., Lee, H., & Lee, Y. M. (2023) · Journal of Power Sources · doi:10.1016/j.jpowsour.2023.233265 · Cited by 16
Lee, M., Shin, Y., Chang, H., Jin, D., Lee, H., Lim, M., Seo, J., Band, T., Kaufmann, K., Moon, J., et al. (2023) · Small Methods · doi:10.1002/smtd.202300748 · Cited by 16
Effects of Electrode Curvature in Li-Ion Cells
Schäfer, R., Delz, E., Kasper, M., Knoblauch, V., Wohlfahrt‐Mehrens, M., & Waldmann, T. (2023) · Journal of The Electrochemical Society · doi:10.1149/1945-7111/ad1304 · Cited by 16
Kiriy, N., Özenler, S., Voigt, P., Kobsch, O., Meier‐Haack, J., Arnhold, K., Janke, A., Muza, U. L., Geisler, M., Lederer, A., et al. (2024) · International Journal of Molecular Sciences · doi:10.3390/ijms25031595 · Cited by 16
Zhang, Y., Gao, K., Ma, T., Wang, H., & Li, Y. (2024) · Reliability Engineering & System Safety · doi:10.1016/j.ress.2024.110374 · Cited by 16
Ziesche, R. F., Robinson, J. B., Markötter, H., Bradbury, R., Tengattini, A., Lenoir, N., Helfen, L., Kockelmann, W. A., Kardjilov, N., Manke, I., et al. (2020) · Journal of The Electrochemical Society · doi:10.1149/1945-7111/abbfd9 · Cited by 16
Self-citationTang, X., Wei, X., Zhang, H., Li, D., Zhang, G., Wang, X., Zhu, J., & Dai, H. (2021) · International Journal of Energy Research · doi:10.1002/er.6552 · Cited by 16
Yu, T., Xue, P., Ma, S., Gu, Y., Wang, Y., & Xu, X. (2022) · ChemistrySelect · doi:10.1002/slct.202104499 · Cited by 16
Kirchner-Burles, C., Fordham, A., Reid, H. T., Johnson, M. J., Buckwell, M., Iacoviello, F., Coke, K., Jervis, R., Hinds, G., Shearing, P. R., et al. (2025) · Journal of Power Sources · doi:10.1016/j.jpowsour.2025.238565 · Cited by 17
Self-citationWatanabe, H., Uemori, M., Shitanda, I., & Itagaki, M. (2022) · Electrochimica Acta · doi:10.1016/j.electacta.2022.140957 · Cited by 15
Feng, J., Chen, Z., Zhou, W., & Hao, Z. (2023) · Materials Horizons · doi:10.1039/d3mh00780d · Cited by 16
A Stable Triazole‐Based Covalent Gel for Long‐Term Cycling Zn Anode in Zinc‐Ion Batteries
Cui, J., Tao, Z., Wu, J., Ma, S., Yang, Y.-Y., & Zhang, J. (2023) · Small · doi:10.1002/smll.202304640 · Cited by 15
Miranda, J., Franklin, G. F., Mathis, T. S., Taberna, P., & Simon, P. (2023) · Energy storage materials · doi:10.1016/j.ensm.2023.103105 · Cited by 15
Wang, C., Yuan, K., Song, Q., Yu, J., Yang, J., Qu, J., & Zhu, Y. (2024) · International Journal of Heat and Mass Transfer · doi:10.1016/j.ijheatmasstransfer.2024.125190 · Cited by 15
Liu, Y., Li, Y., Liao, Y. G., & Lai, M. (2021) · Batteries · doi:10.3390/batteries7040081 · Cited by 15
Monitoring dynamic electrochemical processes with in situ ptychography
Kourousias, G., Bozzini, B., Jones, M. W., van Riessen, G. A., Zilio, S. D., Billè, F., Kiskinova, M. P., & Gianoncelli, A. (2018) · Applied Nanoscience · doi:10.1007/s13204-018-0703-2 · Cited by 14
Niri, M. F., Mase, J. M., & Marco, J. (2022) · Energies · doi:10.3390/en15124489 · Cited by 14
Levenstein, M. A., Chevallard, C., Malloggi, F., Testard, F., & Taché, O. (2025) · Lab on a Chip · doi:10.1039/d4lc00637b · Cited by 14
Defect Detection in Solid-State Battery Electrolytes Using Lock-In Thermal Imaging
Sulas, D. B., Johnston, S. W., Seitzman, N., Platt, H. A. S., Al-Jassim, M. M., & Guthrey, H. L. (2018) · Journal of The Electrochemical Society · doi:10.1149/2.0131814jes · Cited by 14
Developments in fuel cells and electrochemical batteries using nanoparticles and nanofluids
Ghosh, S., & Subudhi, S. (2021) · Energy Storage · doi:10.1002/est2.288 · Cited by 14
Towards Fire Forensic Characteristics of Failed Cylindrical Format Lithium–Ion Cells and Batteries
Yan, H., Marr, K. C., & Ezekoye, O. A. (2021) · Fire Technology · doi:10.1007/s10694-020-01079-6 · Cited by 14
Wang, Q., Yan, H., Yang, Y., Zhao, X., Huang, G., Huang, Z., Zhu, Z., Liu, S. V., Yi, B., Huang, G., et al. (2025) · Batteries · doi:10.3390/batteries11110414 · Cited by 14
Wang, C., Xiong, Y., Wang, H., Yang, N., Jin, C., & Sun, Q. (2018) · Journal of The Electrochemical Society · doi:10.1149/2.1001805jes · Cited by 13
Flow in Porous Media in the Energy Transition
Blunt, M. J., & Lin, Q. (2021) · Engineering · doi:10.1016/j.eng.2021.08.008 · Cited by 12
Radhakrishnan, A. N. P., Buckwell, M., Pham, M., Finegan, D. P., Rack, A., Hinds, G., Brett, D. J. L., & Shearing, P. R. (2022) · Energy & Environmental Science · doi:10.1039/d1ee03430h · Cited by 13
Self-citationQian, G., Kuppan, S., Gallo, A., Zhou, J., Liu, Z., & Liu, Y. (2024) · Energy storage materials · doi:10.1016/j.ensm.2024.103819 · Cited by 13
Li, X., Zhang, C., & Meng, T. (2015) · RSC Advances · doi:10.1039/c5ra24131f · Cited by 13
Active cooling of microvascular composites for battery packaging
Pety, S. J., Chia, P. X. L., Carrington, S. M., & White, S. R. (2017) · Smart Materials and Structures · doi:10.1088/1361-665x/aa84e7 · Cited by 13
A closer look at high-energy X-ray-induced bubble formation during soft tissue imaging
Xian, R. P., Brunet, J., Huang, Y., Wagner, W. L., Lee, P. D., Tafforeau, P., & Walsh, C. (2024) · Journal of Synchrotron Radiation · doi:10.1107/s160057752400290x · Cited by 13
Metadata
- Authors
- Finegan, D. P., Scheel, M., Robinson, J. B., Tjaden, B., Hunt, I., Mason, T. J., Millichamp, J., Di Michiel, M., Offer, G. J., Hinds, G., Brett, D. J. L., & Shearing, P. R.
- Affiliations
- University College London (GB)
- Synchrotron SOLEIL (FR)
- Imperial College London (GB)
- National Physical Laboratory (GB)
- Corresponding author
- Shearing, Paul R.
- ORCID
- Venue
- Nature Communications
- Published
- 2015-04-28
- Volume
- 6
- Issue
- 1
- Pages
- 6924-6924
- ISSN
- 2041-1723 (ISSN-L)
- PMC
- PMC4423228
- OpenAlex
- W2066988889
- Cited by
- 844
- References
- 40
- Citations by year
- 2026: 130 · 2025: 108 · 2024: 109 · 2023: 87 · 2022: 77 · 2021: 69 · 2020: 69 · 2019: 53 · 2018: 54 · 2017: 42 · 2016: 34 · 2015: 12
- FWCI
- 48.88
- Type
- journal article
- Language
- en
- Open access
- gold
- doi.org
- Locations
- Nature Communications (publishedVersion, cc-by)
- PubMed Central (publishedVersion, cc-by)
- PubMed (publishedVersion)
- HAL (submittedVersion, other-oa)
- RePEc: Research Papers in Economics (submittedVersion)
- UCL Discovery (University College London) (submittedVersion)
- Funders
- Royal Academy of Engineering
- European Synchrotron Radiation Facility (ID15A)
- Engineering and Physical Sciences Research Council (EP/I00422X/1, 1528603)
- Science and Technology Facilities Council (ST/K00171X/1)
- National Physical Laboratory
- Topics
- Physical Sciences › Engineering › Automotive Engineering › Battery Modeling and Management
- Physical Sciences › Engineering › Electrical and Electronic Engineering › Advancements in Battery Materials
- Physical Sciences › Engineering › Electrical and Electronic Engineering › Advanced Battery Materials and Technologies
- Keywords
- lithium-ion batteries, thermal runaway, synchrotron X-ray tomography, high-speed radiography, infrared thermography, battery safety, NMC cells, 18650 cells, structural deterioration, degradation modes
About these checks
Registry, retraction, Cites and statistics results are computed, not judged, with one exception: a printed reference that no index lists is read once by a model before it counts as a citation error. Claims are extracted by a model and kept only when their quote appears verbatim in the text; each cited source is then checked, with a model’s help, for whether it says what the claim relies on. Those verdicts can be wrong — read the claim’s quote and the cited source before relying on one.
Statistics and arithmetic are recomputed, not judged.
Confidence bands are shown only for fields calibrated on our annotated test set. None is calibrated yet, so no band is shown.
What counts as a claim ›How we measure confidence ›How we check this ›
Are you an author, or do you see a problem with this page? Request a review
