Cited by 16Extracellular vesicles in diseaseLiver physiology and pathologyMesenchymal stem cell research

The DOI matches its Crossref record; 1 of the 1 references it cites were found in a registry or an index.

Engineered EVs from LncEEF1G - overexpressing MSCs promote fibrotic liver regeneration by upregulating HGF release from hepatic stellate cells

Open access

Published version of a preprint

Abstract

Fibrosis is a disease that negatively affects liver regeneration, resulting in severe complications after liver surgery. However, there is still no clinically effective treatment for promoting fibrotic liver regeneration because the underlying hepatocellular mechanism remains poorly understood. Through microRNA microarrays combined with the application of AAV6, we found that high expression of miR-181a-5p in activated hepatic stellate cells (HSCs) suppressed the expression of hepatic growth factor (HGF) and partially contributed to impaired regeneration potential in mice with hepatic fibrosis that had undergone two-thirds partial hepatectomy. As nanotherapeutics, mesenchymal stem-cell-derived extracellular vesicles (MSC-EVs) have been verified as effective treatments for liver regeneration. Here we observe that MSC-EVs can also promote fibrotic liver regeneration via enriched lncEEF1G, which acts as a competing endogenous RNA to directly sponge miR-181a-5p, leading to the upregulated expression of HGF in HSCs. Finally, engineered MSC-EVs with high expression of lncEEF1G (lncEEF1G OE -EVs) were constructed, suggesting greater potential for this model. In summary, our findings indicate that lncEEF1G OE -EVs have a nanotherapeutic effect on promoting regeneration of fibrotic livers by modulating the miR-181a-5p/HGF pathway in HSCs, which highlights the potential of extracellular vesicle engineering technology for patients with hepatic fibrosis who have undergone hepatic surgery.

Overview

The claims and statistics of this paper haven’t been checked yet.

Run the check — free, no account needed. It reads the open-access text and checks the sources it cites.

A few free checks a day · papers already verified open instantly · results are public

Integrity signals

Registry

Crossref · 10.1038/s12276-025-01413-4

Cites

1 of 1 references verified0 citation errors · 0 not checkable

Statistics

Figures

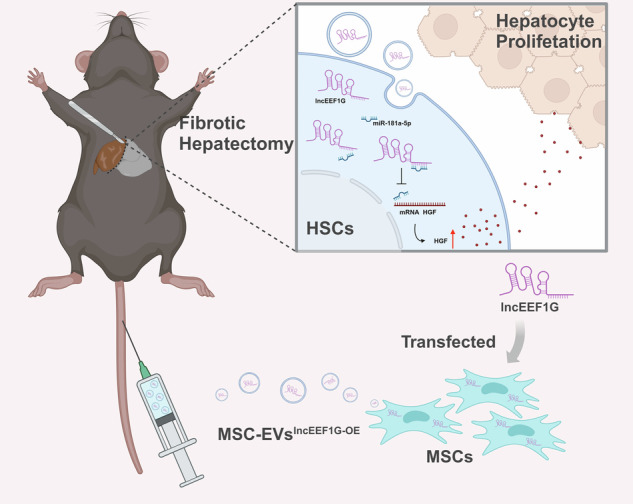
Engineered mesenchymal stem cells that overexpress lncEEF1G can secrete extracellular vesicles that are rich in lncEEF1G (lncEEF1GOE-EVs). Upon injection of lncEEF1GOE-EVs into a fibrotic 70% partial hepatectomy mouse model, lncEEF1G competitively binds to miR-181a-5p in hepatic stellate cells, preventing the interaction between miR-181a-5p and the messenger RNA of hepatocyte growth factor. This consequently leads to an increase in the secretion of hepatocyte growth factor and the promotion of hepatocyte proliferation.
Engineered mesenchymal stem cells that overexpress lncEEF1G can secrete extracellular vesicles that are rich in lncEEF1G (lncEEF1GOE-EVs). Upon injection of lncEEF1GOE-EVs into a fibrotic 70% partial hepatectomy mouse model, lncEEF1G competitively binds to miR-181a-5p in hepatic stellate cells, preventing the interaction between miR-181a-5p and the messenger RNA of hepatocyte growth factor. This consequently leads to an increase in the secretion of hepatocyte growth factor and the promotion of hepatocyte proliferation.CC BY · PubMed Central
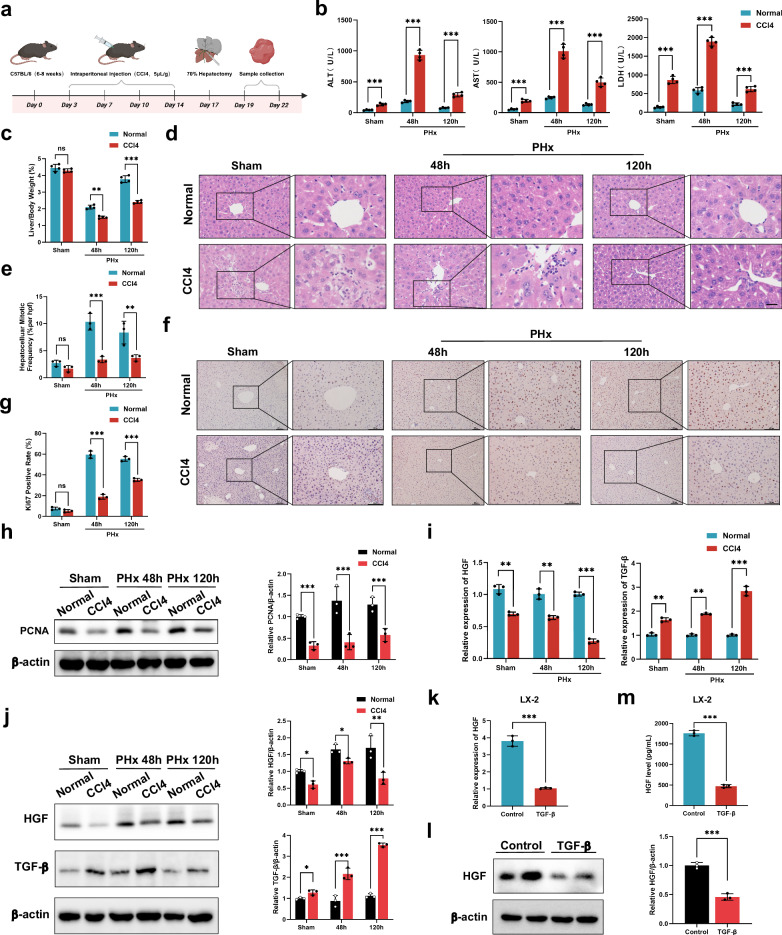
Fig. 1 Liver regeneration is weakened in fibrotic mice. a A schematic diagram of the preparation of a mouse hepatic fibrotic model through CCl4 treatment followed by two-thirds PHx. b Serum ALT, AST and LDH levels at the indicated time points after PHx (n = 4 independent biological mouse samples). c LW/BW ratios at the indicated time points after PHx (n = 4 independent biological mouse samples). d The representative images of H&E-stained samples at the indicated time points after PHx. Scale bar, 50 μm. e A quantification of the mitotic frequency determined by counting the numbers of mitotic nuclei and total nuclei in randomly selected fields (n = 3 independent experiments). f, g The representative images (f) and quantification (g) of Ki67 immunohistochemical staining at the indicated time points after PHx. Scale bar, 100 μm (n = 3 independent experiments). h, Western blotting (left) and relative quantification (right) of PCNA protein expression at the indicated time points after PHx in liver tissues (n = 3 independent biological mouse samples). i RT‒qPCR analysis of the levels of HGF and TGF-β in HSCs isolated from the PHx model (n = 4 independent cell experiments). j Western blotting (left) and relative quantification (right) showing the expression of HGF and TGF-β in HSCs isolated from the PHx model (n = 3 independent experiments). k–m In vitro experiments include: RT‒qPCR analysis of HGF in the LX-2 HSC line (n = 3 independent cell experiments) (k) western blotting (left) and relative quantification (right) showing the expression of HGF in the LX-2 HSC line (n = 3 independent cell experiments) (l) and ELISA results showing the HGF levels in LX-2 HSC line culture medium (n = 3 independent cell experiments) (m). The statistical data are presented as mean ± s.d., and the error bars represent the means of three independent experiments or four independent biological mouse samples. Statistical significance was determined by a Student’s t-test. *P < 0.05, **P < 0.01 and ***P < 0.001. n.s., no significance.
Fig. 1 Liver regeneration is weakened in fibrotic mice. a A schematic diagram of the preparation of a mouse hepatic fibrotic model through CCl4 treatment followed by two-thirds PHx. b Serum ALT, AST and LDH levels at the indicated time points after PHx (n = 4 independent biological mouse samples). c LW/BW ratios at the indicated time points after PHx (n = 4 independent biological mouse samples). d The representative images of H&E-stained samples at the indicated time points after PHx. Scale bar, 50 μm. e A quantification of the mitotic frequency determined by counting the numbers of mitotic nuclei and total nuclei in randomly selected fields (n = 3 independent experiments). f, g The representative images (f) and quantification (g) of Ki67 immunohistochemical staining at the indicated time points after PHx. Scale bar, 100 μm (n = 3 independent experiments). h, Western blotting (left) and relative quantification (right) of PCNA protein expression at the indicated time points after PHx in liver tissues (n = 3 independent biological mouse samples). i RT‒qPCR analysis of the levels of HGF and TGF-β in HSCs isolated from the PHx model (n = 4 independent cell experiments). j Western blotting (left) and relative quantification (right) showing the expression of HGF and TGF-β in HSCs isolated from the PHx model (n = 3 independent experiments). k–m In vitro experiments include: RT‒qPCR analysis of HGF in the LX-2 HSC line (n = 3 independent cell experiments) (k) western blotting (left) and relative quantification (right) showing the expression of HGF in the LX-2 HSC line (n = 3 independent cell experiments) (l) and ELISA results showing the HGF levels in LX-2 HSC line culture medium (n = 3 independent cell experiments) (m). The statistical data are presented as mean ± s.d., and the error bars represent the means of three independent experiments or four independent biological mouse samples. Statistical significance was determined by a Student’s t-test. *P < 0.05, **P < 0.01 and ***P < 0.001. n.s., no significance.CC BY · PubMed Central
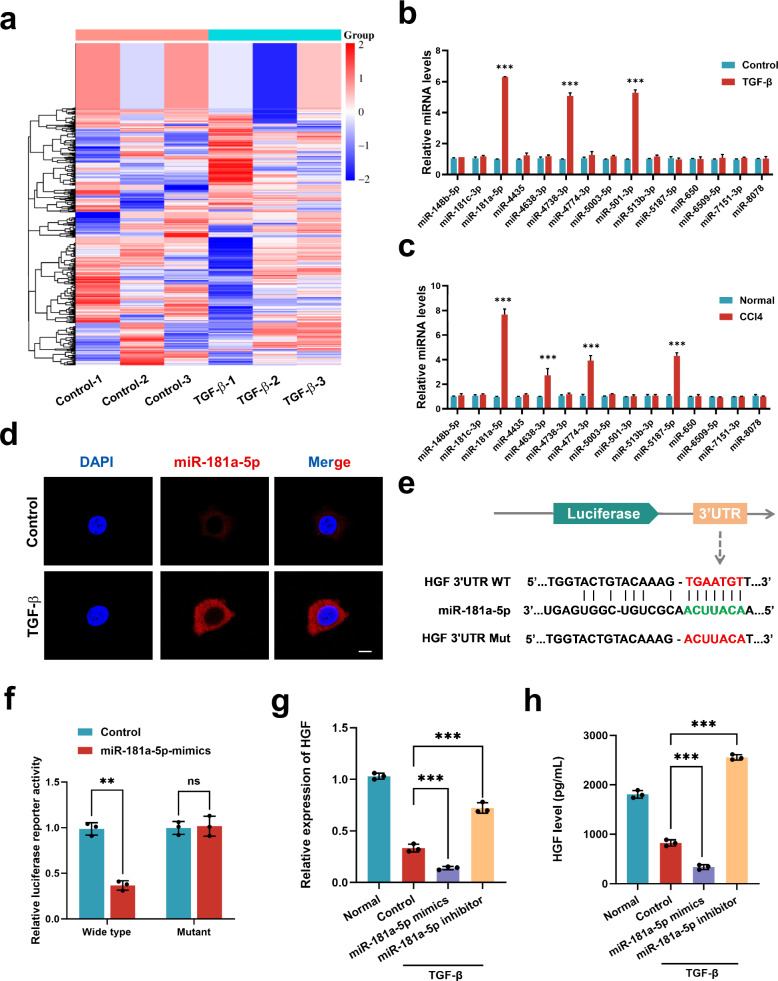
Fig. 2 The upregulation of miR-181a-5p in activated HSCs blocks HGF expression. a A heat map displaying the expression patterns of miRNAs in control and TGF-β-treated HSCs. The upregulated genes are shown in red, and the downregulated genes are shown in blue (n = 3 independent cell samples). b RT‒qPCR results showing the levels of differential miRNA expression in the HSC lines of each group (n = 3 independent cell samples). c RT‒qPCR results showing the levels of differential miRNA expression in the liver tissue of each group (n = 3 independent biological mice samples). d FISH results showing the localization of miR-181a-5p (red) in control and TGF-β-treated HSCs. Scale bar, 20 μm. e A schematic diagram of the construction of luciferase reporter plasmids with mutant and WT HGF sequences. f The luciferase activity of WT and mutant HGFs was detected by luciferase reporter assays after cotransfection with either the miR-181a-5p or control mimics (n = 3 independent experiments). g, h RT‒qPCR (g) and ELISA (h) results showing the levels of HGF in each HSC treatment group (n = 3 independent cell experiments). The statistical data are presented as mean ± s.d., and the error bars represent the means of three independent experiments. Statistical significance was determined by a Student’s t-test. *P < 0.05, **P < 0.01 and ***P < 0.001. n.s., no significance.
Fig. 2 The upregulation of miR-181a-5p in activated HSCs blocks HGF expression. a A heat map displaying the expression patterns of miRNAs in control and TGF-β-treated HSCs. The upregulated genes are shown in red, and the downregulated genes are shown in blue (n = 3 independent cell samples). b RT‒qPCR results showing the levels of differential miRNA expression in the HSC lines of each group (n = 3 independent cell samples). c RT‒qPCR results showing the levels of differential miRNA expression in the liver tissue of each group (n = 3 independent biological mice samples). d FISH results showing the localization of miR-181a-5p (red) in control and TGF-β-treated HSCs. Scale bar, 20 μm. e A schematic diagram of the construction of luciferase reporter plasmids with mutant and WT HGF sequences. f The luciferase activity of WT and mutant HGFs was detected by luciferase reporter assays after cotransfection with either the miR-181a-5p or control mimics (n = 3 independent experiments). g, h RT‒qPCR (g) and ELISA (h) results showing the levels of HGF in each HSC treatment group (n = 3 independent cell experiments). The statistical data are presented as mean ± s.d., and the error bars represent the means of three independent experiments. Statistical significance was determined by a Student’s t-test. *P < 0.05, **P < 0.01 and ***P < 0.001. n.s., no significance.CC BY · PubMed Central
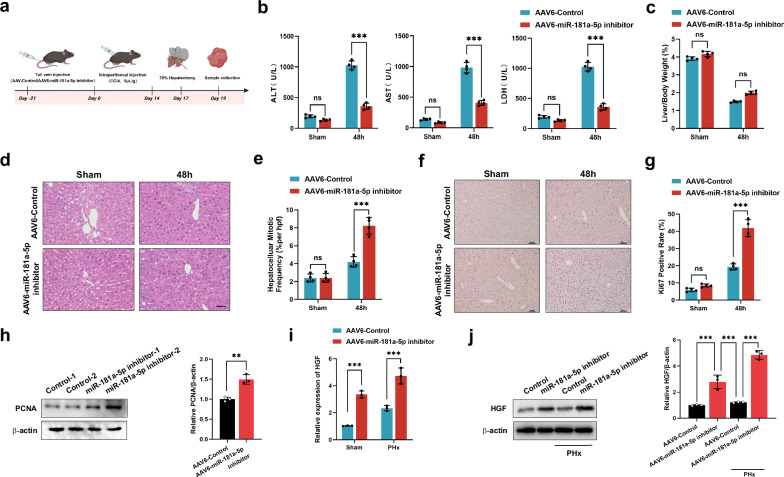
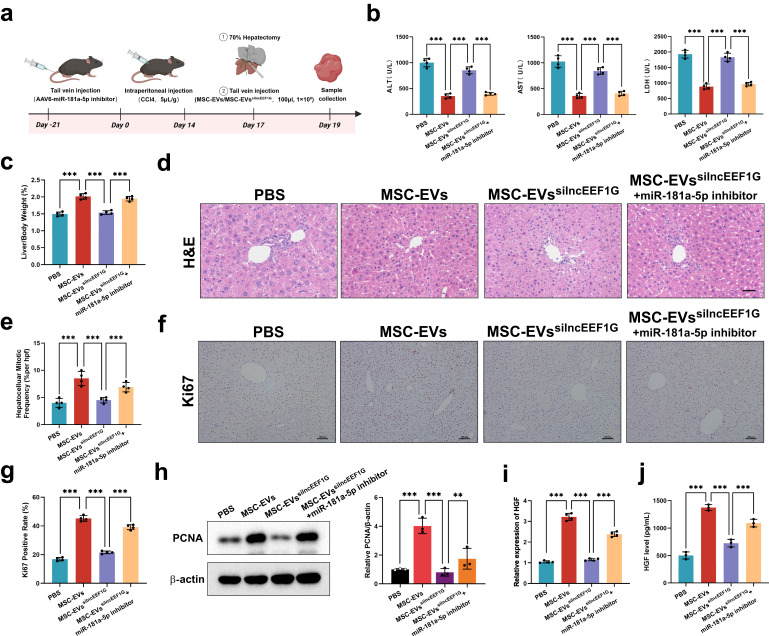
Fig. 3 Blocking miR-181a-5p in HSCs strengthens liver regeneration in fibrotic PHx model mice. a A schematic diagram of the application of an AAV6-miR-181a-5p inhibitor to determine whether miR-181a-5p can modulate the expression of HGF in HSCs and affect the regeneration of the fibrotic liver. b Serum ALT, AST and LDH levels in different treatment groups (n = 4 independent biological mouse samples). c The ratio of LW/BW in different treatment groups (n = 4 independent biological mouse samples). d The representative images of H&E-stained samples from different treatment groups. Scale bar, 50 μm. e A quantification of the mitotic frequency determined by counting the numbers of mitotic nuclei and total nuclei in randomly selected fields (n = 4 independent biological mouse samples). f, g The representative images (f) and quantification (g) of Ki67 immunohistochemical staining in different treatment groups. Scale bar, 100 μm (n = 4 independent biological mouse samples). h Western blotting (left) and relative quantification (right) showing the expression of PCNA in different treatment groups (n = 3 independent experiments). i, j RT‒qPCR (i) and representative western blotting (j, left) results showing the expression of HGF in HSCs isolated from different treatment groups and a quantification of HGF protein levels (j, right) (n = 3 independent experiments). The statistical data are presented as mean ± s.d., and the error bars represent the means of three independent experiments or four independent biological mouse samples. Statistical significance was determined by a Student’s t-test. *P < 0.05, **P < 0.01 and ***P < 0.001. n.s., no significance.
Fig. 3 Blocking miR-181a-5p in HSCs strengthens liver regeneration in fibrotic PHx model mice. a A schematic diagram of the application of an AAV6-miR-181a-5p inhibitor to determine whether miR-181a-5p can modulate the expression of HGF in HSCs and affect the regeneration of the fibrotic liver. b Serum ALT, AST and LDH levels in different treatment groups (n = 4 independent biological mouse samples). c The ratio of LW/BW in different treatment groups (n = 4 independent biological mouse samples). d The representative images of H&E-stained samples from different treatment groups. Scale bar, 50 μm. e A quantification of the mitotic frequency determined by counting the numbers of mitotic nuclei and total nuclei in randomly selected fields (n = 4 independent biological mouse samples). f, g The representative images (f) and quantification (g) of Ki67 immunohistochemical staining in different treatment groups. Scale bar, 100 μm (n = 4 independent biological mouse samples). h Western blotting (left) and relative quantification (right) showing the expression of PCNA in different treatment groups (n = 3 independent experiments). i, j RT‒qPCR (i) and representative western blotting (j, left) results showing the expression of HGF in HSCs isolated from different treatment groups and a quantification of HGF protein levels (j, right) (n = 3 independent experiments). The statistical data are presented as mean ± s.d., and the error bars represent the means of three independent experiments or four independent biological mouse samples. Statistical significance was determined by a Student’s t-test. *P < 0.05, **P < 0.01 and ***P < 0.001. n.s., no significance.CC BY · PubMed Central
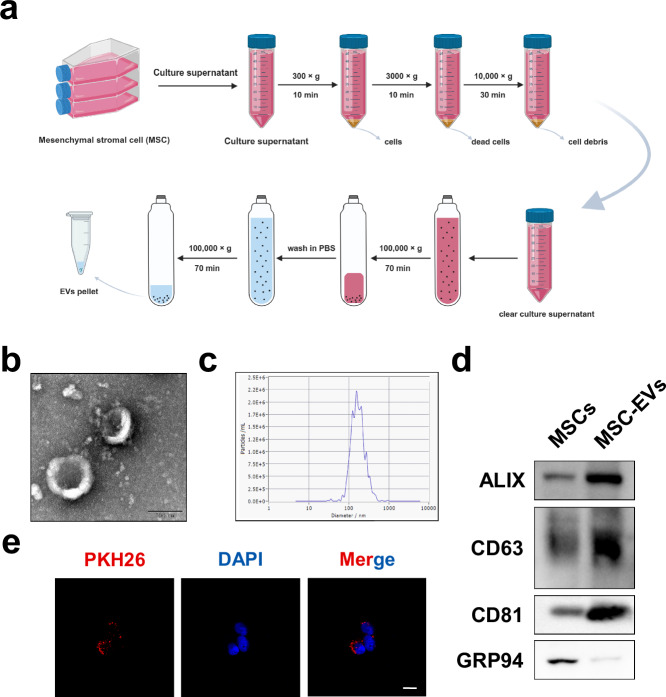
Fig. 4 Characterization of MSC-EVs. a A schematic diagram of the procedures for obtaining MSC-EVs from MSC-conditioned medium. b, c TEM (b) and NTA (c) were used to detect the morphology and size of MSC-EVs. Scale bar, 0.1 μm. d Representative western blotting results showing the expression of specific vesicle-related markers, namely, ALIX, CD63, CD81 and GRP94. e The representative fluorescence images of the uptake of MSC-EVs (fluorescent red) in HSCs were obtained via confocal microscopy. Scale bar, 20 μm.
Fig. 4 Characterization of MSC-EVs. a A schematic diagram of the procedures for obtaining MSC-EVs from MSC-conditioned medium. b, c TEM (b) and NTA (c) were used to detect the morphology and size of MSC-EVs. Scale bar, 0.1 μm. d Representative western blotting results showing the expression of specific vesicle-related markers, namely, ALIX, CD63, CD81 and GRP94. e The representative fluorescence images of the uptake of MSC-EVs (fluorescent red) in HSCs were obtained via confocal microscopy. Scale bar, 20 μm.CC BY · PubMed Central
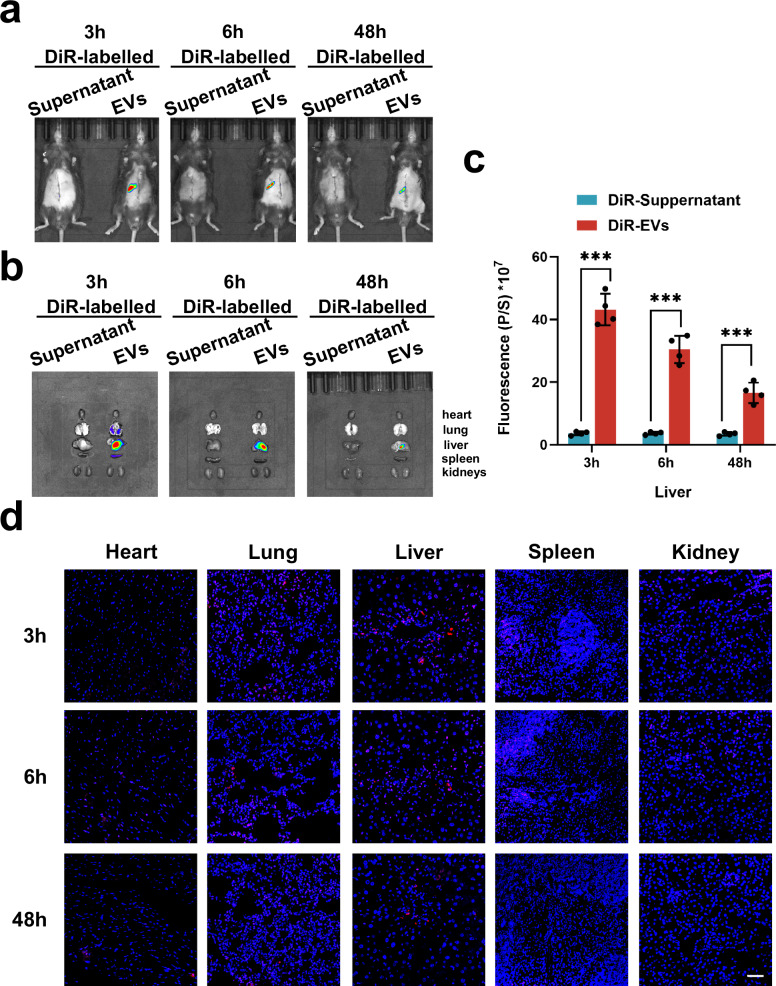
Fig. 5 The biodistribution of MSC-EVs in fibrotic PHx model mice. a The representative in vivo imaging system (IVIS) images of the fibrotic PHx mouse model injected with DiR supernatant-treated control (left) or DiR-labeled MSC-EVs (right) at 3, 6 and 48 h. b Representative IVIS images of organs (from top to bottom: heart, lung, liver, spleen and kidneys) collected at 3, 6 and 48 h. c A quantification of the fluorescence intensity in livers at 3, 6 and 48 h (n = 4 independent biological mouse samples). d The representative fluorescent sections of different organs (heart, lung, liver, spleen and kidneys) used to investigate the biodistribution of DiR-labeled MSC-EVs (red). Scale bar, 50 μm. The statistical data are presented as mean ± s.d., and the error bars represent the means of four independent biological mouse samples. Statistical significance was determined by a Student’s t-test. *P < 0.05, **P < 0.01 and ***P < 0.001.
Fig. 5 The biodistribution of MSC-EVs in fibrotic PHx model mice. a The representative in vivo imaging system (IVIS) images of the fibrotic PHx mouse model injected with DiR supernatant-treated control (left) or DiR-labeled MSC-EVs (right) at 3, 6 and 48 h. b Representative IVIS images of organs (from top to bottom: heart, lung, liver, spleen and kidneys) collected at 3, 6 and 48 h. c A quantification of the fluorescence intensity in livers at 3, 6 and 48 h (n = 4 independent biological mouse samples). d The representative fluorescent sections of different organs (heart, lung, liver, spleen and kidneys) used to investigate the biodistribution of DiR-labeled MSC-EVs (red). Scale bar, 50 μm. The statistical data are presented as mean ± s.d., and the error bars represent the means of four independent biological mouse samples. Statistical significance was determined by a Student’s t-test. *P < 0.05, **P < 0.01 and ***P < 0.001.CC BY · PubMed Central
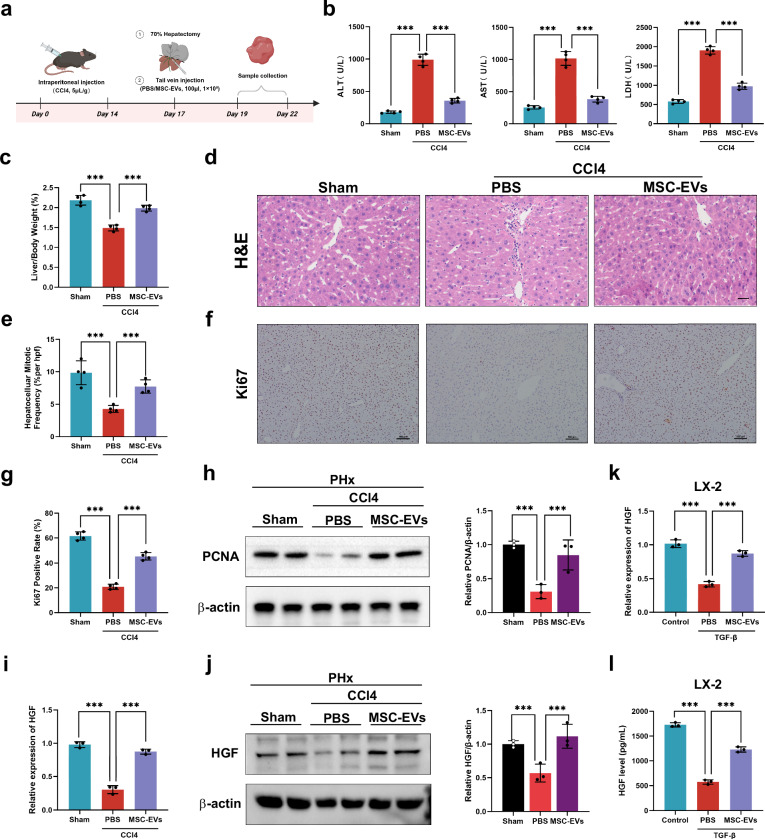
Fig. 6 MSC-EVs promote fibrotic liver regeneration via the upregulation of HGF expression in HSCs. a A schematic diagram of the application of MSC-EVs to determine whether MSC-EVs can stimulate the regeneration of the fibrotic liver. b The serum ALT, AST and LDH levels in different treatment groups (n = 4 independent biological mouse samples). c The LW/BW ratio in different treatment groups (n = 4 independent biological mouse samples). d The representative images of H&E-stained samples from different treatment groups. Scale bar, 50 μm). e A quantification of the mitotic frequency determined by counting the numbers of mitotic nuclei and total nuclei in randomly selected fields (n = 4 independent biological mouse samples). f, g The representative images (f) and quantification (g) of Ki67 immunohistochemical staining in different treatment groups. Scale bar, 100 μm (n = 4 independent biological mouse samples). h Western blotting (left) and relative quantification (right) showing the expression of PCNA in different treatment groups (n = 3 independent experiments). i, j RT‒qPCR (i) and representative western blotting (j, left) results showing the expression of HGF in HSCs isolated from different treatment groups and a quantification of HGF protein levels (j, right) (n = 3 independent experiments). In vitro experiments including LX-2 HSCs treated with TGF-β were given PBS or MSC-EVs. k, l RT‒qPCR (k) and ELISA (l) were used to measure the HGF level in the LX-2 HSC line (n = 3 independent cell experiments). The statistical data are presented as mean ± s.d., and the error bars represent the means of three independent experiments or four independent biological mouse samples. Statistical significance was determined by a Student’s t-test. *P < 0.05, **P < 0.01 and ***P < 0.001.
Fig. 6 MSC-EVs promote fibrotic liver regeneration via the upregulation of HGF expression in HSCs. a A schematic diagram of the application of MSC-EVs to determine whether MSC-EVs can stimulate the regeneration of the fibrotic liver. b The serum ALT, AST and LDH levels in different treatment groups (n = 4 independent biological mouse samples). c The LW/BW ratio in different treatment groups (n = 4 independent biological mouse samples). d The representative images of H&E-stained samples from different treatment groups. Scale bar, 50 μm). e A quantification of the mitotic frequency determined by counting the numbers of mitotic nuclei and total nuclei in randomly selected fields (n = 4 independent biological mouse samples). f, g The representative images (f) and quantification (g) of Ki67 immunohistochemical staining in different treatment groups. Scale bar, 100 μm (n = 4 independent biological mouse samples). h Western blotting (left) and relative quantification (right) showing the expression of PCNA in different treatment groups (n = 3 independent experiments). i, j RT‒qPCR (i) and representative western blotting (j, left) results showing the expression of HGF in HSCs isolated from different treatment groups and a quantification of HGF protein levels (j, right) (n = 3 independent experiments). In vitro experiments including LX-2 HSCs treated with TGF-β were given PBS or MSC-EVs. k, l RT‒qPCR (k) and ELISA (l) were used to measure the HGF level in the LX-2 HSC line (n = 3 independent cell experiments). The statistical data are presented as mean ± s.d., and the error bars represent the means of three independent experiments or four independent biological mouse samples. Statistical significance was determined by a Student’s t-test. *P < 0.05, **P < 0.01 and ***P < 0.001.CC BY · PubMed Central
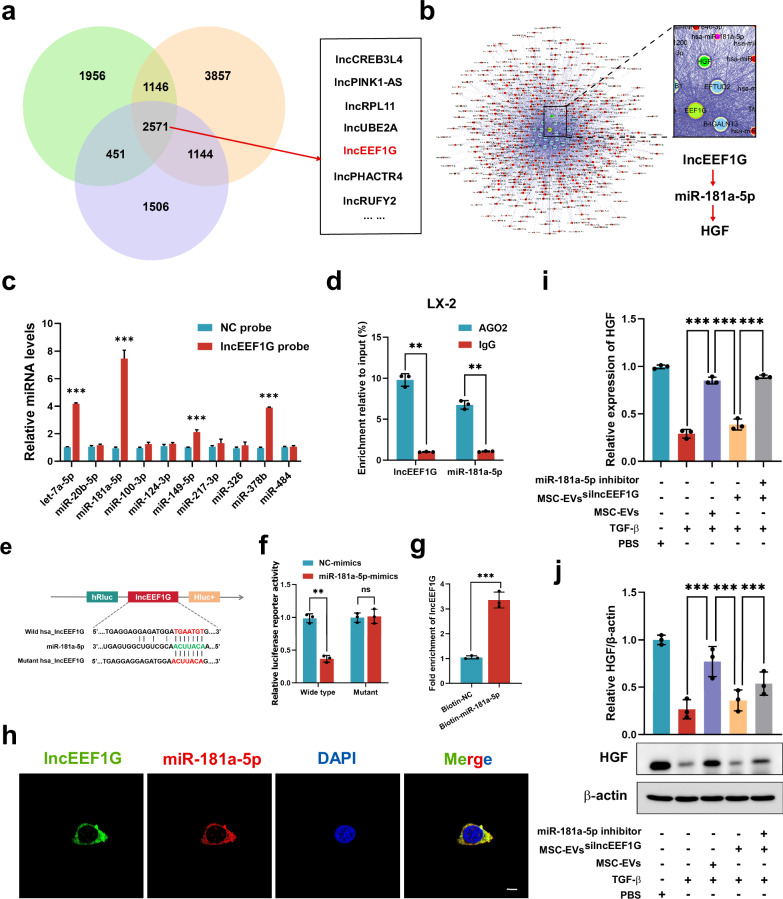
Fig. 7 LncEEF1G derived from MSC-EVs upregulates HGF expression in HSCs by acting as a sponge to target miR-181a-5p. a A Venn diagram showing lncRNAs from three independent samples of MSC-EVs obtained through whole-transcriptome sequencing analysis. b Bioinformatic analysis revealing that lncEEF1G acts as a miRNA sponge for miR-181a-5p in HSCs. c RT‒qPCR analysis of the miRNAs (let-7a-5p, miR-20b-5p, miR-100-3p, miR-124-3p, miR-149-5p, miR-217-3p, miR-326, miR-378b, miR-484 and miR-181a-5p) that potentially interact with lncEEF1G (n = 3 independent cell experiments). d A RIP assay was conducted to confirm the interaction between lncEEF1G and miR-181a-5p (n = 3 independent cell experiments). e The RNAalifold online database was used to predict the site at which lncEEF1G binds to miR-181a-5p for further mutation. f The luciferase activity of WT and mutant lncEEF1G was detected by luciferase reporter assays after cotransfection with either miR-181a-5p mimics or control mimics (n = 3 independent cell experiments). g A biotin-labeled miR-181a-5p probe was used to confirm that lncEEF1G could be captured by miR-181a-5p (n = 3 independent cell experiments). h FISH results showing the localization of lncEEF1G (green) and miR-181a-5p (red) in HSCs. Scale bar, 20 μm. For HSCs, PBS, TGF-β, TGF-β + MSC-EVs, TGF-β + MSC-EVssilncEEF1G or TGF-β + MSC-EVssilncEEF1G + miR-181a-5p were added to each group. This finding further verified that lncEEF1G in MSC-EVs regulates HGF levels by interacting with miR-181a-5p. i, j RT‒qPCR (i) and representative western blotting (j, upper) results showing the expression of HGF in HSCs in different treatment groups and a quantification (j, down) of HGF protein levels (n = 3 independent cell experiments). The statistical data are presented as mean ± s.d., and the error bars represent the means of three independent experiments. Statistical significance was determined by a Student’s t-test. *P < 0.05, **P < 0.01 and ***P < 0.001. n.s., no significance.
Fig. 7 LncEEF1G derived from MSC-EVs upregulates HGF expression in HSCs by acting as a sponge to target miR-181a-5p. a A Venn diagram showing lncRNAs from three independent samples of MSC-EVs obtained through whole-transcriptome sequencing analysis. b Bioinformatic analysis revealing that lncEEF1G acts as a miRNA sponge for miR-181a-5p in HSCs. c RT‒qPCR analysis of the miRNAs (let-7a-5p, miR-20b-5p, miR-100-3p, miR-124-3p, miR-149-5p, miR-217-3p, miR-326, miR-378b, miR-484 and miR-181a-5p) that potentially interact with lncEEF1G (n = 3 independent cell experiments). d A RIP assay was conducted to confirm the interaction between lncEEF1G and miR-181a-5p (n = 3 independent cell experiments). e The RNAalifold online database was used to predict the site at which lncEEF1G binds to miR-181a-5p for further mutation. f The luciferase activity of WT and mutant lncEEF1G was detected by luciferase reporter assays after cotransfection with either miR-181a-5p mimics or control mimics (n = 3 independent cell experiments). g A biotin-labeled miR-181a-5p probe was used to confirm that lncEEF1G could be captured by miR-181a-5p (n = 3 independent cell experiments). h FISH results showing the localization of lncEEF1G (green) and miR-181a-5p (red) in HSCs. Scale bar, 20 μm. For HSCs, PBS, TGF-β, TGF-β + MSC-EVs, TGF-β + MSC-EVssilncEEF1G or TGF-β + MSC-EVssilncEEF1G + miR-181a-5p were added to each group. This finding further verified that lncEEF1G in MSC-EVs regulates HGF levels by interacting with miR-181a-5p. i, j RT‒qPCR (i) and representative western blotting (j, upper) results showing the expression of HGF in HSCs in different treatment groups and a quantification (j, down) of HGF protein levels (n = 3 independent cell experiments). The statistical data are presented as mean ± s.d., and the error bars represent the means of three independent experiments. Statistical significance was determined by a Student’s t-test. *P < 0.05, **P < 0.01 and ***P < 0.001. n.s., no significance.CC BY · PubMed Central
Fig. 8 LncEEF1G derived from MSC-EVs strengthens liver regeneration in fibrotic PHx model mice. a A schematic diagram of the application of MSC-EVssilncEEF1G to determine whether the ability of MSC-EVs to stimulate fibrotic liver regeneration depends on the direct interaction of lncEEF1G with miR-181a-5p to modulate HGF expression in HSCs. b Serum ALT, AST and LDH levels in different treatment groups (n = 4 independent biological mouse samples). c The LW/BW ratio in different treatment groups (n = 4 independent biological mouse samples). d The representative images of H&E-stained samples from different treatment groups. Scale bar, 50 μm). e A quantification of the mitotic frequency determined by counting the numbers of mitotic nuclei and total nuclei in randomly selected fields (n = 4 independent biological mouse samples). f, g The representative images (f) and quantification (g) of Ki67 immunohistochemical staining in different treatment groups. Scale bar, 100 μm (n = 4 independent biological mouse samples). h Western blotting (left) and relative quantification (right) showing the expression of PCNA in different treatment groups (n = 3 independent experiments). i, j RT‒qPCR (i) and ELISA (j) results showing the HGF levels of primary HSCs from each group (RT‒qPCR, n = 4 independent cell experiments; ELISA, n = 3 independent cell experiments). The statistical data are presented as mean ± s.d., and the error bars represent the means of three independent experiments or four independent biological mouse samples. Statistical significance was determined by a Student’s t-test. *P < 0.05, **P < 0.01 and ***P < 0.001.
Fig. 8 LncEEF1G derived from MSC-EVs strengthens liver regeneration in fibrotic PHx model mice. a A schematic diagram of the application of MSC-EVssilncEEF1G to determine whether the ability of MSC-EVs to stimulate fibrotic liver regeneration depends on the direct interaction of lncEEF1G with miR-181a-5p to modulate HGF expression in HSCs. b Serum ALT, AST and LDH levels in different treatment groups (n = 4 independent biological mouse samples). c The LW/BW ratio in different treatment groups (n = 4 independent biological mouse samples). d The representative images of H&E-stained samples from different treatment groups. Scale bar, 50 μm). e A quantification of the mitotic frequency determined by counting the numbers of mitotic nuclei and total nuclei in randomly selected fields (n = 4 independent biological mouse samples). f, g The representative images (f) and quantification (g) of Ki67 immunohistochemical staining in different treatment groups. Scale bar, 100 μm (n = 4 independent biological mouse samples). h Western blotting (left) and relative quantification (right) showing the expression of PCNA in different treatment groups (n = 3 independent experiments). i, j RT‒qPCR (i) and ELISA (j) results showing the HGF levels of primary HSCs from each group (RT‒qPCR, n = 4 independent cell experiments; ELISA, n = 3 independent cell experiments). The statistical data are presented as mean ± s.d., and the error bars represent the means of three independent experiments or four independent biological mouse samples. Statistical significance was determined by a Student’s t-test. *P < 0.05, **P < 0.01 and ***P < 0.001.CC BY · PubMed Central
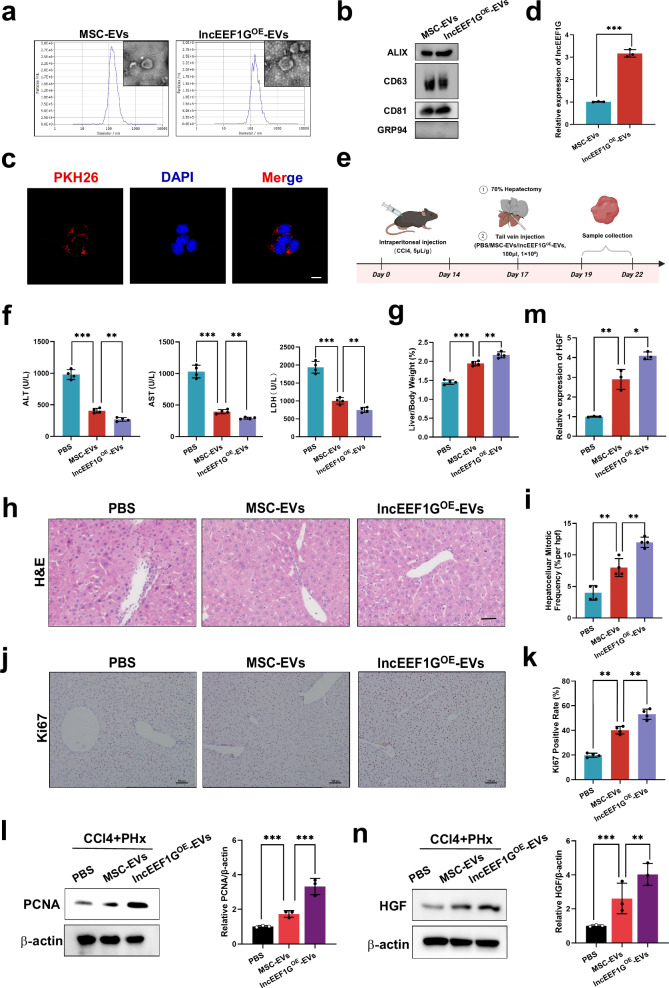
Fig. 9 Engineered MSC-EVs with high lncEEF1G expression further upregulate HGF expression in HSCs to stimulate fibrotic liver regeneration. a TEM and NTA were used to detect the morphology and size of the MSC-EVs and lncEEF1GOE-EVs. Scale bar, 0.1 μm. b Representative western blots of specific vesicle-related markers (ALIX, CD63, CD81 and GRP94). c Representative fluorescence images of the uptake of lncEEF1GOE-EVs (fluorescent red) in HSCs were obtained via confocal microscopy. Scale bar, 20 μm). d RT‒qPCR showing the expression of lncEEF1G in MSC-EVs and lncEEF1GOE-EVs. e A schematic diagram of the application of lncEEF1GOE-EVs to detect whether lncEEF1GOE-EVs stimulate fibrotic liver regeneration. f Serum ALT, AST and LDH levels in different treatment groups (n = 4 independent biological mouse samples). g The LW/BW ratio in different treatment groups (n = 4 independent biological mouse samples). h The representative images of H&E-stained samples from different treatment groups. Scale bar, 50 μm). i A quantification of the mitotic frequency determined by counting the numbers of mitotic nuclei and total nuclei in randomly selected fields (n = 4 independent biological mouse samples). j, k The representative images (j) and quantification (k) of Ki67 immunohistochemical staining in different treatment groups. Scale bar, 100 μm (n = 4 independent biological mouse samples). l Western blotting (left) and relative quantification (right) showing the expression of PCNA in liver samples subjected to different treatments (n = 3 independent experiments). m, n RT‒qPCR (m) and representative western blotting (n, left) results showing the expression of HGF in HSCs isolated from different treatment groups and a quantification (n, right) of HGF protein levels (n = 3 independent experiments). The statistical data are presented as mean ± s.d., and the error bars represent the means of three independent experiments or four independent biological mouse samples. Statistical significance was determined by a Student’s t-test. *P < 0.05, **P < 0.01 and ***P < 0.001.
Fig. 9 Engineered MSC-EVs with high lncEEF1G expression further upregulate HGF expression in HSCs to stimulate fibrotic liver regeneration. a TEM and NTA were used to detect the morphology and size of the MSC-EVs and lncEEF1GOE-EVs. Scale bar, 0.1 μm. b Representative western blots of specific vesicle-related markers (ALIX, CD63, CD81 and GRP94). c Representative fluorescence images of the uptake of lncEEF1GOE-EVs (fluorescent red) in HSCs were obtained via confocal microscopy. Scale bar, 20 μm). d RT‒qPCR showing the expression of lncEEF1G in MSC-EVs and lncEEF1GOE-EVs. e A schematic diagram of the application of lncEEF1GOE-EVs to detect whether lncEEF1GOE-EVs stimulate fibrotic liver regeneration. f Serum ALT, AST and LDH levels in different treatment groups (n = 4 independent biological mouse samples). g The LW/BW ratio in different treatment groups (n = 4 independent biological mouse samples). h The representative images of H&E-stained samples from different treatment groups. Scale bar, 50 μm). i A quantification of the mitotic frequency determined by counting the numbers of mitotic nuclei and total nuclei in randomly selected fields (n = 4 independent biological mouse samples). j, k The representative images (j) and quantification (k) of Ki67 immunohistochemical staining in different treatment groups. Scale bar, 100 μm (n = 4 independent biological mouse samples). l Western blotting (left) and relative quantification (right) showing the expression of PCNA in liver samples subjected to different treatments (n = 3 independent experiments). m, n RT‒qPCR (m) and representative western blotting (n, left) results showing the expression of HGF in HSCs isolated from different treatment groups and a quantification (n, right) of HGF protein levels (n = 3 independent experiments). The statistical data are presented as mean ± s.d., and the error bars represent the means of three independent experiments or four independent biological mouse samples. Statistical significance was determined by a Student’s t-test. *P < 0.05, **P < 0.01 and ***P < 0.001.CC BY · PubMed Central

Verification

Claims the paper makes

The claims and statistics of this paper haven’t been checked yet.

Run the check — free, no account needed. It reads the open-access text and checks the sources it cites.

A few free checks a day · papers already verified open instantly · results are public

Claims other papers make about this one

Each is checked against this paper’s own text: does it say what the citing paper says it does?

Self-check

Percentages, sums and reported differences re-computed from the paper’s own numbers.

The self-check needs the paper’s full text.

Citations

Cites

Show all 1 references

Research works printed but not linked: 46

  1. Wen, Y. et al. Interleukin-33 facilitates liver regeneration through serotonin-involved gut-liver axis. Hepatology 77, 1580–1592 (2023). · DOI · Paper page
  2. Yang, H. Y. & He, Z. Mechanism of hepatocytes differentiation and dedifferentiation in liver regeneration: process and exploration. Hepatobiliary Pancreat. Dis. Int. 22, 331–332 (2023). · DOI
  3. Lee, Y. A., Wallace, M. C. & Friedman, S. L. Pathobiology of liver fibrosis: a translational success story. Gut 64, 830–841 (2015). · DOI
  4. Chen, H. et al. Targeting Nestin+ hepatic stellate cells ameliorates liver fibrosis by facilitating TbetaRI degradation. J. Hepatol. 74, 1176–1187 (2021). · DOI
  5. Zheng, J. et al. Preconditioning of umbilical cord-derived mesenchymal stem cells by rapamycin increases cell migration and ameliorates liver ischaemia/reperfusion injury in mice via the CXCR4/CXCL12 axis. Cell Prolif. 52, e12546 (2019). · DOI
  6. Lv, H. et al. Heat shock preconditioning mesenchymal stem cells attenuate acute lung injury via reducing NLRP3 inflammasome activation in macrophages. Stem Cell Res. Ther. 12, 290 (2021). · DOI
  7. Li, S. et al. Mesenchymal stem cells ameliorate hepatic ischemia/reperfusion injury via inhibition of neutrophil recruitment. J. Immunol. Res. 2018, 7283703 (2018). · DOI
  8. Zheng, J. et al. MSCs ameliorate hepatocellular apoptosis mediated by PINK1-dependent mitophagy in liver ischemia/reperfusion injury through AMPKalpha activation. Cell Death Dis. 11, 256 (2020). · DOI
  9. Zheng, J. et al. Extracellular vesicles derived from human umbilical cord mesenchymal stem cells protect liver ischemia/reperfusion injury by reducing CD154 expression on CD4+ T cells via CCT2. Adv. Sci. 7, 1903746 (2020). · DOI
  10. Lu, T. et al. Extracellular vesicles derived from mesenchymal stromal cells as nanotherapeutics for liver ischaemia-reperfusion injury by transferring mitochondria to modulate the formation of neutrophil extracellular traps. Biomaterials 284, 121486 (2022). · DOI
  11. Yao, J. et al. Extracellular vesicles derived from human umbilical cord mesenchymal stem cells alleviate rat hepatic ischemia-reperfusion injury by suppressing oxidative stress and neutrophil inflammatory response. FASEB J. 33, 1695–1710 (2019). · DOI
  12. Zhang, J. et al. MSC-derived extracellular vesicles as nanotherapeutics for promoting aged liver regeneration. J. Control Release 356, 402–415 (2023). · DOI · Paper page
  13. Lin, Y. et al. Huc-MSC-derived exosomes modified with the targeting peptide of aHSCs for liver fibrosis therapy. J. Nanobiotechnol. 20, 432 (2022). · DOI · Paper page
  14. Zhang, Z. et al. Exosomes derived from human adipose mesenchymal stem cells amelioratehepatic fibrosis by inhibiting PI3K/Akt/mTOR pathway and remodeling choline metabolism. J Nanobiotechnol 21, 29 (2023). · DOI
  15. Mederacke, I., Dapito, D. H., Affo, S., Uchinami, H. & Schwabe, R. F. High-yield and high-purity isolation of hepatic stellate cells from normal and fibrotic mouse livers. Nat. Protoc. 10, 305–315 (2015). · DOI
  16. Zheng, J. et al. CircFOXK2 promotes hepatocellular carcinoma progression and leads to a poor clinical prognosis via regulating the Warburg effect. J. Exp. Clin. Cancer Res. 42, 63 (2023). · DOI
  17. Michalopoulos, G. K. & DeFrances, M. C. Liver regeneration. Science 276, 60–66 (1997). · DOI · Paper page
  18. Michalopoulos, G. K. Principles of liver regeneration and growth homeostasis. Compr. Physiol. 3, 485–513 (2013). · DOI
  19. Tsuchida, T. & Friedman, S. L. Mechanisms of hepatic stellate cell activation. Nat. Rev. Gastroenterol. Hepatol. 14, 397–411 (2017). · DOI · Paper page
  20. Zhou, L. et al. miR-185 inhibits fibrogenic activation of hepatic stellate cells and prevents liver fibrosis. Mol. Ther. Nucleic Acids 10, 91–102 (2018). · DOI
  21. Chen, J. et al. MicroRNA-30a ameliorates hepatic fibrosis by inhibiting Beclin1-mediated autophagy. J. Cell Mol. Med. 21, 3679–3692 (2017). · DOI
  22. Li, J. et al. miR-122 regulates collagen production via targeting hepatic stellate cells and suppressing P4HA1 expression. J. Hepatol. 58, 522–528 (2013). · DOI
  23. Wang, Q. et al. MicroRNA-98 inhibits hepatic stellate cell activation and attenuates liver fibrosis by regulating HLF expression. Front. Cell Dev. Biol. 8, 513 (2020). · DOI
  24. Yu, F. et al. Loss of lncRNA-SNHG7 promotes the suppression of hepatic stellate cell activation via miR-378a-3p and DVL2. Mol. Ther. Nucleic Acids 17, 235–244 (2019). · DOI
  25. Ma, L. et al. MicroRNA-214 promotes hepatic stellate cell activation and liver fibrosis by suppressing Sufu expression. Cell Death Dis. 9, 718 (2018). · DOI
  26. Wang, H. et al. miRNA-130b-5p promotes hepatic stellate cell activation and the development of liver fibrosis by suppressing SIRT4 expression. J. Cell Mol. Med. 25, 7381–7394 (2021). · DOI
  27. Guo, C. J., Pan, Q., Li, D. G., Sun, H. & Liu, B. W. miR-15b and miR-16 are implicated in activation of the rat hepatic stellate cell: An essential role for apoptosis. J. Hepatol. 50, 766–778 (2009). · DOI
  28. Zhang, L. X. et al. The circular RNA circHMGB2 drives immunosuppression and anti-PD-1 resistance in lung adenocarcinomas and squamous cell carcinomas via the miR-181a-5p/CARM1 axis. Mol. Cancer 21, 110 (2022). · DOI
  29. Li, Y. et al. miR-181a-5p Inhibits cancer cell migration and angiogenesis via downregulation of matrix metalloproteinase-14. Cancer Res. 75, 2674–2685 (2015). · DOI
  30. Zhang, S., Wan, H. & Zhang, X. LncRNA LHFPL3-AS1 contributes to tumorigenesis of melanoma stem cells via the miR-181a-5p/BCL2 pathway. Cell Death Dis. 11, 950 (2020). · DOI
  31. Bi, J. G. et al. MicroRNA-181a-5p suppresses cell proliferation by targeting Egr1 and inhibiting Egr1/TGF-beta/Smad pathway in hepatocellular carcinoma. Int. J. Biochem. Cell Biol. 106, 107–116 (2019). · DOI
  32. Zhai, Z. et al. MiR-181a-5p facilitates proliferation, invasion, and glycolysis of breast cancer through NDRG2-mediated activation of PTEN/AKT pathway. Bioengineered 13, 83–95 (2022). · DOI
  33. Egyed, B. et al. MicroRNA-181a as novel liquid biopsy marker of central nervous system involvement in pediatric acute lymphoblastic leukemia. J. Transl. Med. 18, 250 (2020). · DOI
  34. Mi, Y. et al. miR-181a-5p promotes the progression of gastric cancer via RASSF6-mediated MAPK signalling activation. Cancer Lett. 389, 11–22 (2017). · DOI
  35. Zhu, H. et al. The interaction of miR-181a-5p and sirtuin 1 regulated human bone marrow mesenchymal stem cells differentiation and apoptosis. Bioengineered 12, 1426–1435 (2021). · DOI
  36. Constanso-Conde, I. et al. Circulating miR-181a-5p as a new biomarker for acute cellular rejection in heart transplantation. J. Heart Lung Transplant. 39, 1100–1108 (2020). · DOI
  37. Wu, K. et al. Transcription Factor YY1 ameliorates liver ischemia-reperfusion injury through modulating the miR-181a-5p/ESR1/ERBB2 axis. Transplantation 107, 878–889 (2023). · DOI
  38. Wang, Y., Mou, Q., Zhu, Z., Zhao, L. & Zhu, L. MALAT1 promotes liver fibrosis by sponging miR‑181a and activating TLR4‑NF‑kappaB signaling. Int. J. Mol. Med. 48, 215 (2021). · DOI
  39. Liu, R. et al. Cholangiocyte-derived exosomal long noncoding RNA H19 promotes hepatic stellate cell activation and cholestatic liver fibrosis. Hepatology 70, 1317–1335 (2019). · DOI
  40. Zheng, J. et al. lincRNA-p21 inhibits hepatic stellate cell activation and liver fibrogenesis via p21. FEBS J. 282, 4810–4821 (2015). · DOI
  41. Dong, Z. et al. lncRNA GAS5 restrains CCl(4)-induced hepatic fibrosis by targeting miR-23a through the PTEN/PI3K/Akt signaling pathway. Am. J. Physiol. Gastrointest. Liver Physiol. 316, G539–G550 (2019). · DOI
  42. Palacios, G. et al. Novel ALK fusion in anaplastic large cell lymphoma involving EEF1G, a subunit of the eukaryotic elongation factor-1 complex. Leukemia 31, 743–747 (2017). · DOI
  43. Mayourian, J. et al. Exosomal microRNA-21-5p mediates mesenchymal stem cell paracrine effects on human cardiac tissue contractility. Circ Res 122, 933–944 (2018). · DOI
  44. Hirai, K. et al. Cardiosphere-derived exosomal microRNAs for myocardial repair in pediatric dilated cardiomyopathy. Sci. Transl. Med. 12, eabb3336 (2020). · DOI
  45. Xu, F. et al. Engineered extracellular vesicles with SHP2 high expression promote mitophagy for Alzheimer’s disease Treatment. Adv Mater 34, e2207107 (2022). · DOI
  46. Zhu, W. et al. Exosomes derived from mir-214-3p overexpressing mesenchymal stem cells promote myocardial repair. Biomater. Res. 27, 77 (2023). · DOI

Cited by

Sorted by citations

Metadata

Authors
Zhang, J., Qiu, X., Lei, Y., Chen, H., Wu, D., Wang, T., Sui, X., Xiao, J., Jiang, C., Zhang, H., Liu, Y., Liu, X., Zhang, Y., Che, X., Lin, Y., Yao, J., Pan, Z., Li, R., & Zheng, J.
Affiliations
  • Third Affiliated Hospital of Sun Yat-sen University (CN)
  • Chinese Academy of Medical Sciences & Peking Union Medical College (CN)
  • Guangdong Academy of Medical Sciences (CN)
Corresponding author
  • Yao, Jia
  • Pan, Zihao
  • Li, Rong
  • Zheng, Jun
Venue
Experimental & Molecular Medicine
Published
2025-03-03
Volume
57
Issue
3
Pages
584-600
ISSN
  • 1226-3613 (ISSN-L)
  • 2092-6413
OpenAlex
W4408082218
Cited by
16
References
1
Citations by year
2026: 12 · 2025: 4
FWCI
4.81
Type
journal article
Language
en
Open access
Locations
  • Experimental & Molecular Medicine (publishedVersion, cc-by)
  • Research Square (acceptedVersion, cc-by)
  • Europe PMC (PubMed Central) (publishedVersion, cc-by)
  • PubMed Central (publishedVersion, cc-by)
  • PubMed (publishedVersion)
  • DOAJ (DOAJ: Directory of Open Access Journals) (submittedVersion, cc-by-sa)
Funders
  • National Natural Science Foundation of China (81900597, 2021A1515011156, 202102020237, 82300747, 81970567, 81802897)
  • Sun Yat-sen University
  • China Postdoctoral Science Foundation (2022M713621, 2022M713617)
  • Natural Science Foundation of Guangdong Province (202102020237, 2021A1515011156, 2021A1515010571, 2023A1515030052, 2021A1515012136, 81802897, 2023A1515010346)
  • National Key Research and Development Program of China (2022YFA1104903)
  • Basic and Applied Basic Research Foundation of Guangdong Province (2021A1515111058, 202102020237)
Topics
  • Life Sciences › Biochemistry, Genetics and Molecular Biology › Molecular Biology › Extracellular vesicles in disease
  • Health Sciences › Medicine › Hepatology › Liver physiology and pathology
  • Life Sciences › Biochemistry, Genetics and Molecular Biology › Cell Biology › Mesenchymal stem cell research
Keywords
liver fibrosis, liver regeneration, mesenchymal stem cell-derived extracellular vesicles, miR-181a-5p, hepatocyte growth factor, hepatic stellate cells, competing endogenous RNA, microRNA sponging, AAV6, partial hepatectomy, nanotherapeutics
MeSH terms
Extracellular Vesicles, Animals, Disease Models, Animal, Humans, Liver Cirrhosis, Liver Regeneration, Male, Mice, Inbred C57BL, Up-Regulation, Hepatocyte Growth Factor, MicroRNAs, Mice, Hepatic Stellate Cells, Mesenchymal Stem Cells, RNA, Long Noncoding

About these checks

Registry, retraction, Cites and statistics results are computed, not judged, with one exception: a printed reference that no index lists is read once by a model before it counts as a citation error. Claims are extracted by a model and kept only when their quote appears verbatim in the text; each cited source is then checked, with a model’s help, for whether it says what the claim relies on. Those verdicts can be wrong — read the claim’s quote and the cited source before relying on one.

Statistics and arithmetic are recomputed, not judged.

Confidence bands are shown only for fields calibrated on our annotated test set. None is calibrated yet, so no band is shown.

What counts as a claim ›How we measure confidence ›How we check this ›

Are you an author, or do you see a problem with this page? Request a review