

The DOI matches its Crossref record; the references it cites are not checked yet.
Toward optical coherence tomography on a chip: in vivo three-dimensional human retinal imaging using photonic integrated circuit-based arrayed waveguide gratings
Open accessAbstract
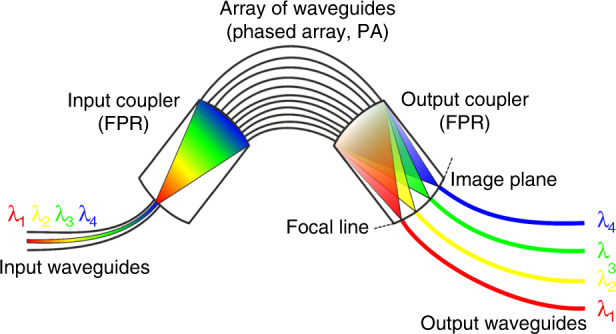
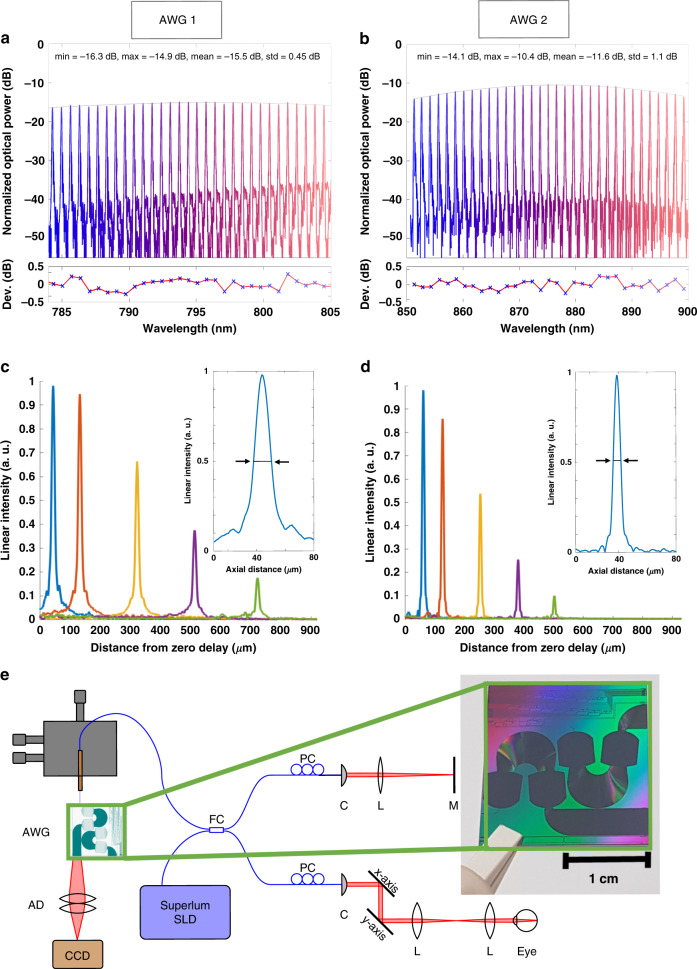
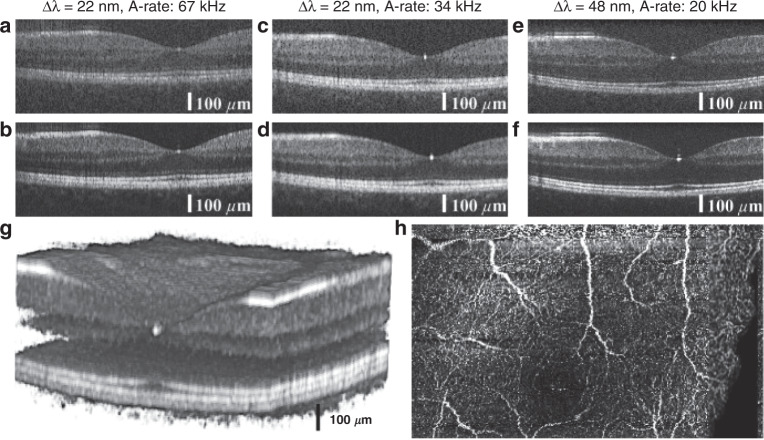
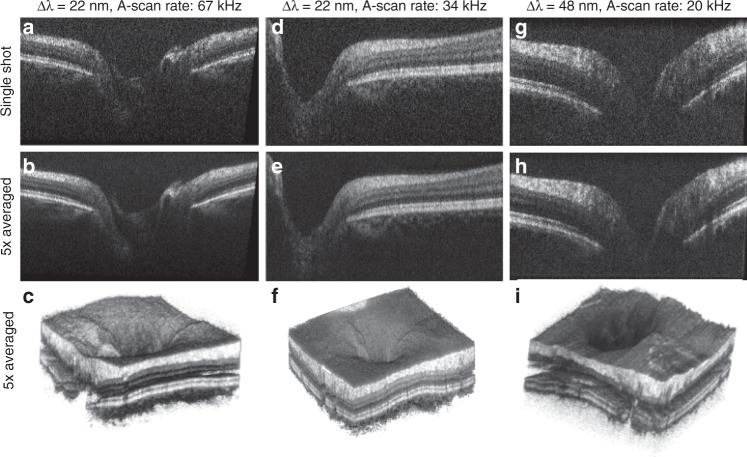
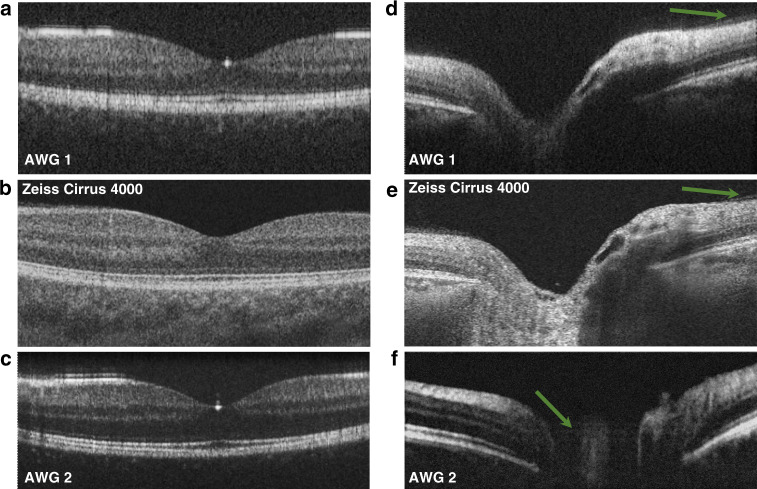
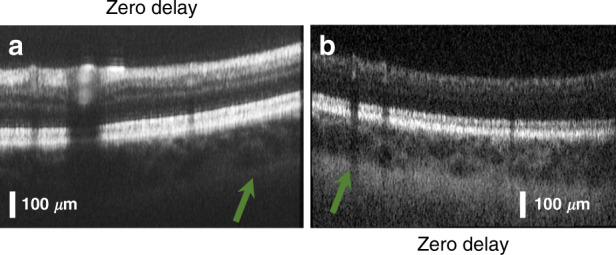
In this work, we present a significant step toward in vivo ophthalmic optical coherence tomography and angiography on a photonic integrated chip. The diffraction gratings used in spectral-domain optical coherence tomography can be replaced by photonic integrated circuits comprising an arrayed waveguide grating. Two arrayed waveguide grating designs with 256 channels were tested, which enabled the first chip-based optical coherence tomography and angiography in vivo three-dimensional human retinal measurements. Design 1 supports a bandwidth of 22 nm, with which a sensitivity of up to 91 dB (830 µW ) and an axial resolution of 10.7 µm was measured. Design 2 supports a bandwidth of 48 nm, with which a sensitivity of 90 dB (480 µW ) and an axial resolution of 6.5 µm was measured. The silicon nitride-based integrated optical waveguides were fabricated with a fully CMOS-compatible process, which allows their monolithic co-integration on top of an optoelectronic silicon chip. As a benchmark for chip-based optical coherence tomography, tomograms generated by a commercially available clinical spectral-domain optical coherence tomography system were compared to those acquired with on-chip gratings. The similarities in the tomograms demonstrate the significant clinical potential for further integration of optical coherence tomography on a chip system.
Overview
The claims and statistics of this paper haven’t been checked yet.
Run the check — free, no account needed. It reads the open-access text and checks the sources it cites.
Integrity signals
Registry
Cites
Statistics
Figures
Verification
Claims the paper makes
The claims and statistics of this paper haven’t been checked yet.
Run the check — free, no account needed. It reads the open-access text and checks the sources it cites.
Claims other papers make about this one
Each is checked against this paper’s own text: does it say what the citing paper says it does?
The source backs part of the claim, not all of it — or backs it for a different population, condition or comparison.
In the citing paper
“Current silicon photonics swept-source OCT prototypes for retinal imaging suffer from poor sensitivity159.”
From Roadmapping the next generation of silicon photonics (2024) · cites this paper as [159]
Experimental — accuracy not yet measured
Self-check
Percentages, sums and reported differences re-computed from the paper’s own numbers.
The self-check needs the paper’s full text.
Citations
The citation lists are queued
They are fetched later and appear here then.
References 49 · Cited by 106
Research works printed but not linked: 48
- Drexler, W. & Fujimoto, J. G. Optical Coherence Tomography-Technology and Applications. (Cham: Springer International Publishing, 2015). · DOI
- Swanson, E. A. & Fujimoto, J. G. The ecosystem that powered the translation of OCT from fundamental research to clinical and commercial impact. Biomed. Opt. Express 8, 1638–1664 (2017). · DOI
- Wojtkowski, M. et al. In vivo human retinal imaging by Fourier domain optical coherence tomography. J. Biomed. Opt. 7, 457–463 (2002). · DOI
- De Boer, J. F., Leitgeb, R. & Wojtkowski, M. Twenty-five years of optical coherence tomography: the paradigm shift in sensitivity and speed provided by Fourier domain OCT [Invited]. Biomed. Opt. Express 8, 3248–3280 (2017). · DOI
- Chopra, R. & Keane, P. Optical coherence tomography-reinventing the eye examination. Eye News 23, 3 (2016).
- McNamara, P. M. et al. Development of a first-generation miniature multiple reference optical coherence tomography imaging device. J. Biomed. Opt. 21, 126020 (2016). · DOI
- Song, G. et al. First clinical application of low-cost OCT. Transl. Vis. Sci. Technol. 8, 61 (2019). · DOI
- Kim, S. et al. Design and implementation of a low-cost, portable OCT system. Biomed. Opt. Express 9, 1232–1243 (2018). · DOI
- Yang, J. L. et al. Handheld optical coherence tomography angiography. Biomed. Opt. Express 8, 2287–2300 (2017). · DOI
- Lu, C. D. et al. Handheld ultrahigh speed swept source optical coherence tomography instrument using a MEMS scanning mirror. Biomed. Opt. Express 5, 293–311 (2014). · DOI
- LaRocca, F. et al. Handheld simultaneous scanning laser ophthalmoscopy and optical coherence tomography system. Biomed. Opt. Express 4, 2307–2321 (2013). · DOI
- Hainberger, R. et al. Silicon-nitride waveguide-based integrated photonic circuits for medical diagnostic and other sensing applications. in Proc. SPIE, Smart Photonic and Optoelectronic Integrated Circuits XXI (SPIE, San Francisco, 2019). · DOI
- Rahim, A. et al. Expanding the silicon photonics portfolio with silicon nitride photonic integrated circuits. J. Lightwave Technol. 35, 639–649 (2017). · DOI
- Yurtsever, G. et al. Integrated photonic circuit in silicon on insulator for Fourier domain optical coherence tomography. in Proc. SPIE, Optical Coherence Tomography and Coherence Domain Optical Methods in Biomedicine XIV. (SPIE, San Francisco, 2010). · DOI
- Yurtsever, G., Komorowska, K. & Baets, R. Low dispersion integrated Michelson interferometer on silicon on insulator for optical coherence tomography. in Proc. SPIE, Optical Coherence Tomography and Coherence Techniques V. (SPIE, Munich, 2011). · DOI
- Nguyen, V. D. et al. Integrated-optics-based swept-source optical coherence tomography. Opt. Lett. 37, 4820–4822 (2012). · DOI
- Van Leeuwen, T. G. et al. On-chip Mach-zehnder interferometer for OCT systems. Adv. Opt. Technol. 7, 103–106 (2018). · DOI
- Schneider, S. et al. Optical coherence tomography system mass-producible on a silicon photonic chip. Opt. Express 24, 1573–1586 (2016). · DOI
- Wang, Z. et al. Silicon photonic integrated circuit swept-source optical coherence tomography receiver with dual polarization, dual balanced, in-phase and quadrature detection. Biomed. Opt. Express 6, 2562–2574 (2015). · DOI
- Huang, Y. Y. et al. Wide-field high-speed space-division multiplexing optical coherence tomography using an integrated photonic device. Biomed. Opt. Express 8, 3856–3867 (2017). · DOI
- Eggleston, M. S. et al. 90 dB sensitivity in a chip-scale swept-source optical coherence tomography system. Conference on Lasers and Electro-Optics. (Optical Society of America, San Jose, 2018). · DOI
- Sancho-Durá, J. et al. Handheld multi-modal imaging for point-of-care skin diagnosis based on akinetic integrated optics optical coherence tomography. J. Biophotonics 11, e201800193 (2018). · DOI
- Smit, M. K. New focusing and dispersive planar component based on an optical phased array. Electron. Lett. 24, 385–386 (1988). · DOI
- Nguyen, V. D. et al. Spectral domain optical coherence tomography imaging with an integrated optics spectrometer. Opt. Lett. 36, 1293–1295 (2011). · DOI
- Akca, B. I. et al. Toward spectral-domain optical coherence tomography on a chip. IEEE J. Sel. Top. Quantum Electron. 18, 1223–1233 (2012). · DOI
- Akca, B. I. et al. Miniature spectrometer and beam splitter for an optical coherence tomography on a silicon chip. Opt. Express 21, 16648–16656 (2013). · DOI
- Ruis, R. M. et al. Decreasing the size of a spectral domain optical coherence tomography system with cascaded arrayed waveguide gratings in a photonic integrated circuit. IEEE J. Sel. Top. Quantum Electron. 25, 6100109 (2019). · DOI
- Ollion, J. et al. TANGO: a generic tool for high-throughput 3D image analysis for studying nuclear organization. Bioinformatics 29, 1840–1841 (2013). · DOI
- Leitgeb, R., Hitzenberger, C. K. & Fercher, A. F. Performance of fourier domain vs. time domain optical coherence tomography. Opt. Express 11, 889–894 (2003). · DOI
- Hitzenberger, C. K. Optical measurement of the axial eye length by laser Doppler interferometry. Investig. Ophthalmol. Vis. Sci. 32, 616–624 (1991).
- Chan, A. N. et al. Normal macular thickness measurements in healthy eyes using stratus optical coherence tomography. Arch. Ophthalmol. 124, 193–198 (2006). · DOI
- Takada, N. et al. OCT-Based quantification and classification of optic disc structure in glaucoma patients. PLoS ONE 11, e0160226 (2016). · DOI
- Kashani, A. H. et al. Optical coherence tomography angiography: a comprehensive review of current methods and clinical applications. Prog. Retinal Eye Res. 60, 66–100 (2017). · DOI
- Camino, A. et al. Evaluation of artifact reduction in optical coherence tomography angiography with real-time tracking and motion correction technology. Biomed. Opt. Express 7, 3905–3915 (2016). · DOI
- Spaide, R. F., Koizumi, H. & Pozonni, M. C. Enhanced depth imaging spectral-domain optical coherence tomography. Am. J. Ophthalmol. 146, 496–500 (2008). · DOI
- Singh, S. R. et al. Unique optical coherence tomographic features in age-related macular degeneration. Surv. Ophthalmol. https://doi.org/10.1016/j.survophthal.2020.01.001 (2020). · DOI
- Vlaskovic, M. et al. PIN-photodiode based active pixel in 0.35 μm high-voltage CMOS for optical coherence tomography. in Proc. 2019 42nd International Convention on Information and Communication Technology, Electronics and Microelectronics. (IEEE, Opatija, 2019). · DOI
- Haindl, R. et al. Ultra-high-resolution SD-OCM imaging with a compact polarization-aligned 840 nm broadband combined-SLED source. Biomed. Opt. Express 11, 3395–3406 (2020). · DOI
- Seyringer, D. Arrayed Waveguide Gratings. (Bellingham: SPIE Press, 2016).
- Seyringer, D. et al. Design and optimization of high-channel Si3N4 based AWGs for medical applications. in Proc. 6th International Conference on Photonics, Optics and Laser Technology. (SCITEPRESS—Science and Technology Publications, 2018). · DOI
- Seyringer, D. et al. Technological verification of size-optimized 160-channel silicon nitride-based AWG-spectrometer for medical applications. Appl. Phys. B 125, 88 (2019). · DOI
- Sagmeister, M. et al. Monolithically integrated, CMOS-compatible SiN photonics for sensing applications. Proceedings 2, 1023 (2018). · DOI
- Seyringer, D. et al. Compact and high-resolution 256-channel silicon nitride based AWG-spectrometer for OCT on a chip. in Proc. 2019 21st International Conference on Transparent Optical Networks. (IEEE, Angers, 2019). · DOI
- Dorrer, C. et al. Spectral resolution and sampling issues in Fourier-transform spectral interferometry. J. Opt. Soc. Am. B 17, 1795–1802 (2000). · DOI
- Wu, T. et al. Spectral phase based k-domain interpolation for uniform sampling in swept-source optical coherence tomography. Opt. Express 19, 18430–18439 (2011). · DOI
- Wojtkowski, M. et al. Ultrahigh-resolution, high-speed, Fourier domain optical coherence tomography and methods for dispersion compensation. Opt. Express 12, 2404–2422 (2004). · DOI
- Thevenaz, P., Ruttimann, U. E. & Unser, M. A pyramid approach to subpixel registration based on intensity. IEEE Trans. Image Process. 7, 27–41 (1998). · DOI
- Salas, M. et al. Compact akinetic swept source optical coherence tomography angiography at 1060 nm supporting a wide field of view and adaptive optics imaging modes of the posterior eye. Biomed. Opt. Express 9, 1871–1892 (2018). · DOI
Metadata
- Authors
- Rank, E. A., Sentosa, R., Harper, D. J., Salas, M., Gaugutz, A., Seyringer, D., Nevlacsil, S., Maese-Novo, A., Eggeling, M., Muellner, P., Hainberger, R., Sagmeister, M., Kraft, J., Leitgeb, R. A., & Drexler, W.
- Affiliations
- Medical University of Vienna (AT)
- Vorarlberg University of Applied Sciences (AT)
- AIT Austrian Institute of Technology GmbH (AT)
- AMS (Austria) (AT)
- Corresponding author
- Rank, Elisabet A.
- ORCID
- Venue
- Light: Science & Applications
- Published
- 2021-01-05
- Volume
- 10
- Issue
- 1
- Pages
- 6-6
- ISSN
- 2047-7538 (ISSN-L)
- PMC
- PMC7785745
- OpenAlex
- W3119998490
- Cited by
- 106
- References
- 49
- Citations by year
- 2026: 15 · 2025: 29 · 2024: 26 · 2023: 17 · 2022: 6 · 2021: 13
- FWCI
- 4.71
- Type
- journal article
- Language
- en
- Open access
- gold
- doi.org
- Locations
- Light Science & Applications (publishedVersion, cc-by)
- PubMed Central (publishedVersion, cc-by)
- PubMed (publishedVersion)
- Apollo (University of Cambridge) (submittedVersion, cc-by)
- DOAJ (DOAJ: Directory of Open Access Journals) (submittedVersion, cc-by-sa)
- Funders
- Österreichische Forschungsförderungsgesellschaft (848588)
- EC | Horizon 2020 Framework Programme (732969)
- Topics
- Physical Sciences › Engineering › Biomedical Engineering › Optical Coherence Tomography Applications
- Physical Sciences › Engineering › Electrical and Electronic Engineering › Photonic and Optical Devices
- Physical Sciences › Physics and Astronomy › Atomic and Molecular Physics, and Optics › Adaptive optics and wavefront sensing
- Keywords
- optical coherence tomography, arrayed waveguide grating, photonic integrated circuits, retinal imaging, retinal angiography, silicon nitride waveguides, CMOS-compatible photonics, spectral-domain optical coherence tomography, axial resolution, sensitivity, in vivo imaging
About these checks
Registry, retraction, Cites and statistics results are computed, not judged, with one exception: a printed reference that no index lists is read once by a model before it counts as a citation error. Claims are extracted by a model and kept only when their quote appears verbatim in the text; each cited source is then checked, with a model’s help, for whether it says what the claim relies on. Those verdicts can be wrong — read the claim’s quote and the cited source before relying on one.
Statistics and arithmetic are recomputed, not judged.
Confidence bands are shown only for fields calibrated on our annotated test set. None is calibrated yet, so no band is shown.
What counts as a claim ›How we measure confidence ›How we check this ›
Are you an author, or do you see a problem with this page? Request a review
How to cite
Cite CoChat for the checks on this page, and the paper for its own findings.
- This page
- CoChat. (2026). Citation check: Toward optical coherence tomography on a chip: in vivo three-dimensional human retinal imaging using photonic integrated circuit-based arrayed waveguide gratings. https://app.cochat.ai/papers/10.1038/s41377-020-00450-0
- The paper
- Rank, E. A., Sentosa, R., Harper, D. J., Salas, M., Gaugutz, A., Seyringer, D., Nevlacsil, S., Maese-Novo, A., Eggeling, M., Muellner, P., Hainberger, R., Sagmeister, M., Kraft, J., Leitgeb, R. A., & Drexler, W. (2021). Toward optical coherence tomography on a chip: in vivo three-dimensional human retinal imaging using photonic integrated circuit-based arrayed waveguide gratings. Light: Science & Applications. https://doi.org/10.1038/s41377-020-00450-0
