

Machine learning powered ellipsometry
Open accessThe DOI matches its Crossref record; 57 of the 59 references it cites were found in a registry or an index.
Abstract
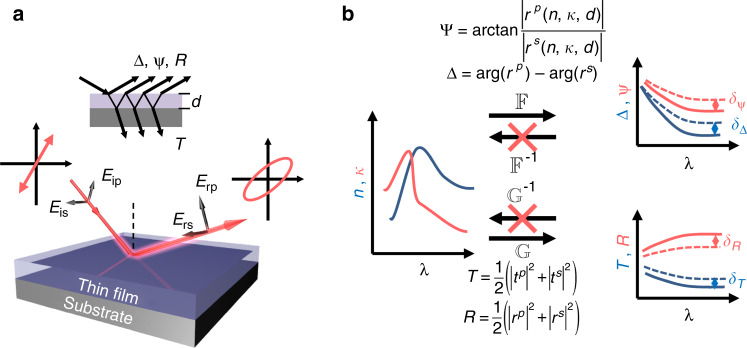
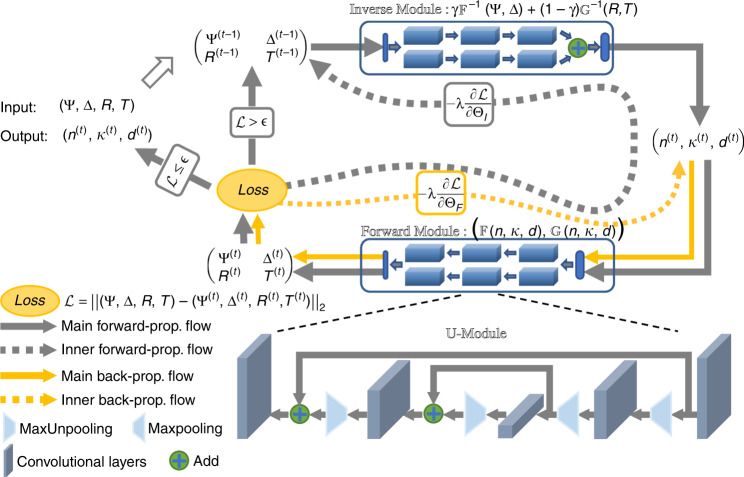
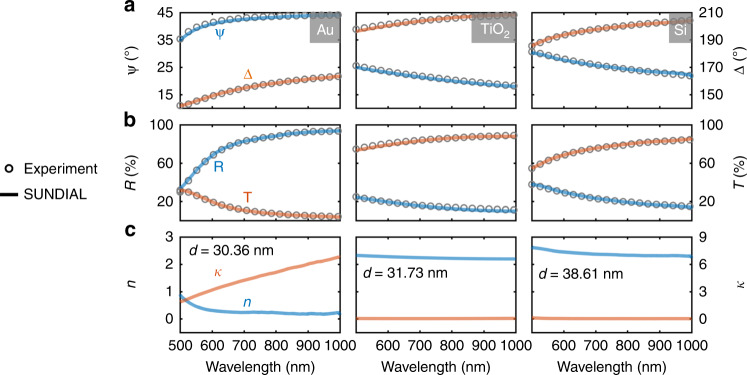
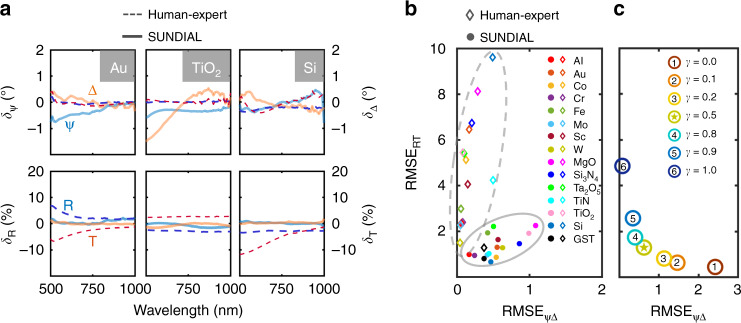
Ellipsometry is a powerful method for determining both the optical constants and thickness of thin films. For decades, solutions to ill-posed inverse ellipsometric problems require substantial human–expert intervention and have become essentially human-in-the-loop trial-and-error processes that are not only tedious and time-consuming but also limit the applicability of ellipsometry. Here, we demonstrate a machine learning based approach for solving ellipsometric problems in an unambiguous and fully automatic manner while showing superior performance. The proposed approach is experimentally validated by using a broad range of films covering categories of metals, semiconductors, and dielectrics. This method is compatible with existing ellipsometers and paves the way for realizing the automatic, rapid, high-throughput optical characterization of films.
Overview
The claims and statistics of this paper haven’t been checked yet.
Free: it reads the open-access text and checks the first 5 claims that cite a source we can check. Create a free account to check every claim.
Integrity signals
Registry
Cites
Statistics
Figures
Verification
Claims the paper makes
The claims and statistics of this paper haven’t been checked yet.
Free: it reads the open-access text and checks the first 5 claims that cite a source we can check. Create a free account to check every claim.
Self-check
Percentages, sums and reported differences re-computed from the paper’s own numbers.
The self-check needs the paper’s full text.
Citations
Cites
Deep Residual Learning for Image Recognition
He, K., Zhang, X., Ren, S., & Sun, J. (2016) · 2016 IEEE Conference on Computer Vision and Pattern Recognition (CVPR) · doi:10.1109/cvpr.2016.90 · Cited by 235,474
LeCun, Y., Bengio, Y., & Hinton, G. (2015) · Nature · doi:10.1038/nature14539 · Cited by 84,126
He, K., Gkioxari, G., Dollar, P., & Girshick, R. (2017) · 2017 IEEE International Conference on Computer Vision (ICCV) · doi:10.1109/iccv.2017.322 · Cited by 29,137
Principles of Optics: 60th Anniversary Edition
Born, M., & Wolf, E. (2019) · Cambridge University Press eBooks · doi:10.1017/9781108769914 · Cited by 26,251
Handbook of Optical Constants of Solids
(1985) · Elsevier eBooks · doi:10.1016/c2009-0-20920-2 · Cited by 20,926
Optical Constants of the Noble Metals
Johnson, P. B., & Christy, R. W. (1972) · Physical Review B · doi:10.1103/physrevb.6.4370 · Cited by 20,094
Mastering the game of Go with deep neural networks and tree search
Silver, D., Huang, A., Maddison, C. J., Guez, A., Sifre, L., van den Driessche, G., Schrittwieser, J., Antonoglou, I., Panneershelvam, V., Lanctot, M., et al. (2016) · Nature · doi:10.1038/nature16961 · Cited by 15,612
Solutions of Ill-Posed Problems.
Bell, J. B., Tikhonov, A. N., & Arsenin, V. Y. (1978) · Mathematics of Computation · doi:10.2307/2006360 · Cited by 8,101
Inverse Problem Theory and Methods for Model Parameter Estimation
Tarantola, A. (2005) · doi:10.1137/1.9780898717921 · Cited by 6,585
Google's Neural Machine Translation System: Bridging the Gap between Human and Machine Translation
Wu, Y., Schuster, M., Chen, Z., Le, Q. V., Norouzi, M., Macherey, W., Krikun, M., Cao, Y., Gao, Q., Macherey, K., et al. (2016) · arXiv · doi:10.48550/arxiv.1609.08144 · Cited by 5,319
Research works printed but not linked: 1
- Born, M. & Wolf, E. Principles of Optics. 7th edn. (Cambridge University Press, Cambridge, 2013).
Cited by
Bridging Nanomanufacturing and Artificial Intelligence—A Comprehensive Review
Nandipati, M., Fatoki, O., & Desai, S. S. (2024) · Materials · doi:10.3390/ma17071621 · Cited by 128
“Several authors have discussed how machine learning can be utilized with spectroscopic ellipsometry to also replace complex optical modeling [181,182].”
BackgroundMetasurface array for single-shot spectroscopic ellipsometry
Wen, S., Xue, X., Wang, S., Ni, Y., Sun, L., & Yang, Y. (2024) · Light Science & Applications · doi:10.1038/s41377-024-01396-3 · Cited by 100
“To further enhance the speed and accuracy of the reconstruction, one may implement deep learning-based algorithms for both steps 45,48,64,65 .”
MethodMetasurface higher-order poincaré sphere polarization detection clock
Yang, H., Ou, K., Liu, Q., Peng, M., Xie, Z., Jiang, Y., Jia, H., Cheng, X., Jing, H., Hu, Y., et al. (2025) · Light Science & Applications · doi:10.1038/s41377-024-01738-1 · Cited by 82
“…precise identi fi cation of SoPs that denoted by points on the HOPS, is essential in numerous domains such as polarization imaging 11 , remote sensing 12 , material analysis 13 , optical trapping 14,15 , high-dimensional quantum technology 16,17 , optical data storage and communication 9,18 – 20 .”
Politano, G. G., & Versacé, C. (2023) · Spectroscopy Journal · doi:10.3390/spectroscj1030014 · Cited by 69
An introduction to terahertz time-domain spectroscopic ellipsometry
Chen, X., & Pickwell-MacPherson, E. (2022) · APL Photonics · doi:10.1063/5.0094056 · Cited by 50
Metadata
- Authors
- Liu, J., Zhang, D., Yu, D., Ren, M., & Xu, J.
- Affiliations
- Nankai University (CN)
- Shanxi University (CN)
- Corresponding author
- Ren, Mengxin
- Xu, Jingjun
- Venue
- Light: Science & Applications
- Published
- 2021-03-12
- Volume
- 10
- Issue
- 1
- Pages
- 55-55
- ISSN
- 2047-7538 (ISSN-L)
- PMC
- PMC7952555
- OpenAlex
- W3135793694
- Semantic Scholar
- 0dba5fc96fb4846d31a705504b85c2572125d7c1
- Cited by
- 102
- References
- 59
- Citations by year
- 2026: 27 · 2025: 22 · 2024: 22 · 2023: 15 · 2022: 12 · 2021: 4
- FWCI
- 4.03
- Type
- journal article
- Language
- en
- Open access
- gold
- doi.org
- Licence
- cc-by
- creativecommons.org/licenses/by/4.0 (tdm)
- creativecommons.org/licenses/by/4.0 (vor)
- Locations
- Light Science & Applications (publishedVersion, cc-by)
- PubMed Central (publishedVersion, cc-by)
- PubMed (publishedVersion)
- DOAJ (DOAJ: Directory of Open Access Journals) (submittedVersion, cc-by-sa)
- Funders
- National Natural Science Foundation of China (2020B0301030009, 111 Project, 12074200, 11904182, 92050114, 11374006, B07013, 61775106, 61633012, 2017YFA0303800, 11774185, 11711530205, 2019YFA0705000, 62076140, 91750204)
- Tsinghua University
- Nankai University
- Higher Education Discipline Innovation Project (B07013, IRT0149)
- Fundamental Research Funds for the Central Universities (010-63201008, 010-63201009, 2019YFA0705000, 010‐63201003, 2017YFA0303800)
- Topics
- Physical Sciences › Physics and Astronomy › Atomic and Molecular Physics, and Optics › Optical Polarization and Ellipsometry
- Physical Sciences › Materials Science › Materials Chemistry › Machine Learning in Materials Science
- Physical Sciences › Materials Science › Electronic, Optical and Magnetic Materials › Metamaterials and Metasurfaces Applications
- Keywords
- ellipsometry, machine learning, inverse problems, optical constants, thin film thickness, high-throughput characterization, metals, semiconductors, dielectric materials
About these checks
Registry, retraction, Cites and statistics results are computed, not judged, with one exception: a printed reference that no index lists is read once by a model before it counts as a citation error. Claims are extracted by a model and kept only when their quote appears verbatim in the text; each cited source is then checked, with a model’s help, for whether it says what the claim relies on. Those verdicts can be wrong — read the claim’s quote and the cited source before relying on one.
Statistics and arithmetic are recomputed, not judged.
Confidence bands are shown only for fields calibrated on our annotated test set. None is calibrated yet, so no band is shown.
What counts as a claim ›How we measure confidence ›How we check this ›
Are you an author, or do you see a problem with this page? Request a review
How to cite
Cite CoChat for the checks on this page, and the paper for its own findings.
- This page
- CoChat. (2026). Citation check: Machine learning powered ellipsometry. https://app.cochat.ai/papers/10.1038/s41377-021-00482-0
- The paper
- Liu, J., Zhang, D., Yu, D., Ren, M., & Xu, J. (2021). Machine learning powered ellipsometry. Light: Science & Applications. https://doi.org/10.1038/s41377-021-00482-0
Data sources
Bibliographic data: Semantic Scholar, OpenAlex, Crossref.
Contains information from the Semantic Scholar Academic Graph Datasets, made available under the ODC Attribution License (ODC-BY 1.0).
Semantic Scholar’s data is described in: Kinney, R., et al. (2023). The Semantic Scholar Open Data Platform. arXiv:2301.10140.
